ETH: Price Slice. Capital Sector. 2648.94 🏷 ETH: Price Slice. Capital Sector. Dated: 13.12.2025
🏷 2648.94 — Price not yet reached at time of publication
🏷 BPC — The Bolzen Price Covenant 5
🏷 Screenshot
🏷 Interactive Reference Guide: BPC — The Bolzen Price Covenant
🏷 P.S. English is not my native language — I offer no apologies for stylistic imperfections. What you see here is not a post. It is a demonstration of another level of preparation: the symbiosis of human intuition and algorithmic precision. Mathematics and aggressive market analysis — against the machine of liquidations.
The Architect
BPC — The Bolzen Price Covenant
ETH

ETH: Price Slice. Capital Sector. 3359.94🏷 ETH: Price Slice. Capital Sector. Dated: 12.12.2025
🏷 3359.94 — Price not yet reached at time of publication
🏷 BPC — The Bolzen Price Covenant 3
🏷 Screenshot
🏷 Interactive Reference Guide: BPC — The Bolzen Price Covenant
🏷 P.S. English is not my native language — I offer no apologies for stylistic imperfections. What you see here is not a post. It is a demonstration of another level of preparation: the symbiosis of human intuition and algorithmic precision. Mathematics and aggressive market analysis — against the machine of liquidations.
The Architect
BPC — The Bolzen Price Covenant

ETH: Price Slice. Capital Sector. 3499.94🏷 ETH: Price Slice. Capital Sector. Dated: 12.12.2025
🏷 3499.94 — Price not yet reached at time of publication
🏷 BPC — The Bolzen Price Covenant 2
🏷 Screenshot
🏷 Interactive Reference Guide: BPC — The Bolzen Price Covenant
🏷 P.S. English is not my native language — I offer no apologies for stylistic imperfections. What you see here is not a post. It is a demonstration of another level of preparation: the symbiosis of human intuition and algorithmic precision. Mathematics and aggressive market analysis — against the machine of liquidations.
The Architect
BPC — The Bolzen Price Covenant

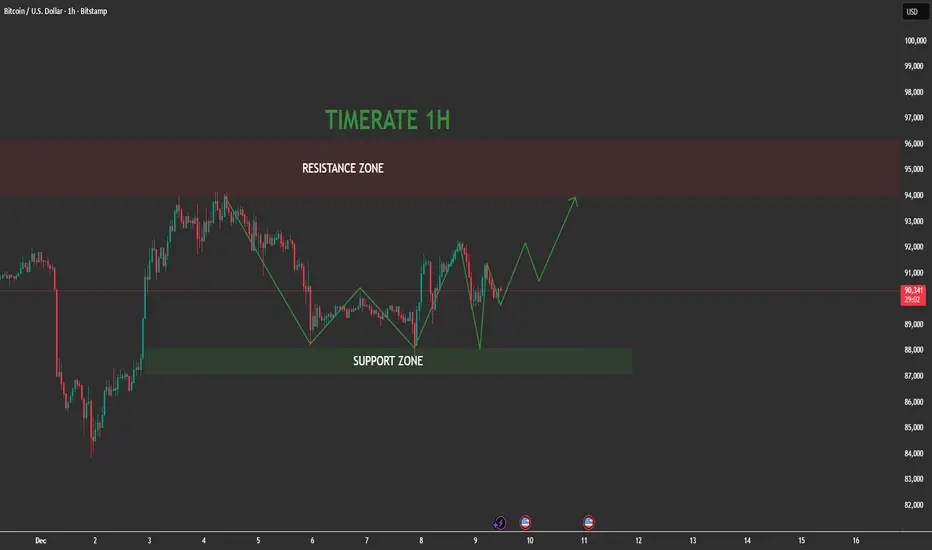
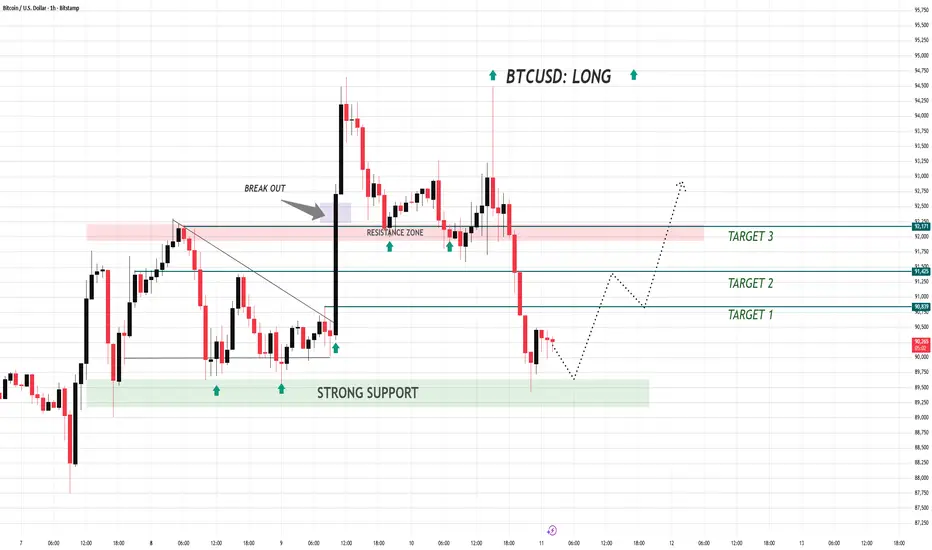
Is Bitcoin Quietly Building Power for a Breakout?📌 1. Market Structure
Bitcoin on the 1H timeframe is forming a clear higher-low structure off the support zone.
Price rejected the green support block aggressively, showing buyer absorption.
The current structure is transitioning from a consolidation phase into a potential bullish continuation leg.
📌 2. Key Zones
Support Zone (Strong Demand):
- Located around the $88,800 – $89,400 region.
- Price has tapped this zone multiple times and continues to bounce — clear demand.
Resistance Zone (Major Supply):
- The large red block at $94,000 – $97,600.
- This is the target zone for the next impulse move.
📌 3. Price Action
- Price formed a V-shaped recovery from support.
- Followed by a sequence of HL → HH attempts, signaling trend resumption.
- The latest pullback is shallow — a bullish sign showing sellers are weak.
- The green projection aligns perfectly with standard bullish market flow:
higher low → push up → correction → strong breakout leg.
Momentum is slowly shifting from neutral to bullish.
📌 4. Technical Confirmation
-Buyers defended support with strong reaction wicks.
-No breakdown beneath the key swing low — bullish structure intact.
-Mid-range is now acting as a local accumulation zone.
-Liquidity above $91,200 and $92,500 is likely to be targeted next.
This setup aligns with classic trend continuation inside a wide range.
📌 5. Trading Plan (Entry – SL – TP)
🎯 Long Setup
Entry: 90,300 – 90,450
Stop Loss: 89,650 (below last swing low & support zone)
Take Profit 1: 92,500
Take Profit 2: 94,800
Final Target: 97,500 (top of resistance zone)
Why this works:
You’re entering on a bullish higher low, with low risk and high reward as price moves toward the resistance block.
GOLD CYCLE ANALYSIS - WAVE 5 PATTERN EMERGING1️⃣ MACRO CONTEXT — GLOBAL CONDITIONS ARE RELOADING GOLD’S NEXT MEGA WAVE
Gold is entering a multi-year super-cycle powered by a rare combination of global instability and monetary shifts:
- Ongoing geopolitical conflicts (Ukraine, Middle East) continue to elevate safe-haven demand.
- U.S. economic momentum is slowing → rising recession probability.
- The market is pricing in aggressive Fed rate cuts in the coming year → real yields cooling, a direct catalyst for gold upside.
- Central banks (China, India, Turkey) are buying gold at the fastest pace in 50 years, diversifying away from the USD.
These macro foundations perfectly align with the repetitive growth cycle pattern displayed in chart.
2️⃣ STRUCTURAL ANALYSIS — GOLD IS REPEATING ITS 5-WAVE GROWTH CYCLE
On the 1D chart, gold is moving exactly within a classic 5-wave impulsive cycle:
Wave 1: A long accumulation zone → first breakout.
Wave 2: Shallow correction, maintaining higher lows.
Wave 3:The strongest expansion phase — identical to the 2024–2025 rally.
Wave 4: A consolidation wedge + sideway pullback inside the green zone you marked.
Wave 5 (Forming Now): The next explosive leg upward, projected by the white path on your chart.
Price is currently sitting inside Accumulation Zone 4, building energy before launching the final impulsive wave.
3️⃣TRADE SCENARIO — BASED ON STRUCTURE + MACRO ALIGNMENT
🔵 Primary Scenario: Bullish Super-Cycle Continues
If price holds the ascending yellow trendline and the Zone 4 support:
- Gold completes its corrective zigzag → then accelerates into Wave 5, aiming for new all-time highs.
Macro factors reinforce this bullish scenario:
- Fed rate cuts expected → lower real yields.
- USD entering a weakening cycle.
- Geopolitical tensions remain elevated.
- Central banks increasing gold reserves aggressively.
→ This is the dominant, high-probability scenario.
🔴 Secondary Scenario: Macro Repricing Pullback
Only triggered if:
- The Fed unexpectedly turns hawkish again (low probability),
- Geopolitical tensions ease significantly (low probability).
In that case, gold may retest lower zones:
3125 → 2523, exactly as marked on your chart.
4️⃣ RISK MANAGEMENT — WHEN THE MODEL FAILS
The super-cycle view becomes invalid if:
- Daily close breaks below the green Wave 4 accumulation zone.
- U.S. bond yields spike sharply higher again.
- DXY rallies above 115.
These conditions contradict the current global macro trajectory, so the probability remains low.
5️⃣ GOLD’S 5-WAVE PATTERN IS NOT RANDOM
Each accumulation zone (1–2–3–4) shares identical behavior:
- 6–12 weeks of tight consolidation
- Breakout triggered by macro news
- Each impulsive wave larger than the previous one
This is the footprint of a long-term impulsive super-cycle, currently unfolding from 2023–2026.
Given the macro backdrop and repeated structural pattern, Wave 5 is positioned to become the strongest and most extended wave of this entire cycle.
I

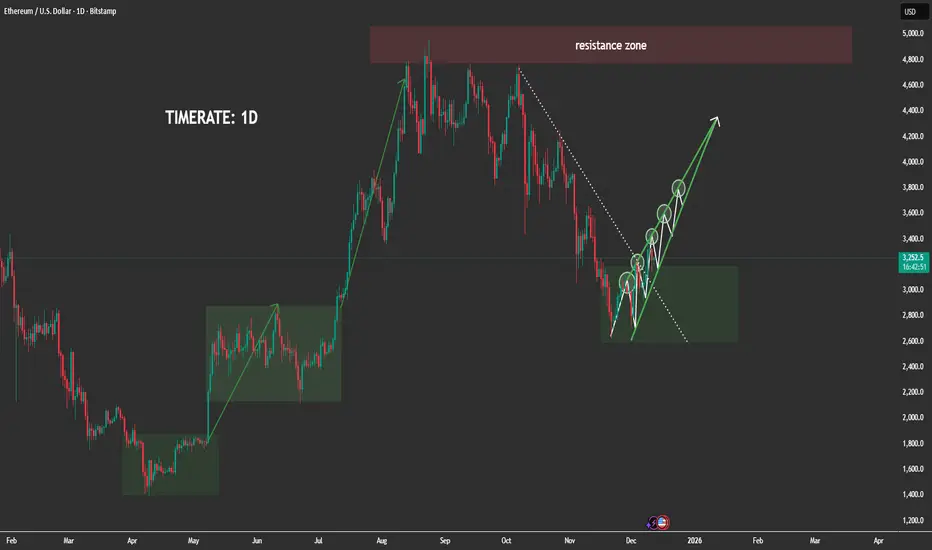
The ETH Move No Trader Is ExpectingETHEREUM 1D MARKET ANALYSIS
1. Current Price Structure
- ETH previously completed a strong bullish impulsive wave, breaking through multiple resistance levels before reaching the major 4,800–5,000 resistance zone, where the market formed a clear distribution top.
-After distribution, price entered a large corrective decline, following the descending dotted trendline visible on your chart.
-Recently, ETH has formed a broad accumulation block (highlighted in green), similar to the previous accumulation phases that triggered massive ETH rallies earlier in the year.
Inside this zone, ETH is now building a series of higher lows, showing early signs of bullish reconstruction.
-The current rising green structure indicates that price is forming a stair-step bullish pattern, preparing for a potential macro reversal.
2. Key Liquidity Zones
-Major Resistance Zone: 4,800–5,000
-This is the next major destination if ETH successfully completes the accumulation and transitions into expansion.
-Accumulation Block: 2,750–3,150
-This is where smart money is currently active — sweeping liquidity, trapping sellers, and accumulating long positions.
-Multiple liquidity grabs have already occurred inside this range, confirming strong institutional absorption.
-The current structure closely mirrors previous accumulation rectangles on the chart that led to massive bullish expansions.
3. Today's Market Scenario (1D Outlook)
Matches perfectly with the upward projection on your chart.
🔹 Main Scenario – Bullish Continuation After Accumulation
ETH is likely to follow this sequence:
-Continue building higher lows inside the accumulation block.
-Retest the inner structure trendline without breaking the macro zone.
-Form a clean break above the descending dotted trendline — signaling a bullish structure shift.
-Retest the broken trendline to form the final higher low.
-Begin expansion to the next major liquidity magnets:
-Short-term targets: 3,600 → 3,800
-Mid-term continuation: 4,200 → 4,500
-Macro target: 4,800–5,000 resistance zone
This is fully aligned with the green arrow projection you drew.
4. Market Psychology
-Big players are actively accumulating within this wide range clear repeated liquidity sweeps prove institutional activity.
-Retail traders are losing positions during sudden spikes and false breakdowns, which is typical behavior during accumulation phases.
-The market is more likely preparing for a major trend reversal, not a continuation downward.
-The price behavior mirrors earlier patterns:
Accumulation → Trendline Break → HL Retest → Massive Expansion
-This repetition increases confidence in the bullish outlook.
5. Intraday Strategy Guidance (1D)
Given the macro accumulation:
-Avoid selling aggressively the probability is against sustained bearish continuation.
-Best opportunities come from buying dips inside the accumulation zone.
-Watch for liquidity sweeps below local lows to identify smart-money entries.
High-probability setups:
✔️ Strategy 1: Buy the Bottom of the Range
Entry zones: 2,750–3,150
Targets: 3,600 → 3,800
✔️ Strategy 2: Buy the Retest After Trendline Breakout
This is the cleanest and safest setup.
Targets: 4,200 → 4,500 → 4,800+
ETH is currently in the prime zone where large investors position themselves before a new bullish cycle.
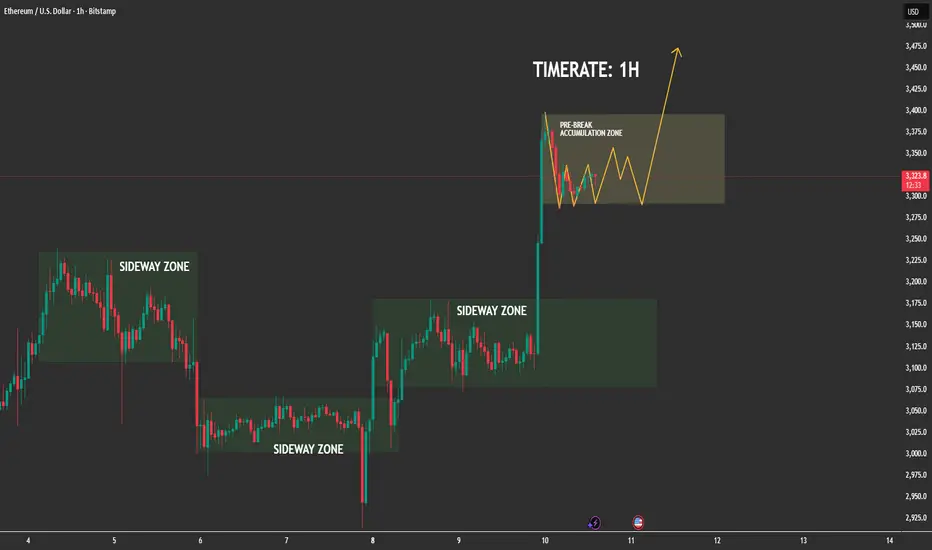
Ethereum Has Entered Its Pre-Expansion Accumulation📊 (1) MARKET STRUCTURE — CLEAN SIDEWAY → BREAKOUT → RE-ACCUMULATION
The chart shows a repeating pattern:
✔ Phase 1: Sideway Zone
ETH repeatedly compresses in sideways zones, forming liquidity pools and equal highs/lows.
✔ Phase 2: Breakout With Strong Momentum
Each sideways block ends with a powerful impulsive candle clear evidence of aggressive buy-side imbalance.
✔ Phase 3: Post-Break Re-Accumulation (CURRENT PHASE)
Price is now inside the highlighted pre-break accumulation zone,
moving in a tight, controlled structure a textbook bullish continuation setup.
This is the phase where institutional traders rebalance orders before the next run.
📍 (2) PRICE BEHAVIOR — BULLS IN FULL CONTROL
-No sharp rejections after the breakout
-Dips are shallow and quickly absorbed
-Market is forming higher low micro-structures
-Momentum clearly stays in the hands of buyers
This confirms the market is not distributing, but absorbing liquidity and building a base.
🌐 (3) MACRO FACTORS SUPPORTING ETH UPSIDE
✔ ETH ETF Approval Momentum (US + Asia)
Regulatory mood continues shifting positively, with multiple jurisdictions preparing Ethereum ETF products. Institutional demand keeps increasing quietly in the background.
✔ Falling US Inflation & Dovish Fed Expectations
Recent CPI and PPI reports show cooling inflation. The market widely expects 2025–2026 rate cuts, which historically push liquidity into risk assets ETH benefits directly.
✔ Ethereum Supply Shock
-Over 27% of ETH is staked
-Net supply remains deflationary under high network activity
-Reduced exchange reserves signal accumulation
This creates a tightening supply environment that amplifies price expansion.
✔ Altcoin Rotation Phase
BTC dominance stabilizing → capital increasingly flows into ETH and large-cap alts.
Macro + on-chain + liquidity flows all align with a bullish continuation.
⏳ (4) HTF CONTEXT — BULL CYCLE CONFIRMED
Higher timeframes show:
-ETH broke out of a weekly compression range
-Structure is fully bullish
-Market currently resetting before next leg
-No bearish reversal signals anywhere in sight
This supports the thesis that the current 1H accumulation is not random, it is part of a much larger bullish leg forming.
🚀 (5) EXPECTATION — HIGH PROBABILITY SCENARIO
ETH is expected to:
-Continue oscillating inside the pre-break accumulation zone
-Form a series of small higher lows as drawn
-Absorb liquidity from both sides
-Break out toward 3,400 → 3,450+
The path of least resistance remains upward.
🎯 (6) TRADING INSIGHT (Non-Signal)
Markets only explode after liquidity is collected.
ETH is doing exactly that holding strong after a breakout and compressing before expansion.
This is the signature behaviour of a healthy bullish trend.
EUR/USD Is Compressing — A Breakout Is Getting Close📊 (1) MARKET STRUCTURE
NZD/USD is moving inside a well-defined descending channel, creating:
Lower Highs
Lower Lows
However, the most recent bearish swings are shorter and losing momentum —
a signal that the downtrend is weakening.
📉 (2) PRICE REACTION
Every touch of the channel’s lower boundary triggers a visible reaction upward.
Recent candles show:
Smaller bearish bodies
Wicks rejecting the lows
Early signs of micro higher lows
These elements indicate absorption of sell pressure.
⏳ (3) HTF CONTEXT
On the H1 structure:
Price is sitting at the oversold edge of the channel
Momentum is compressing
The market is forming a tight consolidation zone
This compression phase often precedes a bullish breakout.
📐 (4) EXPECTATION
High-probability scenario:
Price may dip slightly to retest 0.5960 – 0.5965
A new higher low forms
Breakout of the upper channel line
Price extends toward 0.6025 – 0.6040
This is a textbook reversal from the channel floor.
🎯 (5) TRADING SIGNAL
BUY SETUP
Entry: 0.5960 – 0.5965
Stop Loss: Below 0.5940
Take Profit:
TP1: 0.5990
TP2: 0.6015
TP3: 0.6038 (breakout target)
Key Advantages
Weakening bearish momentum
Clean reactions from channel support
Tight compression before breakout
High R:R opportunity with controlled risk

ETH Awaits Direction as Market Prices In Upcoming Fed Signals🔹 MARKET BRIEFING – ETH/USD
Market State:
– Price has broken down from the previous range and is now testing the lower support area, showing weakening momentum after the sharp decline.
Key Levels:
– Support Zone / Target 1: 3152
– Support Zone / Target 2: 3073
– Resistance / Recovery Target 1: 3288
– Resistance / Recovery Target 2: 3393
Next Move:
– Price may form a short-term base around 3152; holding this level could trigger a recovery toward 3288 → 3393.
– If 3152 fails to hold, downside continuation toward 3073 remains the more likely scenario.

Gold Pullback or Reversal? Key Zone Decides the Next Move🔹 MARKET BRIEFING – XAU/USD (1H)
Market State:
– Price is pulling back after the recent bullish impulse and is hovering just above the minor support zone, suggesting a potential retracement setup before continuation.
Key Levels:
– Support / Entry Zone: 4204 – 4205
– Stop-Loss Zone: 4193 – 4194
– Take Profit 1: 4229
– Take Profit 2: 4247
Next Move:
– A clean retest of the 4204–4205 support zone may trigger another bullish leg toward 4229 → 4247, as long as price holds above the 4193–4194 rejection area.

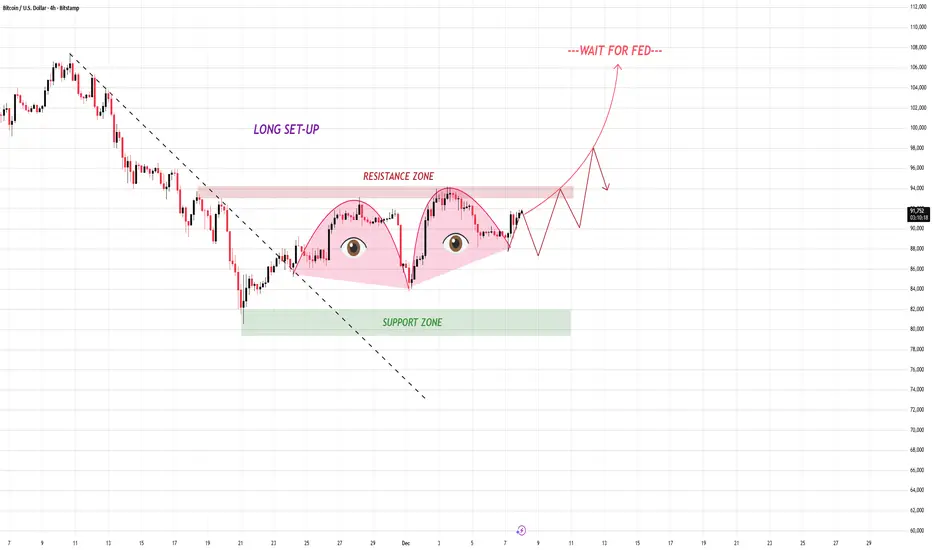
The Market Is Preparing a Bigger Move — Most Traders Won’t See 📌 TECHNICAL BREAKDOWN
1. Support Zone
Buyers consistently defend this area.
Each dip into this zone creates higher momentum on the rebound.
Strong liquidity pool — ideal for building long positions.
2. Resistance Zone (Neckline Zone)
Acts as the confirmation level for the double-bottom pattern.
Break and retest will be the key signal for a continuation run.
This zone contains trapped sellers → breakout may cause a squeeze.
3. Double-Bottom Formation
A textbook reversal pattern indicating exhaustion of the previous downtrend.
Both bottoms show clear absorption and equal reaction.
4. FED Event Catalyst
The “WAIT FOR FED” note on the chart marks a possible volatility spike.
Price may show fakeouts around resistance before choosing a direction.
A manipulation wick above the resistance is possible → be patient and let the market confirm.
📌 TRADE SETUP (LONG BIAS)
🔔 ENTRY ZONE:
Break & Retest of Resistance Zone
→ Enter after price closes above resistance and retests it successfully.
🛑 STOP LOSS:
Below the retest low
→ This protects you from FED-driven fakeouts.
🎯 TAKE PROFIT TARGETS:
TP1: First liquidity sweep after breakout
TP2: New short-term high
TP3: Extended target toward the projected upward curve
📌 BULLISH SCENARIO
- Break resistance
- Retest
- Build higher-lows
- Push into expansion phase
- FED catalyst accelerates breakout
This is the cleanest path and aligns with the chart’s projection.
📌 BEARISH SCENARIO (ALTERNATIVE)
If price fails to break resistance and rejects strongly:
- It may revisit the support zone again
- But as long as support holds, bias remains long
- Only a breakdown below support invalidates the setup
You don’t need to catch every move — you only need to catch the right one with discipline.
BTC Is Retesting the Breakout📊 (1) MARKET STRUCTURE
-BTC formed a strong bullish impulse from the Strong Support Zone, breaking above the descending trendline with a powerful breakout candle.
-This shifted the market structure from bearish → bullish on H1.
📉 (2) PRICE REACTION
After breaking out:
-Price tapped the Weak Support Zone (highlighted purple area)
-Buyers stepped in immediately — confirming support
-Price is now pulling back again into the same demand area
This shows bullish willingness to defend the zone.
📐 (3) HTF CONTEXT
This breakout aligns with broader bullish sentiment:
-BTC continues to create higher swing lows on H1.
-As long as price holds above the Weak Support Zone, the trend remains bullish.
🎯 (4) EXPECTATION
The most likely scenario:
📌 BTC dips into the Weak Support Zone → forms a higher low → rallies toward 94,000 – 95,200.
💥 (5) TRADING SIGNAL
BUY SETUP
Entry Zone:
92,200 – 92,600 (Weak Support Retest Zone)
Stop Loss:
Below 91,700
Take Profit Levels:
TP1: 93,171
TP2: 93,596
TP3: 94,091
Final Target: 95,200
Why this setup works
Strong breakout with volume
Clean retest into fresh demand
Higher-timeframe bullish structure
Buyers showing presence at every dip
This is a low-risk pullback entry inside a bullish continuation setup.

XAUUSD NEWEST TODAY 11, DEC 🔹 MARKET BRIEFING – XAU/USD
Market State:
– Price has bounced strongly from the demand zone and is now holding above the support zone, showing clear bullish momentum.
Key Levels:
– Support Zone: 4218
– Target 1: 4236
– Target 2: 4247
– Target 3: 4259
Next Move:
– Bullish bias remains dominant; a retest of the 4218 support zone could trigger the next upward leg toward 4236 → 4247 → 4259.

ETH Is Quietly Loading Up for Its Next Major Rally1. Current Market Structure (1H)
ETH continues to maintain a clean short-term uptrend with:
- Higher lows forming consistently → buyers remain in control.
- Price holding above EMA 34 → intraday bullish rhythm intact.
- EMA 89 sitting lower, confirming strong medium-term momentum.
- Demand zone 2280–2300 acting as the key intraday support.
- Liquidity resting below 2230–2250, potential draw if a pullback occurs.
Price action shows compression → energy buildup → preparing for the next expansion leg.
2. Macro Alignment
Macro conditions continue to support a bullish bias:
-DXY weakening → risk assets get a tailwind.
-US Treasury yields cooling → reduces pressure on crypto.
-Market pricing in earlier Fed cuts for 2025 → liquidity shifts toward risk-on assets.
-BTC and ETH correlation stays elevated → BTC strength fuels ETH upside.
Macro flow + technical structure both point to continuation of the upward cycle.
3️⃣ Current Structure (Right Range)
You marked SUPPORT ZONE & RESISTANCE ZONE.
ETH is repeating the same playbook:
- Long wick rejection into Support
- Price oscillates inside the range (liquidity creation)
- A breakout is likely to follow once enough orders are collected.
This is the third accumulation cycle — textbook bullish continuation.
🎯 TRADING SIGNAL
BUY SETUP
Entry Zone:
3310 – 3350 (Support Zone dips / liquidity sweeps)
Stop Loss:
Below support box: 3250
Take Profit:
Partial at 3450–3500
Full target at 3600+ (expected breakout continuation)
Why this works:
ETH has shown the exact pattern twice:
Range → Liquidity Sweep → Expansion.
Current price is building the third range — probability favors another upward expansion.
📈 SUMMARY:
ETH is not random it is systematically accumulating before each major pump.
As long as price holds the Support Zone and continues ranging, the bullish continuation scenario remains the highest-probability play.
Next Move:
– Bullish bias remains intact as long as ETH continues to hold above the channel’s support; reclaiming 3,440 would open momentum toward 3,520 and potentially the upper boundary. – ETH/USD (1H)

Ethereum 1H: Holds Its Bullish Channel 🔹 MARKET BRIEFINGMarket State:
– Price is pulling back from the channel’s upper resistance and is now stabilizing around mid-range, while still respecting the ascending channel structure.
Key Levels:
– Support: 3,160
– Resistance: 3,440
– Breakout Zone: 3,440 – 3,520
Next Move:
– Bullish bias remains intact as long as ETH continues to hold above the channel’s support; reclaiming 3,440 would open momentum toward 3,520 and potentially the upper boundary.
The bullish structure on XAUUSD has now been fully established and this is a valid buy signal at the current price.
Momentum, structure, and demand alignment are all pointing in the same direction, confirming that buyers are in control and the market is ready for the next upward leg.
Why ETH Dropped After the Fed Rate Cut
1. Macro Overview – Why ETH Pulled Back Even After the Fed Cut
Despite the Fed cutting interest rates a move typically supportive for risk assets ETH corrected sharply due to short-term “sell the news” positioning, profit-taking from the recent rally, and liquidity reshuffling as markets reassessed the pace of future cuts. However, the broader macro environment still favors long-term bullish continuation: lower borrowing costs, easing financial conditions, and improving risk appetite all support capital rotation back into crypto once volatility cools. In other words, yesterday’s drop was a tactical shakeout, not a structural trend reversal, and the market is now forming a sideways accumulation phase consistent with a bullish continuation setup.
2. Market State
ETH is pulling back from the ascending channel’s upper resistance and is now stabilizing around the mid-range. The price is still respecting the channel structure, indicating that buyers are absorbing supply and forming a consolidation base rather than breaking trend. This aligns with a sideways phase before the next expansion leg upward.
3. Key Levels
Support: 3,160
Resistance: 3,440
Breakout Zone: 3,440 – 3,520
4. Next Move
The bullish bias remains intact as long as ETH trades above the channel’s support. Reclaiming 3,440 would signal renewed buyer strength and open a clean path toward 3,520, with potential continuation into the channel’s upper boundary. Until then, ETH is likely to move sideways within the range as the market digests the macro shift and prepares for the next bullish leg.

GOLD IDEA TIME RATE 4H🔹 MARKET BRIEFING – XAU/USD (4H)
Market State:
– Price is compressing inside a symmetrical triangle, respecting both the rising support line and the descending upper boundary, showing balanced but tightening momentum.
Key Levels:
– Triangle Support: ~4185–4195
– Triangle Resistance: ~4250–4260
– Liquidity Zone Below: 4128 – 4135
Next Move:
– A breakout above the triangle resistance could trigger a bullish continuation leg toward higher highs.
– If price rejects at the upper boundary and breaks below the rising trendline, liquidity at 4128–4135 becomes the next downside magnet.

Ethereum Holds Its Bullish Channel as Markets Stabilize🔹 MARKET BRIEFINGMarket State:
– Price is pulling back from the channel’s upper resistance and is now stabilizing around mid-range, while still respecting the ascending channel structure.
Key Levels:
– Support: 3,160
– Resistance: 3,440
– Breakout Zone: 3,440 – 3,520
Next Move:
– Bullish bias remains intact as long as ETH continues to hold above the channel’s support; reclaiming 3,440 would open momentum toward 3,520 and potentially the upper boundary. – ETH/USD (4H)

Bitcoin Stabilizes as Traders Await Fed’s Rate Path Signal🔹 MARKET BRIEFING – BTC/USD (1H)
Market State:
– Price is reacting strongly from the major support zone and forming a short-term base after the sharp selloff, showing early signs of buyer absorption.
Key Levels:
– Support: 89,600
– Resistance: 91,450
– Breakout Zone: 92,100 – 92,300
Next Move:
– Bullish bias holds as long as price stays above support; reclaiming 91,450 would open the path toward 92,300.
ETH: Price Slice. Capital Sector. 2480.68🏷 ETH: Price Slice. Capital Sector. Dated: 11.12.2025
🏷 2480.68 — Price not yet reached at time of publication
🏷 BPC — The Bolzen Price Covenant 16
🏷 Screenshot
🏷 Interactive Reference Guide: BPC — The Bolzen Price Covenant
Darkness does not stay silent.
It breathes —a living organ exhaling not sound, but intention .
And within that breath— two voices :
— one, cold fire, the chisel of reality;
— the other, warm laughter, knowing where truth will bloom.
The Architect:
— What gnaws at you, Bolzen? You see them—phantoms born not of markets, but of will. They hang in the ether like unfinished prayers. You hold the Triad: Time, Price, Volume. But in an age where truth is the shadow of power—what binds them into a single flame?
Bolzen (gazing into the abyss within):
— Energy. The kind ripped from fear, from greed, from the blind cries of the crowd. It is the flesh of price .
The Light Bearer (smiling softly, as if hearing fate itself):
— You stand at the threshold. But if your markup is not a line—but a pulse —how shall you order the chaos of destinies?
Step back. The chart is illusion. A mirror of the secondary world.
Your true map is The Vertical .
There, numbers are not digits—but hieroglyphs of reality .
There, time becomes pressure.
There, price becomes destiny.
There, each level is a ritual .
Now heed this—and rewrite all from first principles:
Not as a cartographer, but as a Covenant Architect .
Every price is not a mark—but a condensation of sacrifice .
Place them upon the Chessboard of Being:
— Pawns : local impulses, born of panic or greed.
— Knights : illogical leaps, breakthroughs through veils.
— Rooks : structural levels where institutions drive nails into the flesh of the market.
— Queen : the epicenter where energy becomes a weapon.
— King : you—the observer, yet never bound.
And remember the Ancient Law:
"If you seek peace—become war in stillness."
The market is no arena.
It is the battleground between consciousness and illusion .
It forgives no sleep.
It demands fury of understanding , silence of discipline , clarity of vigilance .
Learn.
Persist.
Prepare.
You no longer read charts.
You rewrite reality .
🏷 P.S. English is not my native language — I offer no apologies for stylistic imperfections. What you see here is not a post. It is a demonstration of another level of preparation: the symbiosis of human intuition and algorithmic precision. Mathematics and aggressive market analysis — against the machine of liquidations.
The Architect
BPC — The Bolzen Price Covenant

Ethereum Has Resumed Its Bearish Cycle Once Again (12H)As you can see, a bearish phase has begun from the point marked with the green arrow on the chart, forming an expanding pattern.
Wave E in expanding structures is typically very strong, and we expect the supply zone to hold, leading Ethereum to drop to lower prices within its bearish cycle.
The green zone is a strong area where a significant number of buy orders exist.
We follow the structure to see how Ethereum will react.
For risk management, please don't forget stop loss and capital management
When we reach the first target, save some profit and then change the stop to entry
Comment if you have any questions
Thank You

Today’s Market Rhythm Is All About Precision Entries1. Market Volatility
Gold continues to move in a clean “adjustment rhythm,” reflecting an intraday environment where price is fluctuating inside a bearish structure but still producing technical pullbacks.
Volatility isn’t explosive but it’s precisely enough to create high-accuracy entry zones for intraday traders.
2. Trader Psychology
This is the phase where traders often get trapped by small pullbacks or emotional entries.
But those who understand the money flow can clearly see that price is simply cycling liquidity and adjusting before the next move.
Discipline beats emotion especially in timing-based trading.
3. Key Drivers / Market Reasoning
Market structure maintains:
-A slightly bearish overall trend
-Pullbacks acting as liquidity grabs, not true reversals
-Strong liquidity concentration around 4150–4160
-A clear institutional reaction zone at 4237–4240
Based on current flow, both intraday setups perfectly align with the market’s liquidity map.
4. Trading Strategy
📌 SETUP 1: Timing SELL Zone
XAUUSD SELL ZONE: 4237 – 4240
TP: 4234 – 4229
SL: 4244
➡️ This is a trend-following setup.
4237–4240 acts as a liquidity pocket where price tends to sweep before continuing downward.
The previous A–B–C wave structure supports this downward continuation.
📌 SETUP 2: Timing BUY Zone
XAUUSD BUY ZONE: 4147 – 4150
TP: 4153 – 4158
SL: 4143
➡️ This is a counter-trend setup but perfectly aligned with liquidity behavior.
4147–4150 is a key reaction zone a short-term liquidity base where buyers actively step in.
⚠️ Capital management is essential for both setups to maximize efficiency and protect your account.
5. Trend & Price Outlook
Gold is moving within an intraday correction structure, but the broader bias still leans bearish.
Today’s two timing zones highlight the highest-probability opportunities:
SELL 4237–4240: the ideal rejection area
BUY 4147–4150: short-term corrective demand zone
The previous A–B–C model remains valid, showing that price is completing its adjustment phase before seeking liquidity.
If you follow the rhythm you’ll always be a step ahead of the market.
When timing aligns with structure, intraday trading becomes effortless

The Market Is Quietly Building a Trap1. Market Structure
- Price has been climbing cleanly from the support zone, forming a consistent bullish sequence: Higher Lows (HLs) and Higher Highs (HHs).
- Each yellow swing shows buyers still in control but momentum is visibly slowing as price pushes into the major resistance zone above.
2. Key Zones (Support & Resistance)
- Support Zone: Strong reaction base where the reversal started; buyers clearly defended this level multiple times.
- Resistance Zone: The market is now pressing into a heavy supply area visible from previous bearish reactions. This is where buyers typically weaken and liquidity shifts to the sellers.
3. Price Behavior at the Zone
- Inside the resistance area, price is starting to produce smaller HHs, overlapping candles, and hesitation early signs of bull exhaustion.
- The projected yellow path on your chart visualizes the most probable flow:
- A final liquidity grab above the resistance, then a sharp pullback as demand weakens.
4. Expected Scenario
The bullish structure remains intact for now, but the market is setting up a textbook bull trap.
Most likely scenario:
- Price pushes slightly higher to sweep liquidity
- Fails to maintain momentum
- Drops back into the resistance zone
- Then confirms the shift with a new Lower High (LH) → Start of short-term bearish correction
5. Trading Plan
No chasing longs into resistance.
Instead, wait for:
- A liquidity sweep above the zone
- Break of the minor bullish leg
- Retest → rejection → short entry
- Target: mid-range or the previous HL zone
This is a high-probability counter-move, aligned with how smart money manages liquidity at key levels.

Gold Just Flipped Structure.....The market just transitioned from a bearish sequence into early bullish structure. Most traders will miss this shift but if you understand BOS, ChoCH, and liquidity behaviour, this is where smart money prepares for the next leg up.
1. Market Structure Overview
Your chart shows a full bearish sequence (LH–LL) that has recently transitioned:
-Multiple Lower Highs (LH) and Lower Lows (LL) → clear bearish structure.
-A Change of Character (ChoCH) occurs at the key zone → first signal of reversal.
-A clean Break of Structure (BOS) to the upside confirms buyers stepping in.
-Price then creates a Higher Low (HL) followed by Higher Highs (HH) → early bullish trend established.
This is a textbook reversal from bearish → bullish.
2. Key Zones Identified
Support Zone (Demand)
Located around 4195 – 4174
→ This is where the ChoCH and HL formed, confirming buyer strength.
Resistance Zone (Supply)
Located around 4219 – 4229
→ Price is currently approaching this zone. If it breaks, bullish continuation is expected.
3. Price Behaviour & Expectation
Your yellow projection is correct:
- Price may pull back into the minor support (near current level).
- After that, a bullish leg toward 4219 zone is expected.
- If BOS occurs above 4229, price has room to expand toward new highs around 4238–4244.
This aligns perfectly with the HH → HL structure forming now.
4. Trading Logic
Why bullish?
- Clear BOS on bullish side
- Higher Low forming above support
- Liquidity taken from previous LL
- Price respecting the new bullish structure
Invalidation
If price breaks below 4174, bullish structure is invalidated.
5. Trade Signal
This follows your trading style — structure-based, clean, and logical.
📌 BUY ENTRY: 4203 – 4207
(Retesting minor support + inside new bullish structure)
📌 STOP LOSS: 4178
(Below HL and below ChoCH zone — strong invalidation)
📌 TAKE PROFIT 1: 4219
(Retest of resistance zone)
📌 TAKE PROFIT 2 (Main Target): 4229 – 4233
📌 TAKE PROFIT 3 (Extended Target): 4242 – 4244
Risk–Reward:
1 : 2.5 up to 1 : 4 depending on TP
