#ETH/USDT – Short Setup from Key Supply Zone
#ETH
The price is moving in a descending channel on the 1-hour timeframe. It has reached the upper limit and is heading towards breaking it. A retest of the upper limit is expected.
We have an upward trend on the RSI indicator, which has reached near the upper limit. A downward reversal is expected.
There is a key support zone in green at 3253. The price has bounced from this zone multiple times and is expected to bounce again.
We have a trend of consolidation above the 100-period moving average, as we are moving close to it. This supports a downward move towards touching this level.
Entry price: 3218
First target: 3186
Second target: 3164
Third target: 3132
Stop loss: Above the support zone in green.
Don't forget a simple thing: capital management.
For inquiries, please leave a comment.
Thank you.
Ethbtclong

#ETH/USDT : Rebound Setup from ascending channel Support#ETH
The price is moving in a descending channel on the 1-hour timeframe. It has reached the lower boundary and is heading towards a breakout, with a retest of the upper boundary expected.
We are seeing a bearish trend in the Relative Strength Index (RSI), which has reached near the lower boundary, and an upward bounce is expected.
There is a key support zone in green at 3020, and the price has bounced from this level several times. Another bounce is expected.
We are seeing a trend towards stabilizing above the 100-period moving average, which we are approaching, supporting the upward trend.
Entry Price: 3100
First Target: 3200
Second Target: 3295
Third Target: 3395
Remember a simple principle: Money Management.
Place your stop-loss order below the green support zone.
For any questions, please leave a comment.
Thank you.

#ETH/USDT (1h) (spot)#ETH
The price is moving in a descending channel on the 1-hour timeframe. It has reached the lower boundary and is heading towards a breakout, with a retest of the upper boundary expected.
We are seeing a bearish trend in the Relative Strength Index (RSI), which has reached near the lower boundary, and an upward bounce is expected.
There is a key support zone in green at 2970, and the price has bounced from this level several times. Another bounce is expected.
We are seeing a trend towards stabilizing above the 100-period moving average, which we are approaching, supporting the upward trend.
Entry Price: 30019
First Target: 3058
Second Target: 3124
Third Target: 3202
Remember a simple principle: Money Management.
Place your stop-loss order below the green support zone.
For any questions, please leave a comment.
Thank you.

Ehtereum/Btc chart and timing for altseasonPotential targets in theory by timing (May 2026) end of altseason and top in BITSTAMP:ETHBTC pair for Ethereum
I don't think we will reach level of May or Dec 2021
Targets more conservative without any idea of supercycle for altcoins
We retested and hold the line around Point of control by volume
Bearish scenario for support its again test of Weekly FVG
Bullish uptrend to Order Block/Buy side liquidity and main order block!

Ethereum — Swing Low Locked In - 60% ahead!
ETH has established its swing low, and now it’s all about watching for the next impulse.
Against BTC, the chart is clean. ETH is actively reclaiming the pivotal zone, and as long as it holds above 0.03, this setup screams continuation.
Nothing overly complex here — structure is intact, momentum is stabilizing, and the path of least resistance is up.

#ETH/USDT : Rebound Setup from ascending channel Support#ETH
The price is moving within an ascending channel on the 1-hour timeframe and is adhering to it well. It is poised to break out strongly and retest the channel.
We have a downtrend line on the RSI indicator that is about to break and retest, which supports the upward move.
There is a key support zone in green at the 2930 price level, representing a strong support point.
We have a trend to stabilize above the 100-period moving average.
Entry price: 3064
First target: 3100
Second target: 3168
Third target: 3260
Don't forget a simple money management rule:
Place your stop-loss order below the green support zone.
Once you reach the first target, save some money and then change your stop-loss order to an entry order.
For any questions, please leave a comment.
Thank you.

ETHUSDT Weekly Chart – Full AnalysisETH is moving inside a long-term descending wedge/channel pattern, with the upper boundary acting as resistance and the lower as support.
Major Levels: Key horizontal levels include $2,502 (support) and $4,830 (major resistance). The wedge confines most price action since mid-2022.
Recent Action: ETH surged toward the wedge top near $4,830 but faced rejection, leading to the current pullback toward the wedge mid-zone and support. This retracement remains above trendline support and above the last key breakout region.
Bullish Path: If ETH rebounds from the wedge and horizontal support, a breakout above $3,600–$3,800 could re-test $4,830. On a breakout, long-term targets are $6,000+ based on the wedge height and prior cycle moves.
Bearish Risk: If the wedge support fails and ETH loses $2,500, further downside could be seen toward the $1,420–$1,030 area.
Cup & Handle/Accumulation: Multiple rounded bottoms and retests reflect long accumulation phases. A successful move above the wedge would complete this structure and suggest major upside.
ETH is consolidating within a large wedge structure, at support after a strong run and rejection near $4,830. Holding the $2,500–$2,800 zone is key for bullish continuation. A confirmed breakout can trigger a fresh multi-month rally, while a breakdown signals deeper retracement.
DYOR | NFA

#ETH/USDT Ethereum at a Crossroads: Accumulation vs. Profit-Tak#ETH
The price is moving within an ascending channel on the 1-hour timeframe and is adhering to it well. It is poised to break out strongly and retest the channel.
We have a downtrend line on the RSI indicator that is about to break and retest, which supports the upward move.
There is a key support zone in green at the 3663 price, representing a strong support point.
We have a trend of consolidation above the 100-period moving average.
Entry price: 3720
First target: 3750.45
Second target: 3815.15
Third target: 3885.60
Don't forget a simple money management rule:
Place your stop-loss order below the green support zone.
Once the first target is reached, save some money and then change your stop-loss order to an entry order.
For any questions, please leave a comment.
Thank you.

#ETH/USDT Buy Opportunity#ETH
The price is moving within an ascending channel on the 1-hour timeframe and is adhering to it well. It is poised to break out strongly and retest the channel.
We have a downtrend line on the RSI indicator that is about to break and retest, which supports the upward move.
There is a key support zone in green at the 3900 price level, representing a strong support point.
We have a trend to stabilize above the 100-period moving average.
Entry price: 4020
First target: 4050
Second target: 4100
Third target: 4179
Don't forget a simple point: capital management.
Upon reaching the first target, save some money and then change your stop-loss order to an entry order.
For any questions, please leave a comment.
Thank you.

#ETH/USDT : Another Attempt To Resume Upward Movement#ETH
The price is moving within a descending channel on the 1-hour frame, adhering well to it, and is heading for a strong breakout and retest.
We have a bearish trend on the RSI indicator that is about to be broken and retested, which supports the upward breakout.
There is a major support area in green at 3826, which represents a strong support point.
We are heading for consolidation above the 100 moving average.
Entry price: 3874.
First target: 3920.
Second target: 3969.
Third target: 4200.
Don't forget a simple matter: capital management.
When you reach the first target, save some money and then change your stop-loss order to an entry order.
For inquiries, please leave a comment.
Thank you.

#ETH/USDT the Final Push Before the Parabolic Run!#ETH
The price is moving within a descending channel on the 1-hour frame, adhering well to it, and is heading for a strong breakout and retest.
We have a bearish trend on the RSI indicator that is about to be broken and retested, which supports the upward move.
There is a major support area in green at 3900, which represents a strong support point.
We are heading for consolidation above the 100 moving average.
Entry price: 4156
First target: 4274
Second target: 4405
Third target: 4583
Don't forget a simple matter: capital management.
When you reach the first target, save some money and then change your stop-loss order to an entry order.
For inquiries, please leave a comment.
Thank you.

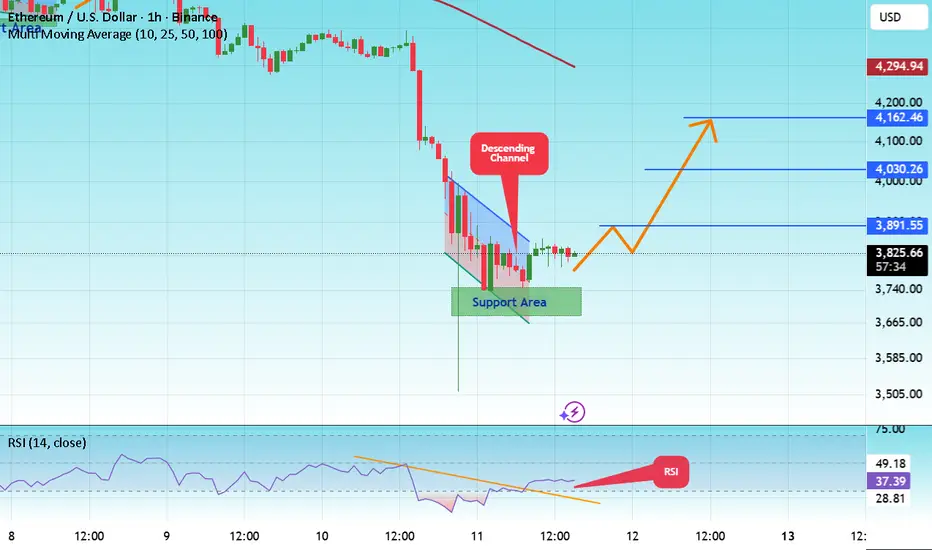
#ETH/USDT forms bullish patterns#ETH
The price is moving in a descending channel on the 1-hour frame and is expected to break and continue upward.
We have a trend to stabilize above the 100 moving average once again.
We have a downtrend on the RSI indicator that supports the upward move with a breakout.
We have a major support area in green that pushed the price higher at 3700.
Entry price: 3817.
First target: 3890.
Second target: 4030.
Third target: 4162.
To manage risk, don't forget stop loss and capital management.
When you reach the first target, save some profits and then change your stop order to an entry order.
For inquiries, please comment.
Thank you.
#ETH/USDT looking extremely bullish#ETH
The price is moving within a descending channel on the 1-hour frame, adhering well to it, and is heading for a strong breakout and retest.
We have a bearish trend on the RSI indicator that is about to be broken and retested, which supports the upward move.
There is a major support area in green at 4400, which represents a strong support point.
We are heading for consolidation above the 100 moving average.
Entry price: 4455
First target: 4512
Second target: 4573
Third target: 4650
Don't forget a simple matter: capital management.
When you reach the first target, save some money and then change your stop-loss order to an entry order.
For inquiries, please leave a comment.
Thank you.

#ETH/USDT : Bounce From Support, Eyes on $ 4128#ETH
The price is moving within a descending channel on the 1-hour frame, adhering well to it, and is heading for a strong breakout and retest.
We have a bearish trend on the RSI indicator that is about to be broken and retested, which supports the upward breakout.
There is a major support area in green at 3950, which represents a strong support point.
We are heading for consolidation above the 100 moving average.
Entry price: 4012.
First target: 4050.
Second target: 4084.
Third target: 4128.
Don't forget a simple matter: capital management.
When you reach the first target, save some money and then change your stop-loss order to an entry order.
For inquiries, please leave a comment.
Thank you.

#ETH/USDT Testing Wedge Breakout Amid Key Support#ETH
The price is moving within a descending channel on the 1-hour frame, adhering well to it, and is heading for a strong breakout and retest.
We have a bearish trend on the RSI indicator that is about to be broken and retested, which supports the upward move.
There is a major support area in green at 4480, which represents a strong support point.
For inquiries, please leave a comment.
We are in a consolidation trend above the 100 Moving Average.
Entry price: 4524
First target: 4585
Second target: 4645
Third target: 4715
Don't forget a simple matter: capital management.
When you reach the first target, save some money and then change your stop-loss order to an entry order.
For inquiries, please leave a comment.
Thank you.

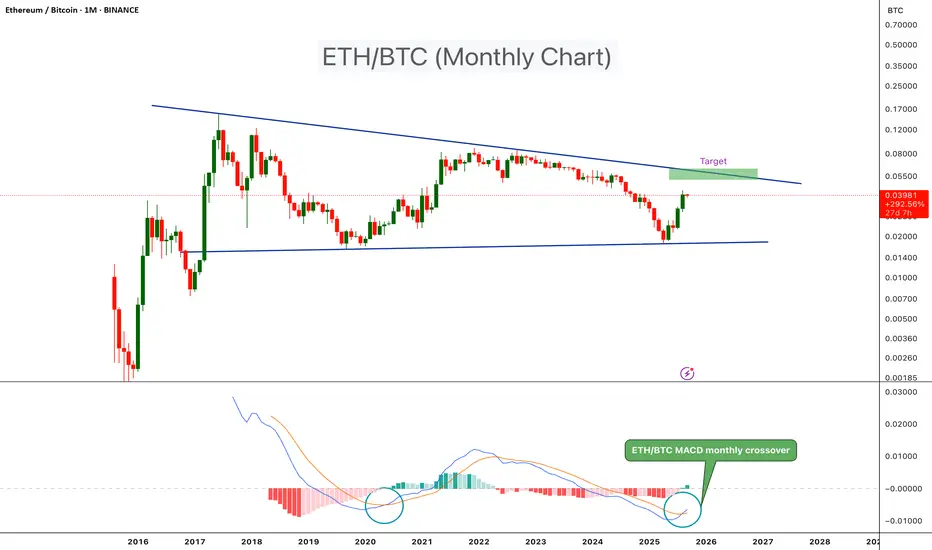
Ethereum Showing Strength Against BitcoinETH/BTC pair is trading within a long-term triangle pattern. A few months ago, price bottomed out at the triangle support and has since bounced, with the pair now trading around the 0.039 level.
On the monthly timeframe, a bullish MACD crossover has just appeared. This is a strong signal that ETH could start outperforming BTC in the near term. The last time a similar crossover occurred was in June 2020, which was followed by a powerful rally in ETH.
Looking ahead, the next major resistance for ETH/BTC is near the 0.060 level. If bullish momentum continues, price could test this zone in the coming months. This resistance area may also act as the potential peak for ETH in this bull run cycle.
Will Ethereum and Altcoins Continue to Grow?Hello friends
You see the Bitcoin to Ethereum chart.
You may be wondering what caused Ethereum to grow. I should tell you that this chart shows us what happened.
The price is in a downtrend, which indicates a money movement (from Bitcoin to Ethereum).
When you see that after 3 hits to support, the price has managed to break the support and the price has fallen and formed a downward channel, which could indicate that Ethereum's growth is continuing.
So now we have identified the support areas for you using Fibonacci, based on the price range that has formed.
The price is now at an important support area, as you can see, we had a bullish reaction when we hit the support area, but the price reversed due to the strength of the downtrend...
Now, if the support area breaks, the price can move lower to the specified targets.
Keep in mind that if the price grows, the upper support areas that were broken now become resistance and the price must be able to break them for our trend to be bullish, but as long as the price is down, the upward trend of Ethereum will continue and the upward trend of Ethereum will also make the altcoins bullish...
*Trade safely with us*

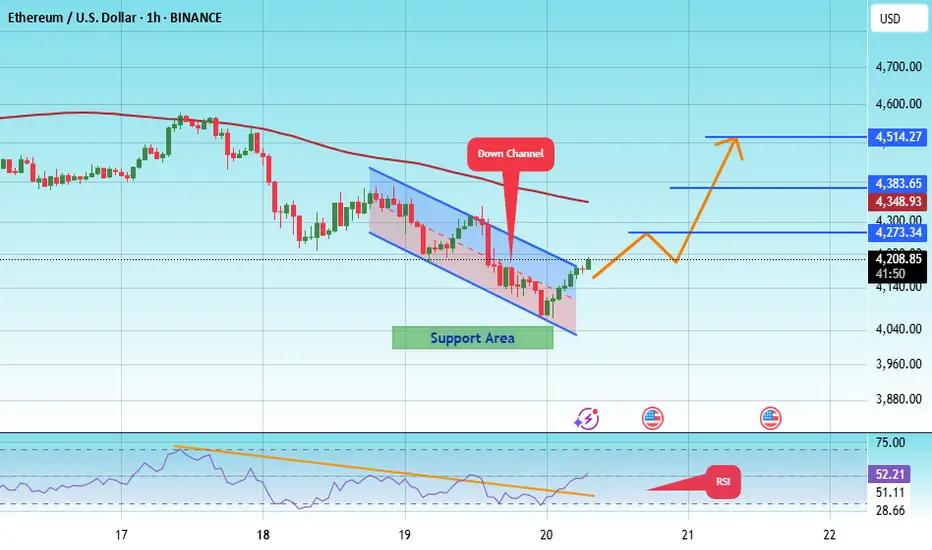
#ETH/USDT Breaks Below Recent Triangle Structure !#ETH
The price is moving within an ascending channel on the 1-hour frame, adhering well to it, and is on track to break it strongly upwards and retest it.
We have support from the lower boundary of the ascending channel, at 4040.
We have a downtrend on the RSI indicator that is about to break and retest, supporting the upside.
There is a major support area in green at 4000, which represents a strong basis for the upside.
Don't forget a simple thing: ease and capital.
When you reach the first target, save some money and then change your stop-loss order to an entry order.
For inquiries, please leave a comment.
We have a trend to hold above the 100 Moving Average.
Entry price: 4203.
First target: 4273.
Second target: 4383.
Third target: 4514.
Don't forget a simple thing: ease and capital.
When you reach the first target, save some money and then change your stop-loss order to an entry order.
For inquiries, please leave a comment.
Thank you.
ETHBTC Opportunity Buy: Major 2025 AltcoinSeason & Bull MarketThis is the big one and the good one. ETHBTC was bearish since December 2021 but this cycle finally came to an end in April this year. After the initial bullish breakout and higher low we can clearly see some bullish action developing; three consecutive weeks green. The bullish bias is now confirmed. It is still early.
We are looking at 200% potential. The "back to baseline" target. This is a price range where ETHBTC traded sideways as part of a distribution phase for more than two years. This is a must-to-be-tested resistance zone and thus opens up a sure 200% profits potential for this newly developing bullish wave.
Ethereum's ETFs are coming, Bitcoin already has its ETFs. This can mean Ethereum outperforming Bitcoin, and many altcoins, in so many ways. This also opens up the potential for a new all-time high on this pair.
The same sequence of 'low-higher low' happened in the last bull market. ETHBTC hit bottom in September 2019 then produced a higher low and this signaled the start of a major, long-term 447% rise. The conditions are similar now but the rise will be faster.
We have two main targets for the all-time high in late 2025 or early 2026.
1) 0.13207. With 442% profits potential from current price.
2) 0.20278. With 733% profits potential.
The entire bullish cycle for this pair can unravel within 4-6 months. If it becomes extended, it can last one year or longer. Both scenarios are possible.
It is 100% certain that ETHBTC will go on a major bullish cycle together with the rest of the altcoins market. Bitcoin will also grow.
Thanks a lot for your continued support.
If you are bullish on Crypto, comment below.
Namaste.

#ETH/USDT Long after pull-back #ETH
The price is moving within a descending channel on the 1-hour frame and is expected to break and continue upward.
We have a trend to stabilize above the 100 moving average once again.
We have a downtrend on the RSI indicator that supports the upward move with a breakout.
We have a support area at the lower limit of the channel at 4465, acting as strong support from which the price can rebound.
We have a major support area in green that pushed the price upward at 4400.
Entry price: 4530.
First target: 4666.
Second target: 4797.
Third target: 4992.
To manage risk, don't forget stop loss and capital management.
When you reach the first target, save some profits and then change your stop order to an entry order.
For inquiries, please comment.
Thank you.

ETH/BTC Poised for a Breakout: A Technical and Fundamental ViewA confluence of technical signals on the weekly ETH/BTC chart, coupled with significant fundamental developments for both Ethereum and Bitcoin, suggests a potential upward move for the pairing in the coming weeks.
Technical Analysis (TA)
The weekly chart for ETH/BTC on Binance reveals a potential bottoming formation after a prolonged downtrend. The price has been consolidating in recent months, and the latest weekly candle shows a strong bullish engulfing pattern, indicating a possible shift in momentum.
Key levels to watch, as identified on the chart, are:
Immediate Resistance: 0.02546 BTC. A decisive close above this level on the weekly timeframe would be the first confirmation of a potential trend reversal.
Further Resistance: 0.02929 BTC and 0.03451 BTC. These represent subsequent hurdles for the bulls to overcome.
Take Profit Target: 0.038 BTC. This level is marked as the ultimate target for this potential upward move.
Timeframe: The analysis on the chart suggests a maximum timeframe of 5 weeks for this trade idea to play out.
Moving Averages: The price is currently trading below the MA Ribbon (SMA, 20, 50, 100, 200), which could act as dynamic resistance. A break above this ribbon would further strengthen the bullish case.
Fundamental Analysis (FA)
The current market environment in July 2025 provides several fundamental catalysts that could impact the ETH/BTC ratio.
For Ethereum (ETH):
Growing Institutional Interest: Ethereum ETFs have seen significant inflows, with over $890 million in July 2025 alone, driven by increasing confidence from institutional investors. Asset managers like BlackRock are accumulating substantial amounts of ETH, reducing the available supply on the market.
Network Upgrades: The upcoming "Pectra" upgrade, which includes Proto-Danksharding (EIP-4844), is anticipated in Q3 or early Q4 2025. This is expected to significantly reduce Layer-2 transaction costs and improve scalability, further enhancing the utility of the Ethereum network. The earlier Pectra upgrade in 2025 already introduced user-friendly features like smart accounts.
Ecosystem Growth: The Linea project, a prominent player in Ethereum's DeFi ecosystem, has a Token Generation Event (TGE) scheduled for July 2025, which is expected to drive market shifts. The overall DeFi ecosystem on Ethereum is showing signs of revitalization.
For Bitcoin (BTC):
Strong Institutional Demand: Similar to Ethereum, Bitcoin is experiencing a wave of institutional adoption, with significant inflows into spot Bitcoin ETFs. Public companies are now holding BTC in their treasuries, and major financial institutions view it as a strategic asset.
New All-Time Highs: Bitcoin has recently surged to new all-time highs, breaking key trendlines and signaling a new bullish era. This strong performance often has a spillover effect on the broader crypto market, including altcoins like Ethereum.
Favorable Macro Environment: Some analysts point to a looser monetary policy from global central banks and inflation concerns as factors boosting demand for hard assets like Bitcoin.
ETH vs. BTC Dynamics:
While Bitcoin's price has seen impressive gains, some analysts believe Ethereum has room to catch up. The ETH/BTC ratio is a key metric for gauging the relative strength of the two leading cryptocurrencies. An upward trend in the ETH/BTC chart, as suggested by the technical analysis, would indicate that Ethereum is outperforming Bitcoin. The performance of ETH relative to Bitcoin is often seen as a barometer for the broader altcoin market.
My point of view
The technical setup on the ETH/BTC weekly chart presents a compelling case for a potential bullish reversal in the short to medium term. This is supported by strong fundamental developments within the Ethereum ecosystem, including significant institutional inflows and major network upgrades. While Bitcoin's own bullish momentum is a factor to consider, the potential for Ethereum to outperform in the coming weeks, as indicated by the provided chart analysis, offers an interesting trading opportunity. Traders should closely monitor the identified resistance levels for confirmation of a breakout.

ETH/BTCPrice is following an AMD structure with a liquidity sweep to the downside. For full confirmation of the setup, a daily FVG inversion is required.
Watching closely — confirmation will unlock further directional bias.

ETH/USDT#ETH
The price is moving within a descending channel on the 1-hour frame and is expected to break and continue upward.
We have a trend to stabilize above the 100 moving average once again.
We have a downtrend on the RSI indicator that supports the upward break.
We have a support area at the lower limit of the channel at 2440, acting as strong support from which the price can rebound.
We have a major support area in green that pushed the price upward at 2440.
Entry price: 2500.
First target: 2545.
Second target: 2539.
Third target: 2641.
To manage risk, don't forget stop loss and capital management.
When you reach the first target, save some profits and then change your stop order to an entry order.
For inquiries, please comment.
Thank you.
