On the 9th Day of ETHmas...Continuation and a New H4 Demand ZoneOn the 9th Day of ETHmas, my true love gave to me....Continuation of what she has already given me...and a new H4 Demand Zone.
Please refer to my previous posts on ETH over this past month or so to see how the market has been playing out EXACTLY as it should. Once again, we have been ignoring the world of Trump News, Microstrategy plans, and every other noisy gong of crypto crashes, tarrifs, etc. We have been focusing on SOLID Technical market structure that I follow and teach. ETH has been following this solid structure and we've endeavored to give you a preview of what to expect, and then followed up with how it actually played out.
So what happed in the last few days?:
At our last post, ETH was making its pullback to the last H4 Demand Zone. What seemed like another bloody murder episode to many was simply a pullback to gain stronger support for this move up. We had the expected pullback, along with a few strong wicks below this last H4 Demand Zone to take out over leveraged traders. But, when the dust settled, the H4 candle closed above this zone and never showed that we were going bearish again.
So...where are we now?:
Today, after a few days of consolidating around this H4 Demand Zone, we saw the break out above it and the continuation with the bullish move that started all of this (When we had the first H4 BOS UP on November 28, and the return to the H4 BOS Source on Dec 1). That was the Ultimate Buy Setup on ETH, and projected to take us up to the H4 Supply Source of ~ 3450-3560. So, today, we broke out and continued and are now heading to this zone.
What to look for?:
As we make our way up, there is still the older Daily Supply Zone (the one that caused the first pull back to the H4 Demand Zone). The top of that zone is ~ 3230. We have broken through that zone, but the top may still need to be retested before we keep pushing on.
Also, there is a big Daily Supply Source sitting at (3355 - 3520). This overlaps our target area, so we need to watch the 15 min chart closely as we approach this area. Look for any BOS Down structure that would signal that this pullback is coming. Otherwise, we are on the way to 3450 - 3560, just as the plan has been since November 28.
Happy Trading, and please leave me your comments. I would LOVE to hear what you all are thinking, hear any challenges or push backs on my analyses, or to just see if you have been following along.
Ethbuy

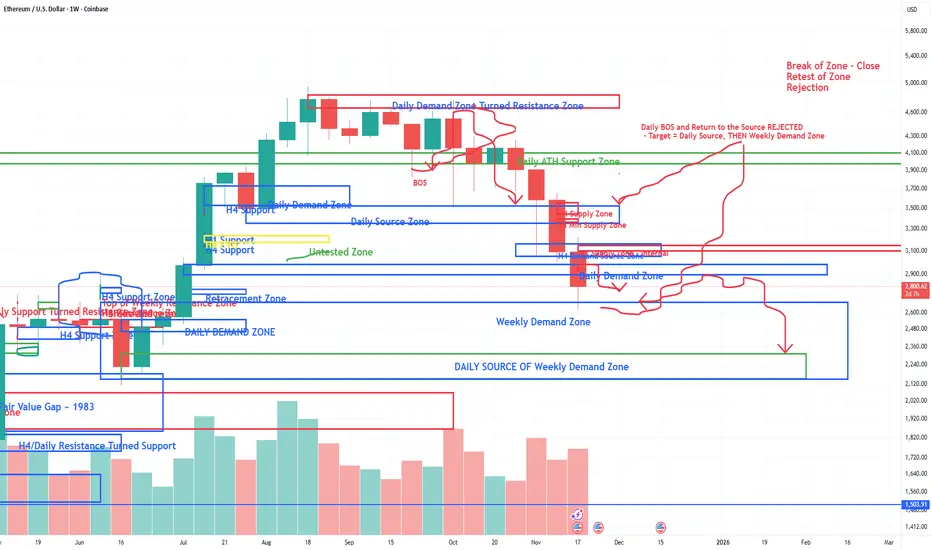
Is the ETH Problem Solved Yet????ETH has traded exactly as expected from this last recent high and break down of structure that followed. Please see my last analysis on ETH from 11/11/25. We have dropped down into this Weekly Demand Zone (2150 - 2680), and are now seeing a bullish response out of it as expected. This response is most likely to pull back up to retest the previous Daily Demand Zone (2900 - 2980) and get Rejected.
The most likely targe of this fall is still to continue to the Daily Source inside of this weekly zone. The problem is that this Weekly Demand Zone was very large, leaving a wide range of buyers in this area. The most concentrated demand will be inside of the Daily Source (2150 - 2314).
This is just the market being the market and following a solid technical analysis structure.
What to look for Next?:
Keep in mind that the overall market is STILL BULLISH. This so called "collapse of the market, flash crash, crypto winter", etc. is only because we extended way too far from the last Weekly Demand Zone. The price of ETH and BTC pushed too far, too fast, and we are only returning to normal market structure. There HAS to be this kind of correction in the market in order to move forward.
So, to resume the bullish case for ETH right now, all we need to see a clear Break of Structure out of this large Weekly Demand Zone on the H4 Time frame. The H4 will be the tell tell sign that the decline is ending. That is most likely to happen within the Daily Source Zone highlighted (2150 - 2314). We need to see a clear H4 Break of the last supply zone and a retest to get out of this 2700 price range area and continue with the overall still bullish trend.
Don't be fooled by these bullish responses right now - we are not ready to go bullish again until we see what I described above. Every other bullish pump right now is a trap, and should be traded accordingly.
$ETH accumulating around $3K?CRYPTOCAP:ETH accumulating around $3K? Spot on it’s coiling at ~$3,100 (up 3.44% short-term, per latest feeds), building steam after the recent dip.
Next resistance retest at $3,400 makes sense: that’s the broken support-turned-resistance from early Nov, aligning with the 50-day MA and Fib 0.5 extension. Break it, and we’re eyeing $3,850–$3,900 by month-end (Fusaka upgrade hype + ETF inflows fueling the push).
Whale zones at $2,800–$2,400? Bullish af—matches on-chain data where big players scooped $1.37B during the $3,331 breakdown (June highs echoed in Nov buys like Tom Lee’s $63.6M stack today).
Wintermute’s loading millions amid the dump, signaling reversal vibes (last time = massive pump). If $2,800 holds (key Fib 0.618 + demand zone), that’s your dip-buy floor before $4K+.
Mildly bullish here (70/30 odds on upside) RSI resetting from oversold, HAR dipping but whales countering retail sells. Load on #SorooshX signals if it tests $2,800.
Your play? 😎
#ETH #Crypto

ETH - Potential Bullish Reversal towards PDHETHUSD – Potential Bullish Reversal Scenario 🐂
We’ve observed a strong bullish reaction following a sweep of the previous day’s low (PDL) within our identified Point of Interest (POI), aligned with a 1-hour Bullish Imbalance (BISI).
This reaction suggests a possible shift in market structure, and we are now anticipating a reversal to the upside, potentially targeting resting sell-side liquidity. There is also a chance we may see a Symmetrical Movement Theory (SMT) divergence forming relative to BTC, which could further validate bullish intent.
From my perspective, the liquidity engineered below the recent sweep presents a strategic area where institutional participants may look to accumulate long positions for a more sustained move upward.
We also have favorable draw on liquidity (DOL) to the buy side, including the previous day’s high (PDH) and visible engineered liquidity levels above.
Let’s now monitor price action following this bullish reaction to assess whether confirmation for a higher move develops.

LONG ON ETHEREUMEthereum is coming from a major demand area after sweeping liquidity.
I am taking a buy limit order on ETH looking to catch price rising to the previous highs. Over 500-600 points.

ETH - LONGEthereum has dropped more than 40%, it was hacked, people sold, and it's also a bit lower than before the election results. The Fear & Greed Index is at 10, something that hasn't happened since 2022. It's time to give it a chance. I think it's a good buying opportunity. There is support at 2000 and then around 1700. So it could keep falling, but I think it's a good time to start preparing anyway.

LONG ON ETHEREUM (ETH/USD)Ethereum is currently at a major level of support.
The last time Ethereum was at this price was Nov of 2024 and ended up rising over 1600 points within a month.
I expect Ethereum to do the same thing!
I will be buying eth to the next level of supply/resistance.

ETH/USD Bullish Setup: $6,000 TargetA bullish inverse head and shoulders pattern is forming on ETH/USD. ETH appears to be approaching the completion of the right shoulder, which lies in the $2,800–$2,900 region. A solid buy position can be considered in this area. Continue buying the dips! The projected target for this pattern is around $6,000.

$ETH-Long IdeaEthereum broke through the swing high. Expecting a follow through in the price. Will be looking to take longs/buy at the marked bullish zones. A break below the swing low would invalidate the trade.

ETHUSD LONG IDEA to 3577.41ETHUSD LONG IDEA
IF daily close is above 2981.33 i can see further upside to:
3577.41
i have entered as of from 2981.33but to be safer id enter again at that mark if daily close is above it.
ENTRY: 2981.33
TAKE PROFIT: 3577.41
stop loss: 2722.16
again where i have entered is failry risky.
but the target is: 3577.41

ETH → Mad Dash to $2,500? Or Rejected to $1,800? Let's Answer.Ethereum is at a crucial moment in its journey to break the $2,100 resistance area. We're currently in an ascending triangle, a bullish pattern, knocking on the resistance zone door. Will it break through?
How do we trade this?
If you are not in a trade right now, do not enter one. We should not be longing resistance nor should we be shorting without a sell signal and confirmation. Wait for a break of resistance followed by a test of resistance as support to long. To short, we need a clear sell signal bar and confirmation candle closing on or near its low.
Until then, let's see where the price action goes. FOMO (Fear of Missing Out) is your worst enemy. You're making more money by not falling for the seduction of market profit.
Trade Idea
Long Entry : $2,250
Stop Loss: $2,127.50
Take Profit: $2,495
Risk/Reward Ratio: 1:2
Key Takeaways
1. Ascending Triangle, Bullish Signal!
2. Strong Support on Daily 30EMA.
3. At Resistance Zone, Do Not Long Here!
4. RSI above Moving Average and around 60.00. Bias to Long.
5. Use caution, watch for a reversal signal!
You are solely responsible for your trades, trade at your own risk!
If you found this analysis helpful, click the Boost button and let us know what you think in the comment section below!

ETH - BullishAccording to the market behaviour, ETH has been rising sharply on the one hour, five hours, daily, weekly, and monthly charts. Technical analysis indicates that the next target will $2280, and if it crosses that level and closes above successfully, the next target for the market will be $2500.
Italian Translation:
Secondo il comportamento del mercato, ETH è in forte aumento sui grafici di un’ora, cinque ore, giornalieri, settimanali e mensili. L’analisi tecnica indica che il prossimo obiettivo sarà 2.280 dollari e, se supera tale livello e chiude con successo al di sopra, il prossimo obiettivo per il mercato sarà 2.500 dollari.
Germany Translation:
Dem Marktverhalten zufolge ist ETH auf den Ein-Stunden-, Fünf-Stunden-, Tages-, Wochen- und Monats-Charts stark gestiegen. Die technische Analyse deutet darauf hin, dass das nächste Ziel bei 2.280 US-Dollar liegt, und wenn es dieses Niveau überschreitet und erfolgreich darüber schließt, wird das nächste Ziel für den Markt bei 2.500 US-Dollar liegen.

ETHUSDT - Broadening Wedge PatternETHUSDT (1D Chart) Technical analysis
ETHUSDT (1D Chart) Currently trading at $1785
Buy level: Above $1800
Stop loss: Below $1550
TP1: $2000
TP2: $2175
TP3: $2450
TP4: $2600
Max Leverage 2x
Always keep Stop loss
Follow Our Tradingview Account for More Technical Analysis Updates, | Like, Share and Comment Your thoughts

ETHUSD is in bullish regionETH making HH and HL following Dow Theory and as from its previous behaviour, we can predict its HH.
Buy 1660
TP 1710
SL 1640


ETHEREUM PUMPETH and Crypto have been gaining bullish momentum on the H4 I only think its right we ride the wave before it resumes the bearish trend on HTF

ETHBTC Prices May Float to 0.076 BTCPast Performance of #ETHBTC
There was an ETH price expansion early this week, but bulls were muted on May 3 and 4. However, BTC is trailing the BTC following encouraging surges on May 1 and 2. ETH bulls would likely build on the bullish engulfing bar of early this leg, setting the foundation for an expansion above April highs of around 0.076 BTC.
ETHBTC Technical Analysis
As per the ETHBTC technical analysis in the daily chart, ETH buyers are in the driving seat. Prices recovered from the 38.2 percent Fibonacci retracement level of the April 2022 trade range. The recovery, backed by rising trading volumes on May 1, triggered demand. There is a possibility of ETH bulls finding support in the immediate term. However, this is subject to ETH bulls rejecting any attempt for losses below 0.072 BTC. As it is, traders can load on every dip, targeting 0.076 BTC. A break below this week's low, on the other hand, may see ETHBTC crater to 0.070 BTC, the 61.8 percent Fibonacci retracement level of the same trade range.
What to Expect from ETHBTC?
ETH buyers have the upper hand at spot rates. Still, if there is a crypto correction, Bitcoin bulls may flow back, driving prices below the primary support at 0.072 BTC.
Resistance level to watch out for: 0.076 BTC
Support level to watch out for: 0.072 BTC
Disclaimer: Opinions expressed are not investment advice. Do your research.


long in ethusdtwe can have long at PRZ level .it can fail
...................................................
..................................................

Eth Buy zoonsEverything drawed on the chart. No need for more texting here
But remember to check my BTC analyses first

5 Oct: ETHUSD to see further downsidePrices are testing a key resistance level on the daily and H4 time frame in line with the 78.6% retracement, we could see a further downside to our support level at 3156 in line with the H1 support area.

ETH USDT : Buy Trade setup @ 2582Hey Guys, hope you are doing well.
Welcome to today's trade setup as a part of the "Aglogains - Daily Trade series".
I have an entry after a double bottom was formed, followed by a bullish candle, fulfilling our entry criteria.
Entry - 2582
SL - 2513 (97 points)
TP - 2678 (69 points)
Risk to Reward - 1 : 1.4
Will keep you posted on the progress.

ETH USDT : Buy Trade setup @ 2597Hey Guys, hope you are doing well.
Welcome to today's potential trade setup as a part of the "Aglogains - Daily Trade series".
This is a short-term scalping trade. In the 15 minute time frame.
We have seen a pullback to the previous short term resistance level of 2590 - 2600 levels from the recent highs of 2630 -2640
I have an entry after a double bottom was formed, followed by a bullish candle, fulfilling our entry criteria.
Entry - 2597
SL - 2560 (37 points)
TP - 2649 (52 points)
Risk to Reward - 1 : 1.4
Will keep you posted on the progress.
