On the 10th Day of ETHmas...An Early Christmas Present - FULL TP
On the 10th day of ETHmas, My True Love gave to me....a Big Push Up to my TP!!!!
....and a new Daily Structure that could be a Game Changer!
Wow! This ETH play has been absolutely amazing! Today, we continued playing out just as expected and hit our full TP Target of the H4 Daily Source Zone. Please see our previous posts on ETH over the past month to see exactly how we have walked through a solid Technical and Structural Analysis of ETH, and how it played out perfectly!
So, what has happened:
The last day or so has seen what appeared to be a choppy back and forth of the market...responding to more completely irrelevant crypto news, Fed Rate Talks, Microstrategy Megabuys and more. All the while, the market has been simply playing out structure that was laid out a month ago. Today saw ETH push extremely hard ($200+ move), making many think that the Bull run was kicking off again. BTC saw a near identical move. Unfortunately, too many traders chased this pump, only to be slapped back down once it hit the H4 Supply Source that we have been targeting. It is a Supply Source, because that is where the market has already told us that it has been waiting to sell. Unfortunately, too many over zealous traders and investors had no clue and got caught in another big TRAP!
So, where are we now?:
As of this post time, again, we have hit our bullish target for now and got an early Christmas Gift. It was uncertain how long the market would take to push up here, but it did so quickly. At this point, the expected pullback has pushed ETH back down significantly. However, this is still NORMAL MARKET STRUCTURE and no need for alarm. A rejection of an H4 Supply Source is most likely to push the market back down to test a higher time frame support. In this case, it is the last Daily Demand Zone (2980 - 3200). This zone was just created yesterday, December 9th, so it's a new area. BUT, we have to expect the market to pull back to the latest Demand Zone to seek support for moving forward.
What to look for next?:
Now, that we have pushed down near this Daily Demand Zone, we need to go to the correlating H1 Time frame to look for signs that the fall is ending. This Demand Zone is stacked with buyers waiting to buy ETH, but where in this $220 range will they actually start doing it? The H1 will give us a strong indication. $2980- $3040 is the H1 Source within that bigger daily zone, so that is the most likely target.
So, look for an H1 BOS UP coming out of this Daily Demand Zone for the sign that the buyers are ready to step in. Once we see that, I'd expect one more pullback on the H1 (this pullback would need to stay within the Daily Zone) and then we can continue marching upwards.
What to look out for? The New Daily Structure!:
Now, if we get into this Daily Demand Zone and see an H4 close below it, that is a significant problem. Why? Because all the while we have been carrying out this H4 play....the Daily Time Frame has been making its own structure.
A. We got a Daily BOS UP on yesterday when we made a new recent high and created this big Daily Demand Zone. The BOS UP was a close above the previous Daily Supply Zone. SOOOO...we could actually be seeing the same market structure play out on the Daily that we have seen on the H4 this past month. With this Daily BOS UP, the market is likely to return to the Source of that Break...the BOS Demand Source (2610 - 2880). That would be an unwelcomed fall, but it is structure! The only thing preventing that is IF we hold this Daily Demand Zone. That's why I mentioned and H4 close below 2980 is trouble.
So, from here, we need to "Read" the market and play accordingly.
Hopefully, this analysis helps you all as traders or investors to see where we are going and why. Please drop me your comments, suggestions, and other feedback. Also, if you have a favorite pair that you would like me to analyze, I can take a look at it as well. We'd love to help you gain a solid market analysis strategy that can keep you profitable and out of danger in these markets!
Ethdaily

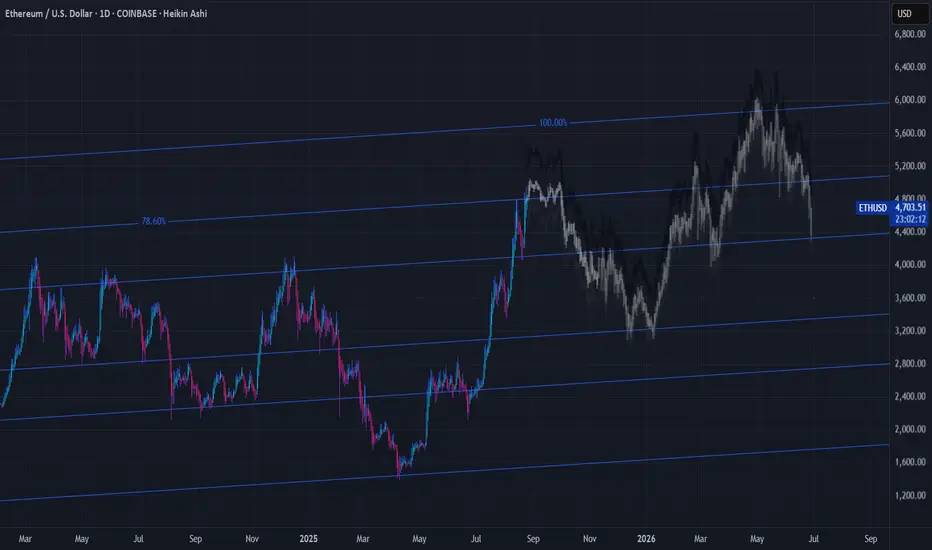
▒𖢻▒ ETHEREUM FORECAST | 1D ▒𖢻▒COINBASE:ETHUSD
My ETH Forecast on the Daily. Long-Term I believe ETH will see a 35% drop before a 100% gain.
The first part of this forecast is shown here.
This can always change, this is my initial forecast from watching price action for thousands of hours. The Fibonacci Sequence supports these fractal forecasts and as well as the trading patterns throughout the history of Ethereum.
I am a Bitcoin Maximalist so I am not trading ETH, however if I was I'd be taking large profits and/or trading out of all of my positions at this current level ($5,000 - $4,600) and reposition back in around these valley levels ($3,300 - $3,000).
DISCLAIMER
I AM NOT A FINACIAL ADVISOR, NOR AM I YOURS. THIS IS NOT FINANCIAL ADVICE. MEARLY DOODLINGS ON A MATHMATICALLY DRIVEN GRAPHICAL INTERFACE, TRACKING AN INVISIBLE 256BIT MILITARY-GRADE ENCRYPTED ASSET. . . FOR ENTERTAINMENT/AMUSEMENT PUROSES ONLY. ENJOY!
Daily review of ETH interval 4HHello everyone, let's take a look at the ETH to USDT chart over the 4 hour timeframe. As you can see, the price moves in the sideways channel and locally above the uptrend line.
Let's start with the designation of the support line and as you can see the first support in the near future is $ 1296, if the support breaks down, the next support is $ 1284 and $ 1275.
Now let's move to the resistance line as you can see the first resistance is $ 1,321, if you can break it the next resistance will be $ 1,339 and $ 1,357.
Looking at the CHOP indicator , we can see that in the 4-hour interval the energy is slowly increasing, and the MACD indicator indicates a local upward trend.


ETH DAILY UPDATE expecting a sharp spike for 7240 $ in the next month . it means alt coins will move too. main resistance is 4400 $ for confirmation of this movement. you can wait for the breakout or enter now.sl of position is the 3173 $ (low of shadow )
GOOD LUCK

ETH W FormationThis markup was something I just noticed forming on the Daily chart, I think we can expect a push down below the point I marked up. This will clear the orders people have set in place and give Big Money the position for the buy. After that I'm thinking there's going to be a big bullish push.

Dare to be wrong about ETH | DUMP EEETTTI hope that I'm wrong and we continue to moon town with Vitalik and Elon.
Daily looking bearish, could retest some of the lower fibs before breaking to the upside of the descending triangle.
Short on the way down, buy the dip and get a good entry on some almighty longs before we blast off to 10,000k usd.
At the end of the day, a retracement like this wouldn't be bearish. Hold tight.

ETHUSDT dailyHi guys, in the daily chart we saw the triangle was broken from the bottom side and the probability of falling in price increased.
On the other hand, the chart has diverged a lot and this was another sign of a change in the direction of the market.
But now the price hit the EMA 20 and was able to prevent further decline. However, in my opinion, according to the chart, the price is likely to fall to the range of ME 50 and even 100. Otherwise, the price will continue to test 2K in the blue channel.
