Ethereum Daily Chart Distribution Phase Signals huge dumpIf you’ve been tracking Ethereum on the daily chart, the structure is starting to look heavy — and not in a bullish way. Let’s break this down step by step so it’s easy to follow 👇
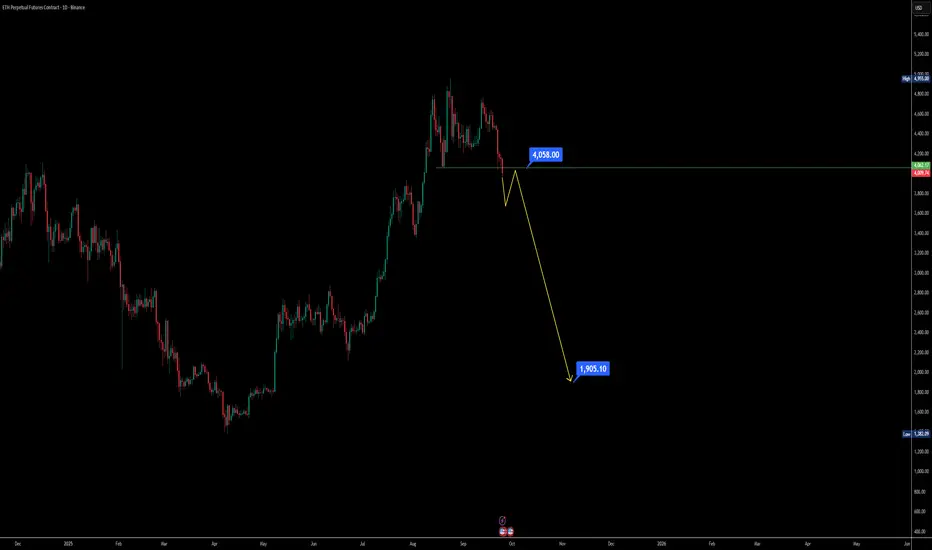
Support lost: ETH has already broken its key support zone around $4060, which previously acted as a higher low. Now, the recent dip is printing a new lower low, shifting market sentiment.
Daily close levels matter: If the daily candle closes below $4000, it confirms weakness and opens doors for a further sell-off.
Possible head and shoulders: A pullback toward the $4100 region could simply build the right shoulder of a bearish head and shoulder pattern. The structure matches what we saw earlier on the left shoulder.
Bearish momentum risk: If ETH fails to hold above $4000 after that pullback, we could be looking at extended downside — even a sharp fall toward the $2000 zone based on historical dump patterns.
Market behavior reminder: Over the past two years, whenever ETH started a distribution breakdown, the drop was often fast and violent. That’s why caution is key here.
📌 Key Takeaway: Ethereum is at a make-or-break daily level. Watch $4000 closely — losing this level could accelerate a bearish breakdown. Short-term traders may look for opportunities on the pullback, while long-term holders need to stay cautious of the possible head and shoulders pattern forming.
Ethereal
Ethereum repeating 2016/17 fractal? or WHAT THE WEF WANTSThe geometry is very similar, but not identical…
Having been there last time i'd say sentiment is similar…
Having successfully completed the merge, ethereum is now eco-friendly and consistent with the digital eco-agenda reset…
It is clear the days of fiat currency are numbered and the old financial system is being rebooted.
Inflation is rampant and the volatility in fx markets is picking up. America’s strong dollar policy will be challenged. Cryptocurrencies have not crashed despite a parabolic up move on the dollar. Retail traders are net long dollar and short risk assets. If we get a sharp down move in the dollar the above fractal can easily play out as the invincible dollar narrative is questioned.
Crypto assets have thus far not been a hedge for equities; but they may henceforth prove to be a hedge for fiat currencies…
Satoshi conceived bitcoin not as digital gold, but as peer to peer cash; and with the lightning network up and running- this is no longer a meme. Cryptos have gone sideways despite a parabolic blow off top on the dollar. If the dollar corrects hard now all bets are off- for stonks and cryptos…
It is my belief that ethereum will be the (a)ether for the new financial system…
So whilst the fractal on a log scale gives exponential targets..
I actually think these are reasonable…
LET'S SEE WHAT HAPPENS
GRI 2022
DISCLAIMER: This idea is for entertainment only


Ethereum: Watch for Price Action at 530$ SupportThe price bounced from the resistance zone and moved back to the previous swing low level. We have the support zone formed by SMA200 and 530$ and the price action at this zone will be able to give us additional signals.
If the price bounces from the support zone, we will have a bullish setup. I'm not sure that the price will move upward after that, but we can try to catch a possible upward movement using half of the standard position size. Stop orders for long trades must be placed below the support zone and the local swing low.
If the price breaks SMA200, it will be a trend reversal signal from the 4H timeframe. The price will be able to reach 500$ support and provide us new buying opportunities. I would like to start buying using this support.
The breakout below 500$ will open the road toward 400$, but it will be another story.
Disclaimer!
This post does not provide financial advice. It is for educational purposes only! You can use the information from the post to make your own trading plan for the market. But you must do your own research and use it as the priority. Trading is risky, and it is not suitable for everyone. Only you can be responsible for your trading.

Ethereum: False Breakout and New Long PositionThe previous long trade was closed by stop. It was based on the price reversal from the support zone. Those who think that in trading there must be only profitable trades, they should be disappointed by such price action. Those who understand that any profitable trading includes a lot of trades closed by stop order, they could open a new long position based on a false breakout.
Here is the possible long position which could be opened based on bullish signals from MACD, RSI, and the upside movement above the main uptrend line. How will the market develop the uptrend? Nobody knows exactly. But what we can say right now, the price can continue the upside movement in the borders of the price channel. We also got a new swing low, which will be the signal point in the future. If sellers can push the price below it, we will talk about the bearish market.
P.S. as I don't use like-bots and other solutions that show great "interest" to my posts, I will be grateful if you support my work by your LIKEs and comment. Of course, if you can do it. The feedback from REAL people is priceless!
Disclaimer!
This post does not provide financial advice. It is for educational purposes only! You can use the information from the post to make your own trading plan for the market. But you must do your own research and use it as the priority. Trading is risky, and it is not suitable for everyone. Only you can be responsible for your trading.
