ETH Long - Golden Pocket BITSTAMP:ETHUSD is very oversold and showing signs of a short squeeze building on the 4 hour chart. Almost all long liquidity was wiped around 2920 area ($1.3BB on hyper liquid) and there is currently a large cluster of short liquidations around $3120, so it should start to head that direction and cascade up from there until we reach the golden pocket.
There are plenty of macro headwinds, including NASDAQ:NVDA earnings after the bell today that could easily compromise this outlook in the short-term but I believe we will push higher from here. Even if we wick lower in the short-term, I believe that it's close enough to a bottom to enter here with a stop below LOD and some put options to hedge.
Ethereum (Cryptocurrency)

78K or 55K?Alright, big downward movement. Looks like it will test around 78k price. If it looses 75-80k then most likely it will drop to 54k. All the best !!

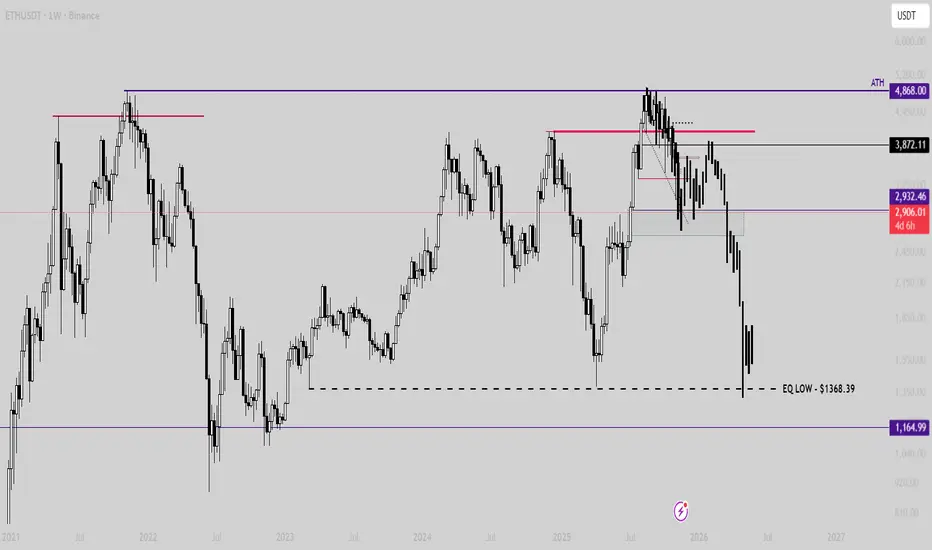
Why my ETH Holding has grownIn my last ETH update when the price was at $1700 and it looked as if the world was crashing, I mentioned I thought ETH was going to set a new ATH and so far it did but not at the price area I was expecting. I also did mention that I expected a return to around $3000 which is close to where it currently is.
All that said, I have had more time to look at the ETH chart and I think I may have been less bullish than I should have and as a result I grew my ETH holding since then. A few things I would like to point out.
One of which I mentioned in my last update. Looking at the ETH chart, it looks too similar to the gold chart with the ABC shakeout that gold went into before the massive rally.
Imagine holding GLD from Aug 2023 and selling in Oct 2023 because you could no longer handle the pain at this point below?
Now imagine those that held during this time, the fear and uncertainty they would have gone through. Personally, I think that is what the bookmakers are doing to ETH holders. If you believe the narrative that every asset will be tokenized and it ETH is the most trusted, then it makes sense to shake as many people out as possible before the GLD like rally.
Secondly, (although its a toss up) the action ETH is displaying now is similar to that of 2018 to 2020 and that we are in Sep-Oct of 2020 as you can see from the main chart and below as well.
Finally, the one bearish scenario is that we are doing the gold option but that we fail like this stock (PSNL) once we go and set a new ATM from here.
I had noticed the-same gold pattern and traded it but luckily I sold just before the failed breakout (so far) and you can clearly see the ABC pattern exactly like GLD before the breakout.
This is not a financial advice and I am not asking you to buy ETH. Just my opinion.
Please like, share and leave a comment.

$ETH Possible Scenario (Read Caption)If Ethereum fails to make a strong comeback above $4,200 and a strong weekly candle closes above this level, then this scenario is highly likely to occur.
Pay attention, this is just a possible scenario. In this case, the target will be under $1400.
Ethereum 1st Spot Buy Target has been reachedMarkets like to reverse at low volume nodes or fair value gaps, so as you can see, we have reached one of the lowest volume areas of this year so this can act as my personal buy target for Ethereum.
2nd and 3rd are noted as well.
Wish you all the best trading.

$1000 may be in 1-2 years?I think it's close to the bottom. It must stay above 240, otherwise all bets are off. If it turns around 240 and starts moving higher, this can turn bullish along with crypto. My target is in the range 750-1000. I am a buyer at these prices and lower.
Not a financial advice. I may change my mind anytime given the price and market conditions.

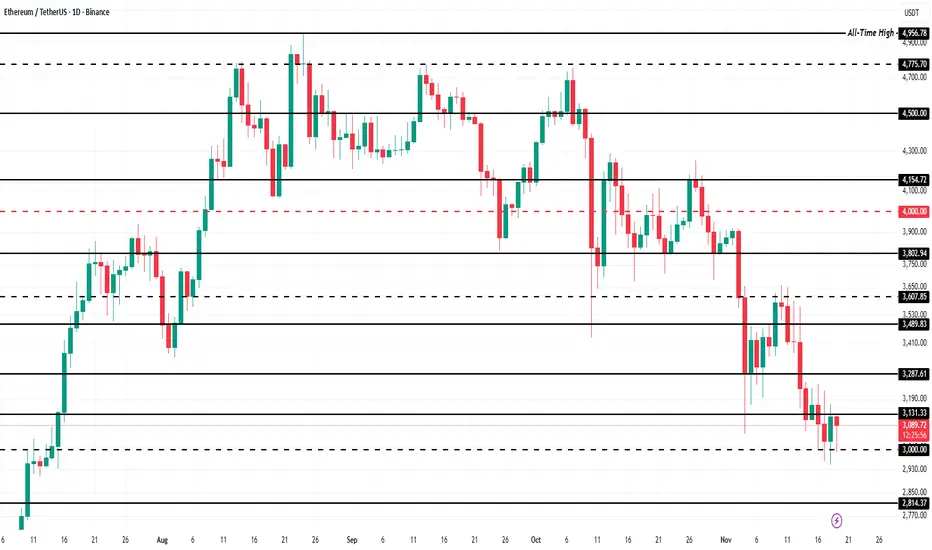
This Is How Ethereum Price Can Avoid A Crash Below $3,000Ethereum trades at $3,094, holding above the critical $3,000 support level after its sharp decline. This marks the first time in two months the asset has fallen this low. Maintaining support will be essential in preventing deeper losses and setting the stage for a potential recovery.
ETH is currently positioned below the $3,131 resistance level and is waiting for a catalyst to move higher. The supportive on-chain signals suggest that a push toward $3,287 is likely. If momentum strengthens, Ethereum could extend the rise and target $3,489 in the coming sessions.
If bearish pressure increases, Ethereum could break below $3,000 and invalidate the current bullish outlook. A fall through support may expose ETH to a decline toward $2,814 as selling intensifies. This scenario would reflect broader weakness and delay any major recovery attempt.
EthereumETHUSD
- Completed " 12345 " Impulsive Waves
- Consolidation Phase as an corrective pattern in Short Time Frame
- Break of Structure
- RSI - Divergence
- Change of Characteristics

#ETH/USDT : Rebound Setup from ascending channel Support#ETH
The price is moving within an ascending channel on the 1-hour timeframe and is adhering to it well. It is poised to break out strongly and retest the channel.
We have a downtrend line on the RSI indicator that is about to break and retest, which supports the upward move.
There is a key support zone in green at the 2930 price level, representing a strong support point.
We have a trend to stabilize above the 100-period moving average.
Entry price: 3064
First target: 3100
Second target: 3168
Third target: 3260
Don't forget a simple money management rule:
Place your stop-loss order below the green support zone.
Once you reach the first target, save some money and then change your stop-loss order to an entry order.
For any questions, please leave a comment.
Thank you.

ETH: Might have another chance to long!Hello Traders .
okay, this was the volume profile of ETH of the Binance! Any reaction to it could activate our buy option!

ETH/BTCHere is the range I'm looking at for the ETH/BTC pair. A bounce in this box means buying Ethereum will be more profitable than Bitcoin.

ETHUSD bearish continuation below 3,508 resistanceThe ETHUSD pair continues to display a bearish outlook, in line with the prevailing downward trend. Recent price action suggests a corrective pullback, potentially setting up for another move lower if resistance holds.
Key Level: 3,508
This zone, previously a consolidation area, now acts as a significant resistance level.
A failed test and rejection at 3,508 would likely resume the bearish momentum.
Downside targets include:
2,878 – Initial support
2,784 – Intermediate support
2,700 – Longer-term support level
Bullish Scenario (breakout above 3,508):
A confirmed breakout and daily close above 3,508 would invalidate the bearish setup.
In that case, potential upside resistance levels are:
3,590 – First resistance
3,665 – Further upside target
Conclusion
ETHUSD remains under bearish pressure, with the 3,508 level acting as a key inflection point. As long as price remains below this level, the bias favours further downside. Traders should watch for price confirmation around that level to assess the next move.
This communication is for informational purposes only and should not be viewed as any form of recommendation as to a particular course of action or as investment advice. It is not intended as an offer or solicitation for the purchase or sale of any financial instrument or as an official confirmation of any transaction. Opinions, estimates and assumptions expressed herein are made as of the date of this communication and are subject to change without notice. This communication has been prepared based upon information, including market prices, data and other information, believed to be reliable; however, Trade Nation does not warrant its completeness or accuracy. All market prices and market data contained in or attached to this communication are indicative and subject to change without notice.

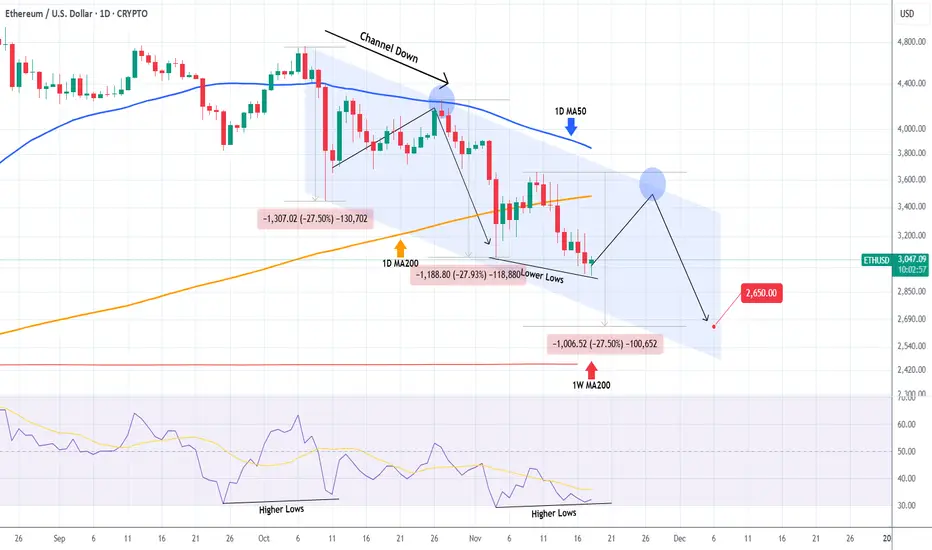
ETHEREUM Dead cat bounce incoming?Ethereum (ETHUSD) has been trading within a Channel Down since the October 07 High with both its Bearish Leg so far declining by -27.50% each.
As the 1D RSI is forming Higher Lows against the price's Lower Lows, i.e. a Bullish Divergence similar to October 11, it is possible to see a short-term bounce to test the 1D MA50 (blue trend-line) again (where the price got rejected on October 27), before it completes the -27.50% Bearish Leg projection.
The medium-term Target remains 2650.
---
** Please LIKE 👍, FOLLOW ✅, SHARE 🙌 and COMMENT ✍ if you enjoy this idea! Also share your ideas and charts in the comments section below! This is best way to keep it relevant, support us, keep the content here free and allow the idea to reach as many people as possible. **
---
💸💸💸💸💸💸
👇 👇 👇 👇 👇 👇
LTC: Don’t FOMO, Wait for Confirmation$LTC/USDT is getting squeezed between the rising trendline and the overhead resistance zone. Price has tested this resistance multiple times before but failed to break through.
A potential upside move could develop if we finally see a clean close above the marked zone.
Until then, it’s best to stay patient, don’t FOMO, wait for a clear breakout pattern.
DYOR, NFA

BTC/USDT | Bitcoin Drops Hard – Key Demand Zones Now in Play!By analyzing the #Bitcoin chart on the daily timeframe, we can see that BTC failed to hold above $104,700, and as expected, this led to a heavy sell-off. First, the price dropped to $94,000, and then a second strong wave pushed it down to $89,000. Bitcoin is now trading around $91,000.
Key supply zones and demand zones are marked on the chart. Important demand levels sit at $88,000, $84,000, and the larger zone at $74,000–$78,000. Watch how the price reacts to these areas.
If Bitcoin wants to recover, it must first hold above these key zones. But if BTC breaks below $74,000, it could open the door for a deeper drop toward $50,000. For now, focus on price reactions at the marked demand levels.
Please support me with your likes and comments to motivate me to share more analysis with you and share your opinion about the possible trend of this chart with me !
Best Regards , Arman Shaban

ASTER/USDT | ASTER Smashes All Targets – Over 40% Profit SecuredBy analyzing the #ASTER chart on the 2-hour timeframe, we can see that after our last analysis, price dropped to $0.91, then entered the demand zone and bounced strongly. It successfully hit all three targets — $1.17, $1.21, and $1.24 — even extending up to $1.285, giving over 40% total return. Currently, ASTR is trading around $1.00, and as long as it holds above the $0.90–$0.97 zone, we can expect another bullish move. The next potential targets are $1.09, $1.15, and $1.29.
Please support me with your likes and comments to motivate me to share more analysis with you and share your opinion about the possible trend of this chart with me !
Best Regards , Arman Shaban


ETHUSD – Bearish Channel Respect, Flag Breakdown SetupHi
The chart illustrates a clean, structured bearish trend where price continues to respect a broad descending channel. Each major reaction level and pattern aligns well with the larger downtrend, indicating that sellers are still in control.
Price recently tapped a key flip area near the upper boundary of the channel, a crucial zone where previous support has turned into resistance. The rejection from this area confirmed a strong supply and initiated a sharp decline, marked on the chart as the flagpole.
Following the impulse drop, the market entered a consolidation range, forming a classic bear flag structure. Price corrected roughly one-third of the flagpole; a typical retracement depth before continuation in a downtrend.
The drawn projection suggests a bearish continuation from the consolidation box, with the price expected to break lower. If momentum follows the channel’s trajectory, ETH could descend toward the first S&D zone, which aligns with the lower boundary of the macro channel. The marked target around 2848 sits near a liquidity and demand cluster, making it a logical tap point before any significant reversal or larger breakout attempt.
Disclaimer: As part of ThinkMarkets’ Influencer Program, I am sponsored to share and publish their charts in my analysis.

ETH:USD When bottom?ETH is at a make or break area at the moment. $2870-$2950 is a super major support zone for ETH. If price wants to go down a bit more, then the 0.5 fib level at $2730-$2630 would be another very strong support. The last bit of support would be the golden zone area between $2270 - $2180. Elliott wave perspective, ETH might have come to a spot where no one would complain if it turned around from here. RSI is showing bullish divergence. We can make a case for a full 5 waves for C. If market has other ideas, then this could be a larger wave 3 for a nested 1/2, 1/2. If that is the case, then price might head down to the lower levels mentioned above. But, for now, it does seem like capitulation has taken place, and the sell pressure has peaked. Until price is above at least $4285, it can still be a larger AB with another leg down for C. Ideally, we would want to see another ATH with a complete 5 waves sequence up before we know for sure. My plan is to start nibbling ASAP to add back to my bag with a stop loss. When the sentiment is this bearish, it has always worked out, at least in the short term. If the minor Wave 2 is indeed over, then we should start prepping for massive fireworks. On macro cycle minor wave 3s are the strongest. We'll see how things go, but I am hopeful; until market decides to throw dirt in my eyes!

$ETH Weekly UPDATE. Ethereum has hit the $3050 CRYPTOCAP:ETH Weekly UPDATE.
Ethereum has hit the $3050 zone right as expected, and sellers are still pressing down. The rejection from $3500 confirmed that momentum flipped bearish and structure has not recovered since. As long as price stays under the $3400–$3500 range, the downside pressure remains valid.
ETH is now breaking below $3000. If it fails to recover and hold above this level, the next liquidity pockets sit at $2800 and $2600, where buyers may try to defend. Until then, patience favors the bears. But if ETH holds $3000, a reversal toward $3400–$3500 is possible.
The only real shift in momentum comes if ETH reclaims the 1W 50 EMA and builds support above it. That would open the door for a sharp move back toward $3800–$4000. Until then, every bounce is just a reaction, not a reversal.

Checking for support near 3472.96
Hello, traders!
Follow us to get the latest information quickly.
Have a great day!
-------------------------------------
(ETHUSDT 1D chart)
This period of volatility is expected to last until November 14th.
After this period of volatility, the key question is whether the price can rise after gaining support near the HA-Low indicator (3472.96) on the 1D chart.
At this point, it's crucial to see if the price can rise above the M-Signal indicator on the 1W chart and maintain its upward momentum.
If the price fails to rise, it is expected to meet the M-Signal indicator on the 1M chart again.
Therefore, to continue the uptrend, the price must remain above the 3239.06-3472.96 level.
The formation of the HA-Low indicator on the 1D chart indicates a significant decline, forming a low.
Therefore, even if the downtrend continues, there's a possibility of an eventual uptrend, so we need to consider countermeasures.
However, if the price meets the HA-High indicator on the 1D chart or falls near the HA-High level, the price is likely to decline until it meets the HA-Low indicator again or the DOM (-60) indicator.
Therefore, we must remember the basic trading strategy of buying in the DOM(-60) ~ HA-Low range and selling in the HA-High ~ DOM(60) range.
If the HA-High ~ DOM(60) range rises, a stepwise upward trend is likely, while if the DOM(-60) ~ HA-Low range falls, a stepwise downward trend is likely.
Therefore, the basic trading strategy should be a segmented trading approach.
To determine trading within the box range and trend trading outside the box range, we refer to the additional auxiliary indicators, StochRSI, TC (Trend Check), and OBV.
To continue the uptrend by breaking above a key point or range, the StochRSI, TC, and OBV indicators must show upward trends.
1. The StochRSI indicator should not have entered the overbought zone.
2. The TC indicator should remain above 0. 3. The OBV indicator should remain above the High Line.
Therefore, it's important to observe the movement around important points or ranges, such as the DOM(-60) ~ HA-Low and HA-High ~ DOM(60).
The next period of volatility will be around November 20th.
-
Thank you for reading to the end.
I wish you successful trading.
--------------------------------------------------

$ETH – Bear Flag Developing as $BTC Cracks Key SupportEthereum ( CRYPTOCAP:ETH ) is forming a bear flag pattern just as Bitcoin ( CRYPTOCAP:BTC ) starts to crack under major support — this could get ugly fast if we lose the key levels in both charts.
🔹 The Setup:
CRYPTOCAP:ETH is hovering around $3,000, a huge psychological and structural level on the chart.
The current flag structure looks weak — lower highs, declining volume, and repeated rejections at the 9 EMA.
A flush below $3,000 opens the door to a deeper move, potentially into the mid-$2,000s or even lower.
🔹 Macro & Market Context:
The entire risk complex looks shaky — if NASDAQ:NVDA disappoints on earnings, it could accelerate selling across crypto and equities.
CRYPTOCAP:BTC ’s failure to hold support is a red flag — crypto tends to move together on momentum shifts.
Watch for risk-off confirmation in NASDAQ:QQQ , AMEX:IWM , and high-beta names.
🔹 My Trade Plan:
1️⃣ Position: Short CRYPTOCAP:ETH here with a stop over the 9 EMA on the daily.
2️⃣ Target: First zone in the mid-$2,000s, potential extension if panic sets in.
3️⃣ Trigger: Breakdown confirmation under $3,000 with volume.
Why I Like This Short:
Clean bear flag structure with well-defined risk.
CRYPTOCAP:BTC and risk assets breaking key levels together = confluence.
CRYPTOCAP:ETH has plenty of air pockets below $3,000 — the technicals support continuation.

STRK Finally Escapes the RangeNASDAQ:STRK has finally broken out of its long consolidation zone and pushed above the descending trendline—something the chart hasn’t managed to do for months. This breakout shows a clear shift in momentum, with buyers stepping in strongly.
As long as price holds above this zone, STRK could be gearing up for a continuation move to the upside. The structure looks healthier now, and the breakout suggests the trend may be turning in favor of the bulls.
DYOR, NFA
Please hit the like button if you like it, and share your views in the comments section.
