The key is whether it can rise above 4403.87
Hello, traders.
Follow us to get the latest information quickly.
Have a great day.
-------------------------------------
(ETHUSDT 1W chart)
The formation of an upward trend line (A) created an upward channel from (A) to (B).
Therefore, the key is whether it can continue to rise along this upward trend line.
If the upward movement fails, we need to check whether the price rises along the rising trend lines (1) and (2).
Therefore, the 3900.73-4107.80 range is a crucial area for sustaining the upward trend.
In this context, we expect a significant period of volatility to begin around the week of November 24th.
This period of volatility could continue until around the week of January 12th, 2026.
-
(1M Chart)
If this month closes with a bearish candle, forming an upward trend line (a), the key question is whether the price can rise along trend line (a).
If not, there's a possibility of touching the upward trend line (2), so we need to consider a response plan.
-
(1D Chart)
The key is whether the price can sustain above the uptrend line (1) and rise above 4403.87.
To do this, we need to see if it can break above the downward channel created on the 1D chart.
Therefore, we need to observe how the price moves after the volatility period around November 5th.
The HA-High ~ DOM(60) section (4393.04-4780.15) on the 1W chart overlaps with the HA-High ~ DOM(60) section (4403.87-4749.30) on the 1D chart, so it's likely to act as resistance.
------------------------------------
The basic trading strategy is to buy in the DOM(-60) ~ HA-Low section and sell in the HA-High ~ DOM(60) section.
However, if the price rises from the HA-High to DOM(60) range, a step-like uptrend is likely, while if it falls from the DOM(-60) to HA-Low range, a step-like downtrend is likely.
Therefore, a split trading strategy is recommended.
To maintain a step-like uptrend in the DOM(-60) to HA-Low range,
1. The StochRSI indicator must be rising. If possible, it should not enter the overbought zone.
2. The On-By-Value (OBV) indicator must be rising. If possible, it should remain above the High Line.
3. The TC (Trend Check) indicator must be rising. If possible, it should remain above the 0 level.
If the above conditions are met, the uptrend is likely to continue.
If not, a high point is likely to form, so you should consider a countermeasure.
-
Thank you for reading to the end.
I wish you successful trading.
--------------------------------------------------
Ethereum (Cryptocurrency)

MAKE or BREAK for Ethereum: New ATH or Epic SHAKEOUT?This week is shaping up to be ABSOLUTELY CRUCIAL for ETHEREUM!
Low Exchange RESERVES are still drawing in investors like moths to a flame. But hold on—something feels OFF the table here.
The news is glaringly OBVIOUS to everyone: rate cuts, QE, trade deals, and all those technical factors screaming "bull run ahead." But in crypto, when EVERYONE knows something, it rarely plays out as expected. Contrarian vibes, anyone?
My gut is screaming: This will be a VOLATILE WEEK , and a SHAKEOUT is essential for a rock-solid BULL RUN in Ethereum during this cycle. Without it, hitting a new ALL-TIME HIGH could feel flimsy, leading to a HISTORICAL DUMP right after the hype fades.
Pro tip: Keep EXTRA MARGINS in your account to dodge those sneaky WHALE TRAPS.
Follow and like if this analysis fired you up! 🚀📉

Long on EthereumWe are currently above the 50 EMA and 200 EMA.
Breaking out of the giant ascending triangle with a retest.
This could be a 4/5x from here with a top target of approximately $20,000 per ETH.
I’ll be long Ethereum until we hit or get close to the price action trendline.

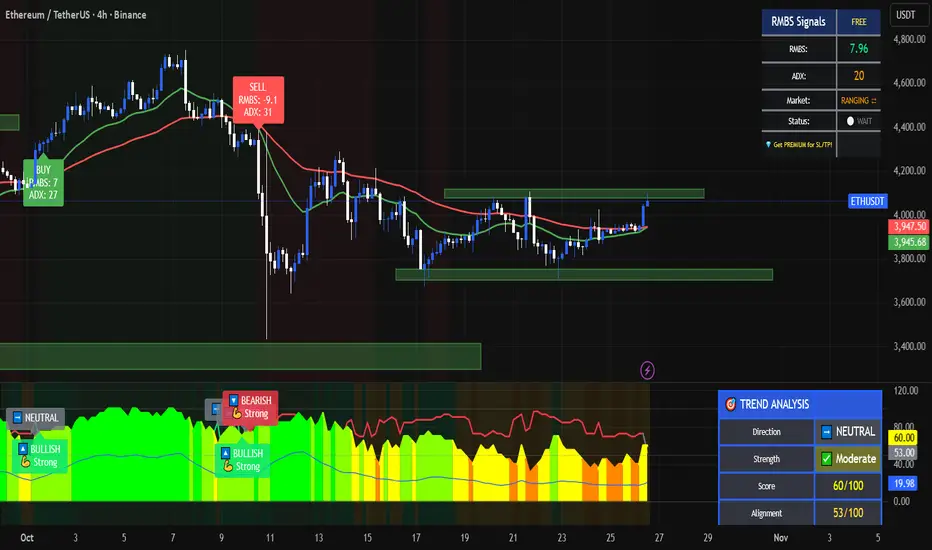
RMBS Shows Ethereum in Range Mode — Correction Still on the Tabl🔸 Ethereum is ranging between $4,100 and $3,700.
The RMBS indicator also confirms this sideways phase.
Everyone knows I’ve been expecting a deep crypto correction — though in markets, we deal with expectations , not prophecies .
#Ethereum #Crypto #Trading #BTC #ETH #TechnicalAnalysis #RMBS #CryptoMarket
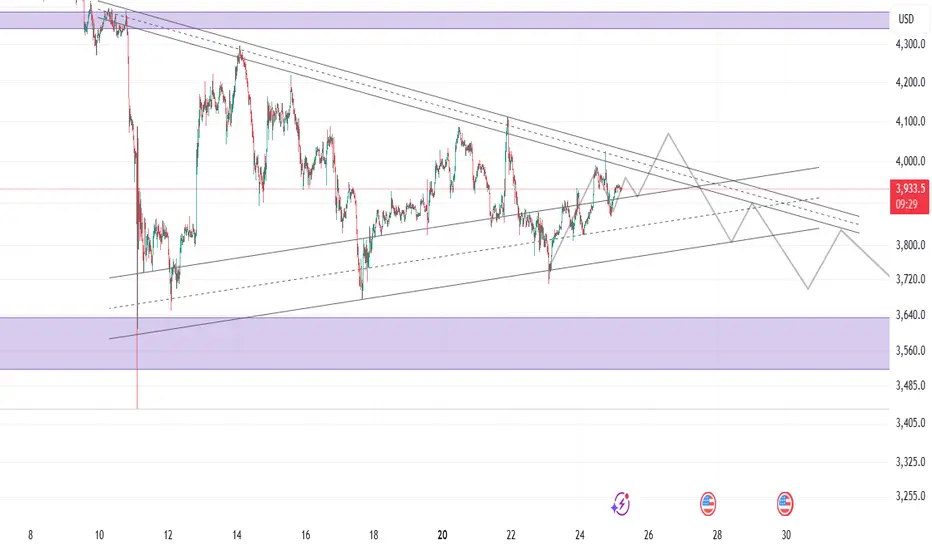
Inside the channel and Flies.If you look at market patterns and Bollinger bands, price always goes from high volatility to price discovery, tightens. Market shows clear direction, ie 🟢 or 🔴.
The same when using longterm charts, they fluctuate and you can almost find where the important channel gonna be.
It's psychology.
85% bullish. 15% it fails, imo.:)

ETHUSD - Bullish Curve UpFollowing the trend line in green, should breakout and touch the white dotted line again
Very bullish on Ethereum right now and altcoins in general
Daily chart

ETH Support Holding, But Cracks ShowingAs long as CRYPTOCAP:ETH holds the key support zone, the overall structure remains bullish and there’s nothing to worry about.
However, the technical setup is starting to weaken, a break below this support could turn things ugly, especially for altcoins.
DYOR, NFA
#PEACE
Thanks for reading! Appreciate your support and engagement 🙏

AIXBT Approaching Breakout Zone$AIXBT/USDT has fully recovered from the recent crash and is now trading near a key resistance, a level that previously acted as strong support.
If the price manages to close above this zone, it could trigger a massive upside move. Definitely one to keep a close eye on.
DYOR, NFA

ETHUSDETH is forming a bullish flag pattern on top of a resistance level. We still have everything in place for a big upward movement. November tends to be a period of accumulation, leading to an upward movement in December. In other words, BTC tends to rise. BTC is currently accumulating in the range of 106,500k to 122,500k.

Ethereum VS. Russell 2000 Russell 2000 index and Ethereum charts follow a strikingly similar pattern.
Both assets peaked in November 2021 and then entered a prolonged correction. Interestingly, both formed major lows around April 2025.
The Russell 2000, just before breaking through the 2021 ATH resistance area, retested the demand zone, just as CRYPTOCAP:ETH is currently doing.
This similarity suggests that Ethereum could be poised for a strong breakout, following in the footsteps of the Russell 2000.
History is sometimes more than just a coincidence…

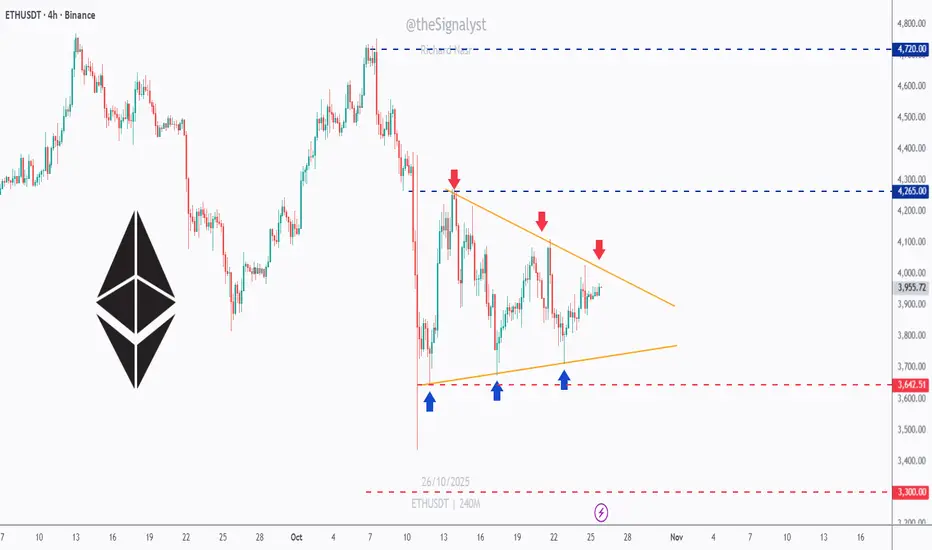
ETH - The Symmetrical Triangle of the Month!Ethereum has spent most of October coiling inside what can only be called the symmetrical triangle of the month => a textbook compression of volatility where both bulls and bears are building pressure for the next decisive move.
📦Price is trapped between the $4,265 resistance and $3,640 support, with multiple clear reactions from both boundaries. Each time ETH bounces off the lower orange trendline, buyers step in aggressively… but every push higher has been capped by lower highs, a perfect battle of strength versus patience.
The breakout from this formation will likely dictate ETH’s next major swing.
- A break above $4,265 could ignite a rally toward $4,720 and beyond.
- A break below $3,640, however, would expose $3,300, a strong historical demand zone.
⚔️ Until one side wins , it’s all about staying patient, waiting for confirmation, and letting the structure do the talking. The tighter this triangle gets — the bigger the breakout tends to be.
⚠️ Disclaimer: This is not financial advice. Always do your own research and manage risk properly.
📚All Strategies Are Good; If Managed Properly!
~Richard Nasr
HYPE/USDT Price Heating UpGETTEX:HYPE is showing a nice bounce from the key support zone, holding that area quite well. The price is now approaching a minor resistance around the trendline.
If it manages to break and close above this line, we could see a strong upside move in the coming sessions.
DYOR, NFA
PEACE

$ETH in the calm before the storm.In the HTF view, Ethereum maintained its structural strength with rising lows, broke the major supply zone and is currently progressing in the retest process.
It is quietly accumulating strength and preparing for a new move between the 2021 ATH resistance and the area that used to be the supply zone and now serves as support as the demand zone.
Bear market rhetoric may be prevalent, but structural data suggests Ethereum is preparing for a major rally.

Ethereum weakened or holding structure? | ETH 1H Analysis👋🏻 Hey everyone! Hope you’re doing great! Welcome to SatoshiFrame channel.
✨ Today we’re diving into the 1-Hour Ethereum analysis. Stay tuned and follow along.
👀 We observe Ethereum on the 1-hour timeframe. After breaking and stabilizing at the $3,889 zone, Ethereum formed a higher low on this area and is now moving along a trendline (dynamic support), with an important static resistance at $3,982.50. Price has reacted to this level once but has not succeeded in breaking it!!!
🧮 Using the RSI oscillator is a reasonable approach in this situation. Since Ethereum is currently in a box/trading range, a breakout requires entering overbuy territory and surpassing the 70 level. Note that there is a significant oscillation support below the average, at the 44.5 zone, which holds strong validity and represents our swing low.
🐷 Pay attention to Ethereum’s volume. To break the specified zone, Ethereum needs to show a strong reaction, fill sell orders, and liquidate futures contracts. Therefore, we need buyer market makers to support the breakout, causing volume to increase through a price jump.
✍️ The scenario forming for Ethereum may require some patience and could play out differently, because we are now facing the second touch of this level, so the win rate of this scenario may be slightly lower.
🟢 Long Position Scenario
Breaking Ethereum’s resistance at $3,982.50 along with surpassing the 70 RSI level and seeing a significant increase in buying volume and price squeeze can form a good long position scenario on Ethereum.
❤️ Disclaimer : This analysis is purely based on my personal opinion and I only trade if the stated triggers are activated .

Ethereum Short-Term Breakdown Imminent | ETHUSD Short Setup🚨 Ethereum (ETHUSD) Market Update – Short-Term Setup 🚨
Ethereum is displaying clear weakness on higher levels, as the recent bounce appears to be a relief move rather than a full trend reversal. The resistance zone between $4074 – $4175 remains crucial — price rejection from this area can offer a high-probability short opportunity.
We’re currently holding short positions from $3930, and if ETH extends upward, DCA shorts will activate near $4175 for a better average entry.
📉 Downside targets to watch:
🎯 $3750
🎯 $3636
🎯 $3540
🎯 $3480
Until a confirmed correction forms, avoid aggressive long setups. Market sentiment remains fragile, and bulls may face strong resistance around the upper range.
⚠️ Timeframe: 15-Minute (Scalp / Short-Term Setup)
💡 Tip: Manage risk carefully and trail stops as price moves in your favor.
📊 Follow me on TradingView for more real-time ETH and BTC updates, short-term scalps, and market breakdowns. Your feedback and comments are always welcome!
ETH Eyes Upside RunEthereum shows signs of regaining strength after a prolonged corrective phase. The asset is currently stabilizing, supported by gradual inflows from institutional participants and renewed investor accumulation. Market behavior indicates controlled volatility, suggesting a preparation phase before a potential expansion.
Network data reflects consistent transaction activity, while liquidity concentration hints at sustained participation from long-term holders. The recent stabilization in funding rates and improved open interest add weight to the recovery outlook.
If momentum continues to build under these conditions, Ethereum could enter a structured growth cycle in the coming sessions.

Don't sleep on Ethereum!Ethereum is following the pattern seen before the 2021 bull run of Bitcoin, and we are now in the final stages before the parabolic run for Ethereum.
CRYPTOCAP:BTC 2017\2021 vs. CRYPTOCAP:ETH 2021\2025

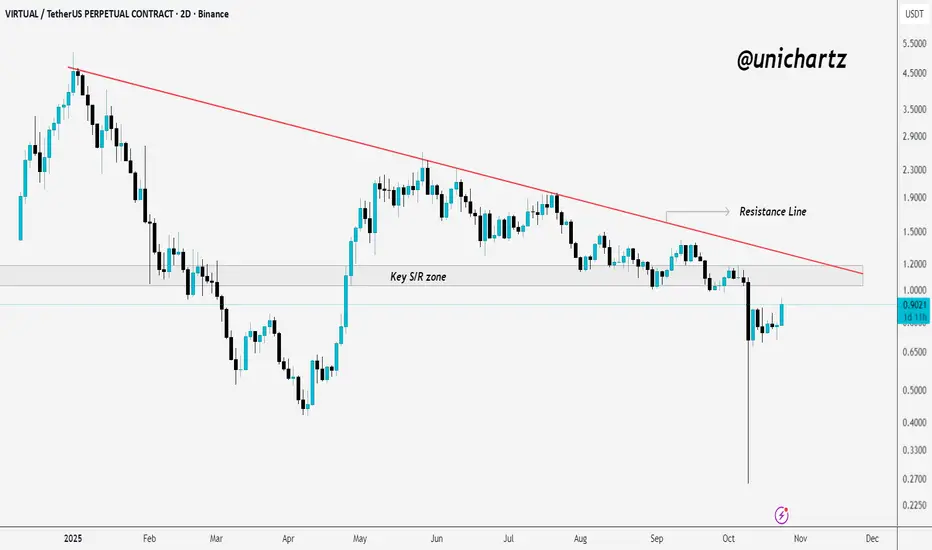
VIRTUAL Rebounds Strongly but Faces Key ResistanceSPARKS:VIRTUAL has rebounded strongly from the bottom after the recent drop but is still trading below the resistance zone, which once acted as key support.
A breakout and close above this zone could signal a shift in momentum and open the way for further upside, while rejection here might lead to a short-term pullback.
DYOR, NFA
Why I’m Focused on Ethereum (and BTC) — and Ignoring Other AltsWhy I’m Focused on Ethereum (and BTC) — and Ignoring Other Alts🎯
Let’s catch up on the big picture 🧠
Bitcoin Dominance is climbing again — no surprise if you've been following the structure. After rejecting from the previous channel breakdown (which aligned with Ethereum’s last pump), we are now likely heading for a third touch near 62.25% . Until then, alts may stay muted .
As for Bitcoin itself, the October flash and last Friday’s move created a potential triple test pattern. Expect sideways and choppy price action — resistance at 103k is key. These levels are hard to trade… until they suddenly become very easy. 🧩
On the one-day chart, this is nothing new — we've seen pullbacks from 72k to 50k before explosive moves. Still bullish.
But let’s be real — Ethereum is the alpha here . 💙
Last Friday’s move was well above the October 11th flash crash, and it respected all the posted levels perfectly. ETH support = 3789 , resistance = 4100. Still long ETH , and still my preferred asset.
That bias is supported by Ethereum Dominance — currently at 12%, targeting 18% . Add to that ETH/BTC chart expecting a rise to 0.0645532 — and you see why ETH is at the center of my thesis.
As I said: “When I say it will happen, it usually happens.”
I’m not looking at Solana, XRP, BNB, Pepe, ADA, LINK, GRT, or TRON . Right now, it’s all about Bitcoin and Ethereum — especially Ethereum.
💡 How I Trade
No secrets:
— Daily budget
— High leverage but small size
— Stick to one direction (currently LONG)
— Buy dips , don’t panic
— Levels are everything
I haven’t deposited in 5 years. That tells you enough.
Right now, I’m long over 3789 . Same level from early September. The system works. Respect the levels, and they’ll work for you too.
🔄 Perspective Shift
This is a new cycle. After the FTX + Luna catharsis, we’re entering the next act. It’s not just Bitcoin that will prevail — crypto will prevail . Stay alert. I’ll break it all down in future updates.
One Love,
The FXPROFESSOR 💙
⚠️ I'm not a financial advisor — I'm a master of Prognosis. These are my personal views. I read charts like a poet reads the stars. You still gotta trade at your own risk, if you want to trade at all! 🧠💥

Ethereum Sees Major Sell-Off as Price Fails to Break $4,000Ethereum’s price sits at $3,950 at the time of writing, stuck below the critical $4,000 resistance. The altcoin has been oscillating near $3,872, showing no clear directional bias.
The current indicators suggest that this consolidation phase above $3,742 support is likely to persist. However, if market conditions worsen and ETH slips below $3,742, a further decline toward $3,489 could follow. Such a move would confirm a bearish continuation pattern.
Conversely, if buying activity strengthens and overall sentiment improves, Ethereum could breach the $4,000 resistance level. A successful breakout would open the path toward $4,221, invalidating the bearish outlook and signaling renewed investor confidence.

Potential bearish drop off?Ethereum (ETH/USD) has rejected off the pivot and could drop to the multi swing low support.
Pivot: 3,934.93
1st Support: 3,691.52
1st Resistance: 4,093.31
Disclaimer:
The above opinions given constitute general market commentary, and do not constitute the opinion or advice of IC Markets or any form of personal or investment advice.
Any opinions, news, research, analyses, prices, other information, or links to third-party sites contained on this website are provided on an "as-is" basis, are intended only to be informative, is not an advice nor a recommendation, nor research, or a record of our trading prices, or an offer of, or solicitation for a transaction in any financial instrument and thus should not be treated as such. The information provided does not involve any specific investment objectives, financial situation and needs of any specific person who may receive it. Please be aware, that past performance is not a reliable indicator of future performance and/or results. Past Performance or Forward-looking scenarios based upon the reasonable beliefs of the third-party provider are not a guarantee of future performance. Actual results may differ materially from those anticipated in forward-looking or past performance statements. IC Markets makes no representation or warranty and assumes no liability as to the accuracy or completeness of the information provided, nor any loss arising from any investment based on a recommendation, forecast or any information supplied by any third-party.

Comparison: Gold’s Triple Top vs. EthereumLet’s take a look at the charts. Gold formed a triple top before breaking out strongly, and the current Ethereum structure looks strikingly similar, only moving much faster.
The gold chart you see here developed over 15 years, while Ethereum’s pattern has taken shape in just 4 years.
When a resistance level is tested multiple times, it often eventually breaks.
I’m sharing this analysis to help you recognize recurring patterns across markets. History doesn’t repeat itself perfectly, but it often rhymes.

#ETH/USDT : Another Attempt To Resume Upward Movement#ETH
The price is moving within a descending channel on the 1-hour frame, adhering well to it, and is heading for a strong breakout and retest.
We have a bearish trend on the RSI indicator that is about to be broken and retested, which supports the upward breakout.
There is a major support area in green at 3826, which represents a strong support point.
We are heading for consolidation above the 100 moving average.
Entry price: 3874.
First target: 3920.
Second target: 3969.
Third target: 4200.
Don't forget a simple matter: capital management.
When you reach the first target, save some money and then change your stop-loss order to an entry order.
For inquiries, please leave a comment.
Thank you.
