ETHUSD H1 | Possible Bearish Turn Ahead”ETH/USD is rising towards the sell entry, which is a pullback resistance that is slightly above the 50% Fibonacci retracement and could reverse from this levle to the downside.
Sell entry is at 3,936.30, which is a pullback resistance that is slightly above the 50% Fibonacci retracement.
Stop loss is at 4,079.07, which is a pullback resistance.
Take profit is at 3,703.89, which is a multi-swing low support.
Stratos Markets Limited (tradu.com ):
CFDs are complex instruments and come with a high risk of losing money rapidly due to leverage. 68% of retail investor accounts lose money when trading CFDs with this provider. You should consider whether you understand how CFDs work and whether you can afford to take the high risk of losing your money.
Stratos Europe Ltd (tradu.com ):
CFDs are complex instruments and come with a high risk of losing money rapidly due to leverage. 70% of retail investor accounts lose money when trading CFDs with this provider. You should consider whether you understand how CFDs work and whether you can afford to take the high risk of losing your money.
Ethereum (Cryptocurrency)

ETH 1h Triple Bottom – Eyes on 4200 BreakoutThe Ethereum 1-hour chart displays a textbook triple bottom formation, with clear support established around the 3700–3750 level (see attached chart). This pattern emerged after multiple retests, indicated by green lines marking three distinct lows. The triple bottom suggests sellers may be exhausted and buyers are defending this zone.
Bullish divergence is also visible in both RSI and MACD indicators. Both momentum oscillators show higher lows, adding strength to the reversal signal. Price action remains inside a descending channel, but the repeated rejection from the green support zone and visible volume buildup increases the probability of a breakout.
If momentum continues, a successful rally could challenge overhead resistance at 4200, which coincides with previous range highs and a significant volume profile cluster. The red resistance zone is defined as the primary target area for longs. Should this level be breached, further upside will depend on market conditions and macro sentiment.
Trade Plan
Entry: Around 3760–3800 upon confirmed bullish reversal or close above channel resistance.
Take Profit: Primary target at 4200; partials recommended between 4100–4200.
Stop Loss: Below 3700, upon invalidation of the triple bottom.
Notes
Watch for confirmation and volume spike before entering. A failure to hold the green support invalidates the setup.
NFA.

Stop!Loss|Market View: BTCUSD🙌 Stop!Loss team welcomes you❗️
In this post, we're going to talk about the near-term outlook for the BTCUSD ☝️
Potential trade setup:
🔔Entry level: 107751.78
💰TP: 96726.16
⛔️SL: 114171.76
"Market View" - a brief analysis of trading instruments, covering the most important aspects of the FOREX market.
👇 In the comments 👇 you can type the trading instrument you'd like to analyze, and we'll talk about it in our next posts.
💬 Description: The main scenario for sell via a breakout of the lower border of the global accumulation of 110,000 - 122,000 remains. The price has already tested the lower border 4 times, indicating clear seller initiative. Following a downward breakout, the price is expected to approach at least the 100,000. A target near 90,000 is also looked for.
Thanks for your support 🚀
Profits for all ✅
❗️ Updates on this idea can be found below 👇

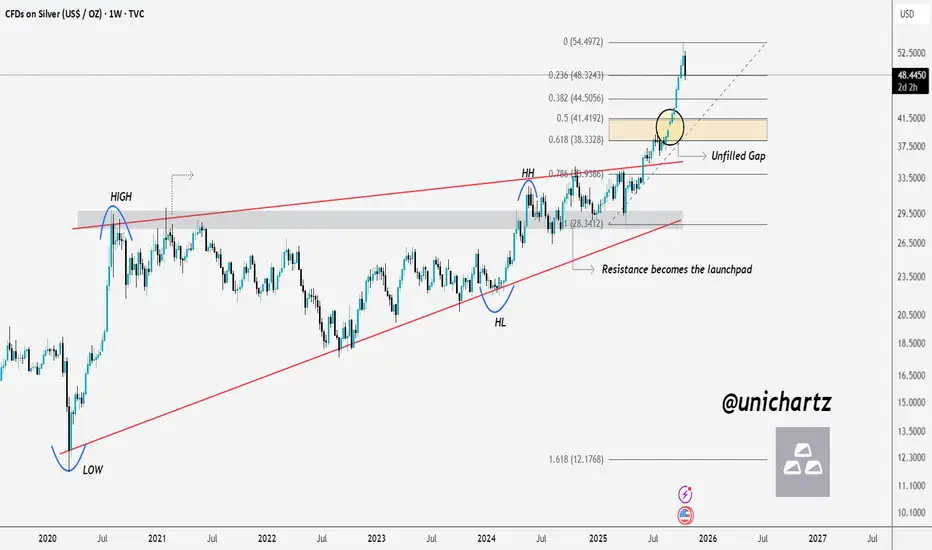
Correction Incoming – Silver Eyes Fib ZoneSILVER Weekly Analysis 🪙
At first, Silver faced strong rejection from the resistance zone, but once it finally broke out, the price came back to retest that same resistance — which then turned into a powerful launchpad, sending prices to new all-time highs.
Currently, the price is showing early signs of a correction. I’m expecting a possible retest of the Golden Fib Zone (0.5–0.618), where there’s also an unfilled gap near the 0.5 level. A move toward that area would make sense before the next major leg higher.
Resistance becomes the launchpad.
DYOR, NFA
Thanks for reading! Appreciate your support and engagement 🙏
ETH 30-Min – The 200MA Holds the Key
This is ETH on the 30-minute chart.
The 200MA has been the main pivot for price action lately — and it might decide the direction for the rest of the week.
Last Sunday around 08:00, price attempted to conquer the 200MA, leaving a small wick above it.
Shortly after, it flipped the 200MA into support and climbed higher into the weekly close.
Today at 00:00, ETH retested the same level, bounced again, and pushed higher until 15:30, when it lost the 50MA and started a short-term drop.
At 17:30, it found support again at the 200MA — and since then, every 30-minute candle has closed higher.
If ETH continues to hold above the 200MA, momentum could build for a move higher through the week.
Lose it, and the structure shifts back to consolidation.
Always take profits and manage risk.
Interaction is welcome.

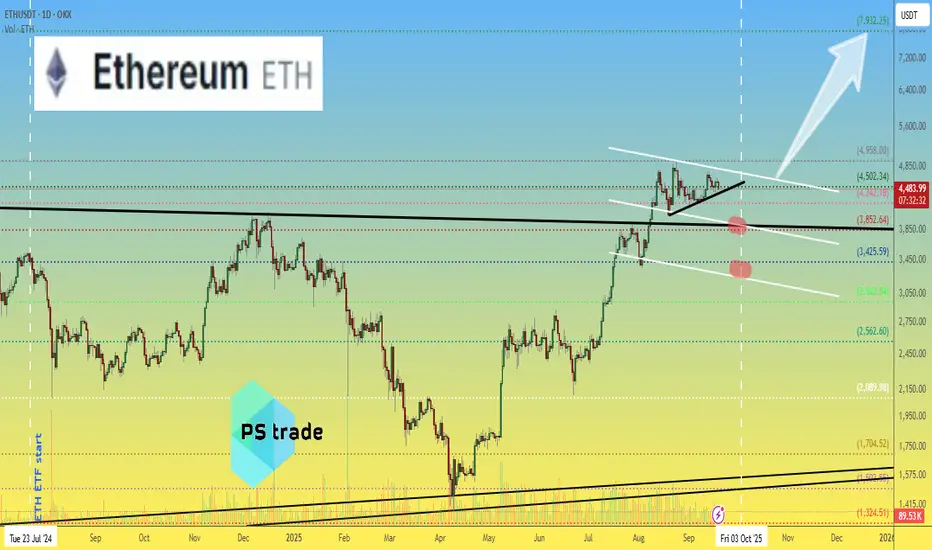
Ethereum ETH Price Outlook — Key Levels to WatchCRYPTOCAP:ETH continues to hold strong momentum, with OKX:ETHUSDT showing solid support.
A correction toward $3775–3850 would already be considered significant.
A deeper pullback into the $3250–3450 zone could offer attractive long-term entries.
With current conditions, further downside below this range looks less likely.
🤔 Do you expect #Ethereum to retest lower levels, or are we preparing for new highs?
______________
◆ Follow us ❤️ for daily crypto insights & updates!
🚀 Don’t miss out on important market moves
🧠 DYOR | This is not financial advice, just thinking out loud.
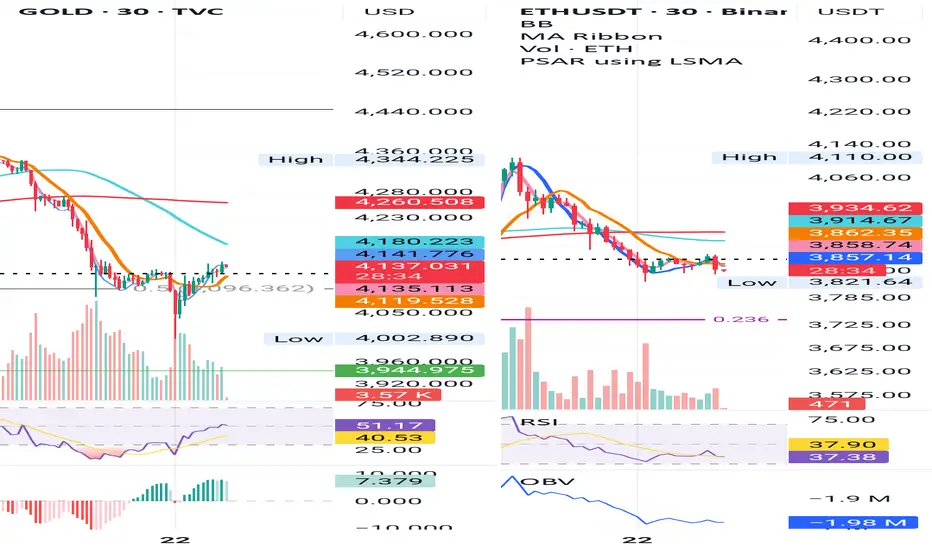
Gold & ETH 30-Min – Parallel Structures, Subtle Differences
Gold found support right at the 0.5 Fib 4096 $ and is now trading above yesterday’s close, a sign of renewed strength.
ETH, meanwhile, is retesting yesterday’s close as support but is now slipping slightly below it, showing early weakness after failing to sustain the bounce.
From a system perspective, both charts are aligned:
BB Center < SMA < Price < MLR, a constructive setup that still supports potential continuation, if price stabilizes above support.
However, Gold continues to show more strength, holding structure more cleanly and staying resilient above key short-term levels.
This parallel move between a risk asset (ETH) and a defensive one (Gold) suggests a market in transition: strength rotating, but not breaking.
Bias: Short-term neutral-to-bullish, Gold firm, ETH needs confirmation.
Always take profits and manage risk.
Interaction is welcomed.
Ethereum Price Stuck Below $4,000 as LTHs Apply Selling PressureEthereum’s price trades at $3,846 at press time, slipping below the $3,872 support level. The altcoin king has remained stuck under $4,000 for nearly a week, reflecting fading momentum and tightening volatility in the broader crypto market.
Given the prevailing selling pressure and weak inflows, Ethereum’s price could fall further toward the $3,742 support zone. If this level fails to hold, a deeper correction could follow, pushing ETH down to $3,489. Such a decline would reinforce the current bearish outlook.
However, if Ethereum holders curb their selling and demand strengthens, ETH could rebound above $4,000. A decisive break of this resistance could lift prices toward $4,221, signaling renewed optimism and invalidating the prevailing bearish setup.

$ETH Retest completed, now It's time to run.The downtrend from the November 2021 peak has broken and is in a retest phase.
Ethereum is no longer in a "rejection" phase, but in a "retest" phase.
Next page \ price discovery.

BMNR HIGH PROBABILITY SETUP SOON!!!🚨 BMNR HIGH PROBABILITY BUY SETUP 🚨
* Here We Can See Clearly The Next Potential Moves For BMNR Coming Hours/Days.
* Keep Your Eyes Close On Your Trading Positions.
* Happy PIP Hunting Traders.
FXKILLA.

USDT.D Breaks Out, Altcoin Correction Ahead?USDT.D has broken above the resistance trendline and is now forming higher highs and higher lows, a clear sign of a bullish structure shift.
If the price breaks above the next resistance, we could see more correction across altcoins.
Keep an eye on USDT.D and stay tuned for further updates.
DYOR, NFA

Ethereum - The clear $20.000 target!🚀Ethereum ( CRYPTO:ETHUSD ) is breaking out:
🔎Analysis summary:
Despite the recent back and forth, Ethereum clearly remains bullish. We are still able to see the underlying triangle pattern, which Ethereum is attempting to break again. After a successful breakout, Ethereum will immediately start the next potential +350% rally.
📝Levels to watch:
$4,500 and $20,000
SwingTraderPhil
SwingTrading.Simplified. | Investing.Simplified. | #LONGTERMVISION

$GOLD Rally Pause – Will the Golden Fib Hold?TVC:GOLD has seen a strong rally after months of accumulation, but the recent sharp pullback looks like a healthy correction rather than a trend reversal.
Currently, price is approaching the Golden Fib Zone (0.5–0.618), an area that often acts as a strong support during ongoing uptrends. If the price manages to hold this zone and form a solid base, we could see the next leg higher, potentially leading to new highs.
For now, the focus remains on how price reacts at this Fib zone, a bounce here could confirm continuation, while a breakdown below may signal a deeper correction.
DYOR, NFA
THANKS FOR THE READING

ETH Consolidating Before the Next Move$ETH/USDT has been trading sideways for the past 74 days, holding strong at the confluence of the rising trendline and key support zone. This prolonged consolidation suggests that both buyers and sellers are in a state of equilibrium, waiting for a decisive move.
A breakout on either side could set the tone for the next major trend. If ETH manages to hold this support and gain momentum, we might see a strong recovery toward the upper resistance levels.
However, if it loses this zone, a deeper correction could follow before any significant upside move.
DYOR, NFA
PEACE

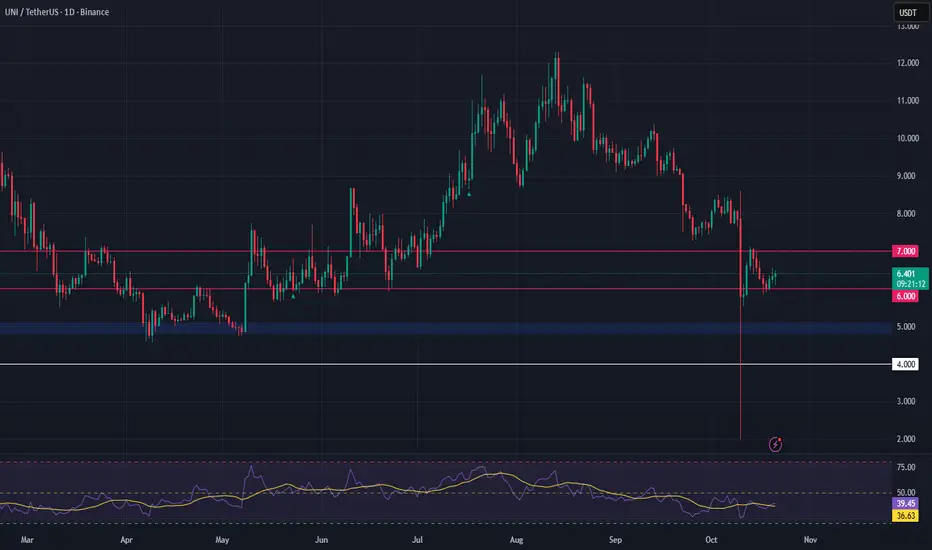
UNI/USDT – Bullish Setup as Uniswap Expands Cross-Chain AccessUniswap just integrated Solana into its Web App, enabling swaps across Ethereum and 13+ other networks. This move significantly expands Uniswap’s ecosystem and could drive a surge in DEX volumes, adding fundamental strength to UNI.
Technically, UNI is trading near a key accumulation zone between $4.80–$5.10. A sustained hold within this range offers a potential long opportunity, especially as momentum picks up with this major protocol update.
🔹 Entry Zone: $4.80–$5.10
🔹 Targets: $6.00, $7.09
🔹 Stop Loss: Below $4.00
ETHUSD Is showing a great buy opportunity - low risk high rewardETHER - ETH/USD experienced a big drop to the downside like most other cryptocurrencies... but it nows has very clear signs of a major bullish movement ahead. There is currently a head and shoulders pattern forming which has given us high confidence that it will head to the upside. BUY NOW!

ETHUSD pivotal resistance at 3,960The ETHUSD remains in a neutral trend, with recent price action indicating a corrective pullback within the broader trading range.
Support Zone: 3,600 – a key level from previous consolidation. Price is currently testing or approaching this level.
A bullish rebound from 3,600 would confirm ongoing upside momentum, with potential targets at:
3,960 – initial resistance
4,077 – psychological and structural level
4,190 – extended resistance on the longer-term chart
Bearish Scenario:
A confirmed break and daily close below 3,600 would weaken the bullish outlook and suggest deeper downside risk toward:
3,520 – minor support
3,440 – stronger support and potential demand zone
Outlook:
Bullish bias remains intact while the ETHUSD holds above 3,831 A sustained break below this level could shift momentum to the downside in the short term.
This communication is for informational purposes only and should not be viewed as any form of recommendation as to a particular course of action or as investment advice. It is not intended as an offer or solicitation for the purchase or sale of any financial instrument or as an official confirmation of any transaction. Opinions, estimates and assumptions expressed herein are made as of the date of this communication and are subject to change without notice. This communication has been prepared based upon information, including market prices, data and other information, believed to be reliable; however, Trade Nation does not warrant its completeness or accuracy. All market prices and market data contained in or attached to this communication are indicative and subject to change without notice.

ETH: Head and Shoulders Pattern Targets $3,800Hi Teams!
Ethereum has recently completed a head and shoulders formation. The neckline around $3,920 was broken decisively, confirming the pattern and triggering further downside momentum.
After the breakdown, the price slipped toward the lower boundary of the descending channel, finding temporary support near $3,860. A short-term corrective move is now unfolding, with ETH likely to retest the neckline zone and the upper boundary of the channel before facing renewed selling pressure.
As long as Ethereum trades below $3,920–$3,940, the bearish structure remains valid. A rejection from this area could accelerate the decline toward the target of the head and shoulders pattern, which aligns with the $3,800–$3,820 support zone.
However, a clear breakout above the descending trendline would invalidate this bearish outlook and could open the way for a recovery toward the $4,000–$4,050 resistance area.
Levels to Watch:
Resistance: $3,920 – $3,940 / $4,000 – $4,050
Support: $3,860 / $3,800 – $3,820
Bearish Target: Around $3,800 zone
Outlook: Bearish while below $3,920.

ETHEREUM bullish signEthereum broke the long-term resistance line a few months ago and is backtesting it. Is this the time to go parabolic and reach the $14,000 target?

Could we see a bullish reversal?Ethereum (ETH/USD) has bounced off the pivot and could rise to the 1st resistance.
Pivot: 3,938.14
1st Support: 3,694.19
1sst Resistance: 4,279.64
Disclaimer:
The above opinions given constitute general market commentary, and do not constitute the opinion or advice of IC Markets or any form of personal or investment advice.
Any opinions, news, research, analyses, prices, other information, or links to third-party sites contained on this website are provided on an "as-is" basis, are intended only to be informative, is not an advice nor a recommendation, nor research, or a record of our trading prices, or an offer of, or solicitation for a transaction in any financial instrument and thus should not be treated as such. The information provided does not involve any specific investment objectives, financial situation and needs of any specific person who may receive it. Please be aware, that past performance is not a reliable indicator of future performance and/or results. Past Performance or Forward-looking scenarios based upon the reasonable beliefs of the third-party provider are not a guarantee of future performance. Actual results may differ materially from those anticipated in forward-looking or past performance statements. IC Markets makes no representation or warranty and assumes no liability as to the accuracy or completeness of the information provided, nor any loss arising from any investment based on a recommendation, forecast or any information supplied by any third-party.

Ethereum — Losing the PremiumThe Ethereum future’s chart is showing weakness, and I’m expecting a drop toward the $3,760 area from current levels.
Scenario invalidation — the zone is marked on the chart at $4,041

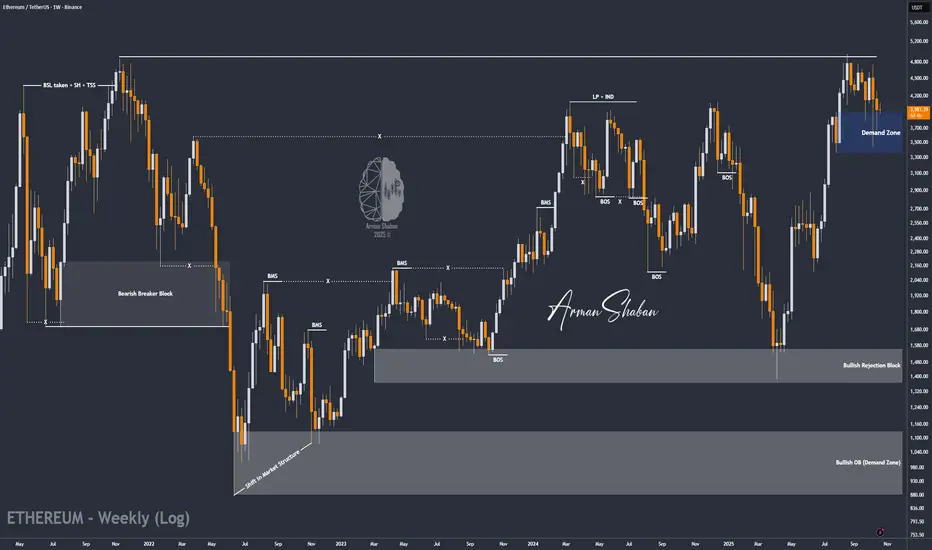
ETH/USDT | ETH Update – Waiting for Confirmation Above $4K!By analyzing the #Ethereum chart on the weekly timeframe, we can see that price has been consolidating around the $4,000 level after a sharp recovery from the $3,400 demand zone. This sideways movement shows ongoing accumulation, but a clear breakout and close above $4,000 is still needed to confirm renewed bullish momentum.
As long as ETH holds above the $3,900–$4,000 support range, the broader bullish outlook remains valid. The next upside targets are $4,950, $5,500, and $6,000 , but continuation strongly depends on Bitcoin’s ability to stay above $112K .
In short — ETH is gearing up for its next move, but the key lies in a confirmed breakout above $4K with BTC providing stability.
Please support me with your likes and comments to motivate me to share more analysis with you and share your opinion about the possible trend of this chart with me !
Best Regards , Arman Shaban
LTC/USDT | LTC Update – Bulls Back in Control!By analyzing the #Litecoin (LTC) chart on the weekly timeframe, we can see that after testing the $76–$88 demand zone, LTC has continued its recovery and recently climbed to around $94.5 , showing that buyers are still defending key levels strongly.
The overall structure remains bullish — as long as the price holds above $88, the outlook stays positive. The next upside targets remain $100, $114, and $120, where short-term resistance could appear before the next breakout attempt.
This steady recovery once again confirms Litecoin’s technical strength and the reliability of its long-term demand zone. If momentum holds, we could soon see another strong push toward the $100 mark and beyond.
Please support me with your likes and comments to motivate me to share more analysis with you and share your opinion about the possible trend of this chart with me !
Best Regards , Arman Shaban
