My plan is ETH.Here are my thoughts on ETH. I'm maintaining my position from the previous review. You can check it out in my profile. My TVH is very good at 2,950+.
However, I'm still a little confused by the 4-hour RSI. For now, though, I'm ignoring it.
Think for yourself. I don't rule out price swings before or during the Fed meeting.
Good luck and profits to all!
Ethereum (Cryptocurrency)

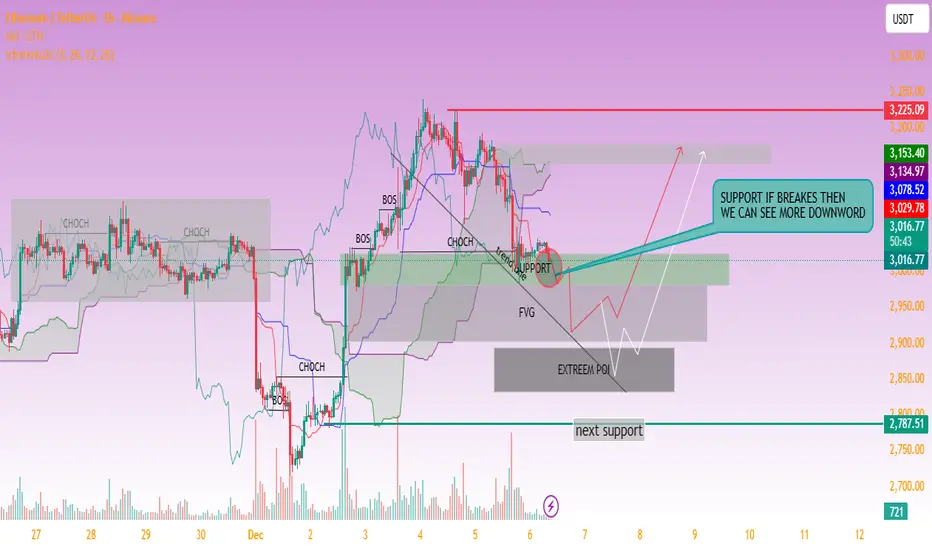
ETH 1H Outlook: Key Support Retest With Potential Downside RiskKey observations:
1. Support Level Under Pressure
ETH is retesting this support multiple times.
The annotation suggests: “SUPPORT IF BREAKS THEN WE CAN SEE MORE DOWNWORD” — meaning a breakdown could trigger further selling.
2. Downside Targets
If the current support fails, the next liquidity zones highlighted are:
FVG (Fair Value Gap) around $2,950–$2,900
Extreme POI zone around $2,880–$2,850
Major support at $2,787 (marked as “next support”).
3. Upside Scenario
If support holds, ETH could bounce toward:
$3,078
$3,134
High resistance around $3,225
4. Market Structure
Several CHoCH and BOS labels indicate mixed structure, showing recent weakness but with potential for rebound if buyers defend support strongly.
ETHUSD Oversold bounceback resistance retestThe ETHUSD pair continues to display a bearish outlook, in line with the prevailing downward trend. Recent price action suggests a corrective pullback, potentially setting up for another move lower if resistance holds.
Key Level: 3,246
This zone, previously a consolidation area, now acts as a significant resistance level.
A failed test and rejection at 3,246 would likely resume the bearish momentum.
Downside targets include:
2,860 – Initial support
2,777 – Intermediate support
2,670 – Longer-term support level
Bullish Scenario (breakout above 3,246):
A confirmed breakout and daily close above 3,246 would invalidate the bearish setup.
In that case, potential upside resistance levels are:
3,350 – First resistance
3,460 – Further upside target
Conclusion
ETHUSD remains under bearish pressure, with the 3,246 level acting as a key inflection point. As long as price remains below this level, the bias favours further downside. Traders should watch for price confirmation around that level to assess the next move.
This communication is for informational purposes only and should not be viewed as any form of recommendation as to a particular course of action or as investment advice. It is not intended as an offer or solicitation for the purchase or sale of any financial instrument or as an official confirmation of any transaction. Opinions, estimates and assumptions expressed herein are made as of the date of this communication and are subject to change without notice. This communication has been prepared based upon information, including market prices, data and other information, believed to be reliable; however, Trade Nation does not warrant its completeness or accuracy. All market prices and market data contained in or attached to this communication are indicative and subject to change without notice.

ETHUSDT Trade Plan (December 8, 2025)ETH Trade Plan (December 8, 2025)
(D1 / H4 / H1 / M15)
⬛️ 1. Higher Timeframe Context (D1 and H4)
• D1 bias: neutral (bullish reversal attempt)
• D1 range (approx): $2,800 – $3,762
• Key D1 zones:
• Supply: $3,350–$3,762 (previous breakdown + OB cluster)
• Demand: $2,800–$3,050
• H4 bias: buy dips
• H4 zones of interest:
• H4 Sell Zone 1: – previous rejection cluster (decaying)
• H4 Buy Zone 1: – OB + HVN + weekend absorption
All active setups are trend-aligned with emerging H4/D1 bullish structure.
⬛️ 2. Preferred Setups by Horizon
🔳 2.1 Swing Setup (D1/H4)
• Idea: Long dips into $3,100–$3,150 for retest $3,500+ (post-Fusaka accumulation).
• Time horizon: multi-day.
🔲 2.2 Intraday Setup (H1 focus)
• Idea: Long reclaim/break $3,150–$3,190 zone.
• Time horizon: today / overnight.
▫️ 2.3 Scalp Setup (M15 focus)
• Idea: Dip-buy $3,100–$3,110 with absorption or breakout >$3,140.
• Time horizon: minutes–hours.
▪️ 2.4 Arbitrage/Pairs Concept
• Long ETH/BTC ratio – defending key support, mean-reversion bias up.
🟩 3. Entry Zones and Triggers
Main Long Setup (Trend-Aligned)
• Execution timeframe: H1
• Trigger timeframe: M15/M5
• Entry zone:
• Context: H4 demand + weekend sweep reclaim + institutional spot buying
• Pattern tags:
Trigger conditions:
• Price holds $3,100 bid cluster + M15 bullish structure (higher low + volume delta buy)
• CVD positive or diverging bullish
• ML-Predictive 15m upside prob ≥0.65
• No aggressive ask walls rebuilding
🔴 4. Stops (Invalidation Levels)
Long setups:
• Stop: $3,045 (below weekend low + H4 demand)
• Logic: Structural failure, CHoCH down confirmed.
🟢 5. Targets
Long:
• TP1: $3,190 – local supply + FVG fill (H1/H4)
• TP2: $3,350 – supply retest + LVN void (H4/D1)
• TP3 (swing): $3,600+ – next HVN + extension (D1)
⬛️ 6. Position Sizing
• Baseline risk trend-aligned: 1.0%
• Adjustments: −0.2× (put skew + weekend tail) +0.1× (strong absorption + news)
• Effective risk: 0.9% main long, max 0.4% aggressive scalps
⬛️ 7. Risk Flags
• Persistent put skew → vol expansion downside risk
• Weekend liquidity memory (potential gap lower Asia)
• High OI + neutral funding → crowded long risk if macro flips
• Death cross D1 still active (macro timeframe bearish pressure)
⬛️ 8. Flip Conditions
Bull → bear flip: H4 close < $3,050 + CVD strongly negative + funding negative.
⬛️ 9. Alternative Scenario
Fakeout above $3,190 → sharp rejection (spoofing + gamma) → trap longs → drop to $2,950–$3,000 (next demand + round number). Requires delta selling + macro risk-off trigger.
⬛️ 10. Model Self-Critique
• Main assumptions: Fusaka narrative sustains buying, institutional accumulation continues, no macro shock.
• Vulnerabilities: put skew buyers re-assert, whale distribution at supply, weekend gap lower, misread absorption.
• Do NOT chase extended above $3,200 without volume. Do NOT hold through Asia low liquidity without tight stops.
⬛️ 11. Uncertainty and Constraints
Uncertainty: medium
Constraints: require M15 confirmation + positive delta, no entries above $3,200, reduce size into NY close if no volume.

Perfect Execution - Waiting for Confirmation Saves AccounsKey levels attract attention, but attention alone rarely produces good trades. A level gains meaning only when price shows how it behaves around it. Many traders understand where important levels are, yet still lose money because they enter too early, assume a breakout will continue, or anticipate a reversal before the market confirms it.
Patience at these levels is what separates disciplined execution from unnecessary losses.
A key level acts like a pressure point. Liquidity gathers above highs, below lows, and around clear support or resistance.
When price approaches these zones, it does not move cleanly. It probes, sweeps, hesitates, or accelerates depending on who holds control. Entering at the first touch is often an emotional decision disguised as confidence. Entering after confirmation is a structured decision grounded in evidence.
Confirmation begins with a reaction. A legitimate bounce or rejection has intent behind it. You will see displacement, cleaner momentum, or a defined shift in micro-structure. A candle wick alone is not confirmation.
A single green or red candle is not confirmation. Confirmation comes when the market shows that a level is respected or rejected with conviction, as several conditions align.
One of the clearest signs of confirmation is the break of micro-structure after the level is touched. If price sweeps a low and then breaks a minor high, the narrative changes. The same applies to resistance: a sweep followed by a failed attempt to push lower is evidence of buyers stepping in.
This structural shift shows that the reaction is more than a random bounce.
Another layer of confirmation is the retest. Strong moves often return to the level they broke to validate participation.
Traders who enter before this retest expose themselves to unnecessary volatility. Traders who wait allow the market to prove that the move is real, not a trap.
The retest reduces risk naturally and improves the reward-to-risk ratio without changing the strategy itself.
Patience does not slow you down. It filters out trades that look attractive but lack substance. Key levels attract liquidity, manipulation, and emotional behaviour.
Waiting for confirmation keeps you grounded when the market is trying to provoke a reaction. It prevents you from turning strong levels into weak trades through premature entries.
The goal is not to catch the exact top or bottom of a move. The goal is to participate in moves that show clear strength and clear intent.
When you treat key levels as decision points rather than entry signals, your trading becomes structured, disciplined, and far more consistent. Patience is not passive. It is an active skill that protects your account and elevates your execution.

Emotional Patterns: What Your Trades Reveal About YouTrading feels technical on the surface, yet the deeper layer is psychological. Charts highlight opportunities, but the way you behave inside those opportunities shapes the outcome. Each trade reflects how you respond to pressure, uncertainty, and risk. Over time, these reactions create emotional patterns that influence results more than strategy.
One early pattern appears after a loss. A losing trade often triggers frustration, and that frustration pushes traders into fast entries aimed at regaining control. The decision becomes driven by emotion rather than process, and this behaviour can quickly lead to a cycle of overtrading.
Winning streaks create a different pattern. Confidence expands, and many traders begin increasing size, loosening rules, or entering before confirmation because recent success feels reassuring. This overextension usually leads to sharp setbacks when the market shifts.
Another frequent pattern is hesitation. Traders with inconsistent execution tend to freeze at key moments. They wait for additional confirmation, delay entries, or watch clean setups move without them. The pause often comes from the memory of previous mistakes rather than a lack of technical understanding.
Entries reflect trust in the system. Exits reflect trust in personal decision-making. Closing a trade too early often shows discomfort with open profit. Holding a losing trade too long often comes from discomfort with accepting a loss. These behaviours reveal the trader’s relationship with risk far more clearly than any written reflection. The chart becomes a mirror.
Recognising emotional patterns provides clarity. When recurring behaviours appear—chasing, hesitating, forcing trades, avoiding losses—they become easier to interrupt. Once a pattern is visible, it starts losing influence.
Structure then supports the change: rules, checklists, routines, and clear confirmation criteria. These elements stabilise execution and reduce the impact of emotional impulses.
A strategy defines potential entries, but emotional patterns determine whether the trader can execute consistently enough to benefit from it. Awareness strengthens decision-making. When you understand what your trades reveal about your behaviour, you can adjust it and bring execution closer to intention.
This is where consistency begins.

ETHEREUM is about to EXPLODEEthereum is doing similar thing it did in April 2025 :
- Falling channel
- Breaking resistance
- Rise again
I think the only one Liking my post is me!The price on the 4h timeframe is within an ascending triangle, which can be promising. If the price breaks this pattern with bullish candles, it could easily rise by the distance of AB=CD.

Bitcoin Dominance / BEARISH ! 💥 BITCOIN DOMINANCE (BTC.D)
**Chart:** Weekly (1W)
This weekly BTC.D chart clearly outlines the **major cycles** that have shaped the market structure from 2017 to the present. Specifically, the **35% and 39%** levels are **critically important** for cycle bottoms.
🎯 History Repeats Itself: Major Cycle Peaks and Drops
The chart illustrates how Bitcoin Dominance (BTC.D) has dropped from massive peaks, and how these drops have opened the door to **Altcoin Seasons**:
1. **2017 Mega Bull Peak (95% $\rightarrow$ 35%):**
* The first major rally pushed Dominance to **95%**. This was a period where the market was almost entirely focused on Bitcoin.
* As the market matured and Altcoins gained popularity, BTC.D rapidly fell to **35%**. This drop coincided with the largest **"Altcoin Season"** in history. The **35%** level is the **lowest support** point we have seen so far.
2. **2021 Bull Peak Recurrence (72% $\rightarrow$ 39%):**
* In the 2020-2021 rally, the Dominance peak remained around **72%**, indicating a more balanced market compared to 2017.
* The subsequent drop brought Dominance to the **39%** level, setting the stage for the big Altcoin rally of 2021. **39%** serves as the most important **secondary support/major bottom** since 2018.
📈 Current Situation: Searching for the New Cycle Peak
We can observe that since the beginning of 2023, we have been within a rising channel:
* **Ascending Trend Support:** Since early 2023, Dominance has been moving above the **ascending trend line** shown with the dashed line. This confirms that a major Altcoin rotation has not yet begun, and Bitcoin still dominates the market.
* **Recent Peak (66%):** In early 2025, Dominance made a local peak around **66%**. This peak is below the previous 72% peak, a trend that suggests Altcoins' share of the total market is **increasing** with each cycle.
* **In-Channel Correction:** Dominance has currently entered a corrective move from the **66%** peak and is pulling back towards the ascending trend line.
The large orange arrow on the chart points to a **strong expectation** for the upcoming period.
1. The Altcoin Season (Expected and Main Scenario):
The large orange arrows indicate that Dominance is expected to head towards the critical support levels with a **sharp drop**. If the current correction continues and Dominance breaks below the ascending trend line, the target will likely be:
First Critical Support:** The **39%** level. This level is the 2021-2022 cycle bottom and is -strong psychological support.
Ultimate Target (Mega Altcoin Season):** The **35%** level. If the market experiences an Altcoin frenzy similar to 2017, this lowest level may be retested or slightly undercut.
> **TECHNICAL CONCLUSION:** The **66%** peak could be the Dominance peak for the 2025/2026 cycle. A drop initiating from here will trigger a **historic Altcoin Season**.
🔥 FINAL VERDICT: The Cryptollica Move
This pullback in Dominance from **66%** suggests that **we must turn our attention to ALTCOINS**. Technically, the moment Dominance breaks this trend line, the **rotation of large capital from Bitcoin to Altcoins** will begin, and the targets in the **39% - 35%** range will be activated.
> **Trader's Note:** We are entering a period where it makes sense to **increase risk appetite** and **take positions in the Altcoin portfolio**. A Dominance drop will cause Altcoins to *surge* on their CRYPTOCAP:BTC $ pair, even if the CRYPTOCAP:BTC $ price remains stable.
That's an excellent move! Combining the bearish Bitcoin Dominance (BTC.D) scenario with the **ETH/BTC** parity chart allows us to understand the Altcoin Season expectation and where capital is most likely to flow.
---
👑 The Role of the ETH/BTC Parity: The Leadership Indicator
Historically, when Bitcoin Dominance begins to fall, **Ethereum (ETH)** takes the lead in the market capital flow and pulls other Altcoins along with it.
1. Historical Correlation:
* **When BTC.D Peaks:** The ETH/BTC parity usually **bottoms out** or consolidates within a strong support zone. This is the moment when capital first flows into BTC and reaches saturation.
* **When BTC.D Starts to Drop:** The ETH/BTC parity begins a **powerful rally**. This is the official start of the Altcoin Season, where capital spreads from BTC, first to ETH, and then to other Altcoins.
2. Current ETH/BTC Expectation:
If BTC.D enters a **downtrend** from 66%, the expected move in the ETH/BTC parity is as follows:
Strong Bottom Confirmation:The parity must execute an **upward breakout** from a long-term consolidation or bottom level (likely the $0.05$ - $0.06$ BTC range).
Bullish Signal: A breakout of a significant resistance level in ETH/BTC (e.g., $0.07$ or $0.08$ BTC), simultaneously with the BTC.D trend line break, will be the **strongest technical signal that the Altcoin Season has officially begun.
Targets: The initial targets for the ETH/BTC parity could be the 2021 peaks at the $0.08$ - $0.09$ BTC levels, with the ultimate target being the 2017 peaks above $0.1$ BTC.
By combining these two charts, the strategy aiming for the **highest return** is:
| Condition per Chart | Market Impact | Action (Trader Decision) |
| **BTC.D** **Breaks Below** the Ascending Trend (pprox %55) | Capital outflow from Bitcoin begins. | Start **Main Altcoin Accumulation**. |
| **ETH/BTC** **Breaks Above** the Main Resistance ($\approx 0.07-0.08$ BTC) | Altcoin rally leader is confirmed. | Increase **ETH positions** and complete **other Altcoin purchases**. |
| **BTC.D** reaches %39 or %35 | The Altcoin market has reached saturation. | **Take Profit** and shift to an exit strategy. |
---
**In Summary:** The drop in BTC.D confirms the existence of an **Altcoin Season**, while the **rise in the ETH/BTC parity** will confirm the strength of this season and **Ethereum's leadership**.
By following this dual signal, we can capture the flow of capital within the market in the most efficient way.

The Market Awaits the Fed to Set the TrendHi everyone, Domic here again.
On the chart, ETH is still holding its short-term uptrend as the 34 EMA (red) remains above the 89 EMA (blue), but the bullish momentum has clearly slowed down. Price is hovering just above both EMAs without forming any widening angle, while the EMAs themselves are being squeezed — a classic signal that the market is losing momentum, moving sideways, and waiting for new catalysts. The declining volume further confirms that buying pressure is no longer strong enough to push ETH decisively toward the 3,150–3,200 zone. This explains why, despite the uptrend remaining intact, ETH is “waiting” rather than accelerating.
On the news side, ETH is directly influenced by upcoming macro events:
The Fed meeting on December 9–10 is the key driver, and crypto markets typically go quiet ahead of such events to await direction.
Meanwhile, the DXY is weak and moving below the 100 level, but volatility is low — not enough to trigger a strong risk-on wave across crypto.
At the same time, speculation around a potential Ethereum spot ETF continues, but without any confirmation from the SEC, expectations exist — yet large capital remains cautious.
Based on these factors, I expect ETH to continue consolidating or potentially pull back to retest the 3,060–3,080 zone before showing a clearer reaction after the Fed meeting.

ETH Pauses as Market Awaits Fed SignalETH on the H4 timeframe is moving sideways between 3,080–3,130 after a strong rebound from 2,750–2,800, signaling a shift into consolidation rather than continuation. The current zone overlaps a previous high-volume distribution area, while a flat Ichimoku cloud reflects indecision. Price hasn’t broken past the last high, and the lower FVG at 2,980–3,050 may still attract a retest. A clean breakout above 3,150–3,200 is needed to confirm upside momentum; until then, ETH remains in wait-and-see mode ahead of the Fed.

ETH 4H – EMA Rejection at FVG Zone, Watching HTF LiquidityETH is reacting precisely at the confluence of the 50/100 EMAs and the 0.5–0.618 retracement zone, where prior inefficiency from the last breakdown remains unmitigated. Price tapped into the upper portion of the FVG/imbalance region before showing signs of exhaustion, producing a clear rejection cluster around the EMA cross.
This region carries strong structural significance: it’s the origin of the last major displacement down, and it has not been fully rebalanced. Market structure on the 4H remains neutral-to-bearish while price trades below both EMAs, and each touch into the imbalance zone has generated a reaction. Until ETH can reclaim and close above the 0.618, this zone remains a high-probability distribution area.
The circled area illustrates a classic interaction: liquidity-driven push into resistance, loss of momentum, and a rejection back toward mid-structure. If price confirms a break of the rising intraday trendline, continuation toward the liquidity shelf at 2,625 becomes the next logical draw. This level acted as a major accumulation pivot earlier in the trend and represents meaningful resting liquidity.
Stoch RSI is curling down from elevated levels, adding confluence to the idea of a short-term corrective phase unless ETH reclaims the EMAs decisively.
At this stage, ETH sits between inefficiency above and liquidity below, forming a clean HTF decision zone. Reclaiming the imbalance would shift structure upward; losing the diagonal base would re-open the path to deeper liquidity.

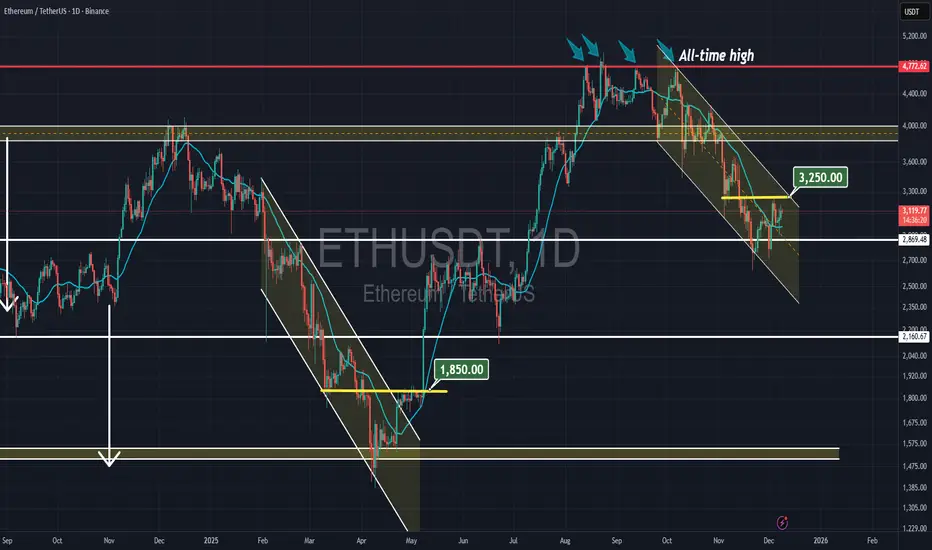
ETHUSD 1D chart1️⃣ Trend and key levels
Trend
• The overall neutral-growth trend, but with clear consolidation.
• The price rebounded dynamically from the bottom (approx. USD 2,850), which creates the first higher low structure → the potential beginning of an upward impulse.
Support
• $2,973-$3,000 – SMA #1 + local support.
• USD 2,851 – strong support from which the candle made a very large wick upwards.
Resistances
• USD 3,169 – the first strong resistance, several candles bounced from this level.
• $3,236 – key daily resistance. Breakout = signal of strong momentum and opening the way to USD 3,300-3,430.
⸻
2️⃣ Candle formation and behavior
• A bullish candle with a long lower wick appeared → this is a signal of buyers.
• The price is making a series of higher lows, but no higher high yet → the market is waiting for a breakout of USD 3,236 to confirm the uptrend.
⸻
3️⃣ SMA (moving averages)
🔴 SMA #1 (short-term)
• Price is just above it → acts as support.
• If the daily candle closes below $3,000, the downside momentum returns.
🟢 SMA #2 (long term, ~$3,430)
• Is high above the price → long-term bearish pressure until the price returns to the price area.
⸻
4️⃣ RSI (momentum)
RSI around 45–50
• Neutral territory.
• Zero overbought/oversold.
• Slight upward trend in RSI → buyer momentum is growing, but without an overheating signal.
Conclusion: The market has room to move higher before the RSI becomes high.
⸻
5️⃣ MACD
• MACD is above the signal line → slight, early bullish signal.
• The histogram increases, but there is no significant acceleration.
Interpretation: increases are possible, but without strong momentum yet.

BTC at Risk: Structure Break + RSI Warning$BTC/USDT is showing some concern on the monthly chart as price has broken below the rising wedge and is now retesting a major demand zone. Losing this zone could trigger a deeper correction.
At the same time, RSI is showing a clear multi-year bearish divergence, highlighting weakening momentum.
Until BTC reclaims the wedge support or closes back above the resistance band, downside risk remains elevated.
DYOR, NFA
Please hit the like button if you like it, and share your views in the comments section.

ETH Weekly FVG Filled – Final Shoulder Before 21K?On the ETH/USDT weekly chart, price has just tapped and respected the Fair Value Gap (FVG) demand zone around the 2.6–2.8K area, filling it almost perfectly.
This zone lines up with key Fibonacci retracements of the previous impulse and could be forming the right shoulder of a large inverse Head & Shoulders pattern:
Left shoulder: ~3.6–3.7K
Head: ~1.3–1.4K
Potential right shoulder: current 2.6–2.8K region (FVG fill)
Neckline: ~4.9–5.0K
If bulls defend this weekly FVG and ETH manages a sustained move back above 3K, the next logical step would be a test of the 5K neckline.
A clean weekly breakout and close above the neckline would confirm the pattern and open the door for a much larger measured move – which points toward the 20–21K region in the long term.
Invalidation / risk:
A weekly close back below the FVG and mid-range (~2.4–2.5K) would weaken the right-shoulder idea.
A deeper breakdown below 2K would put the entire structure at risk.
Watching how price reacts inside this FVG zone over the next few weeks. Is this just another bounce, or the birth of the final shoulder before a parabolic phase? 🤔
Not financial advice – just a chart idea, do your own research and manage your risk.

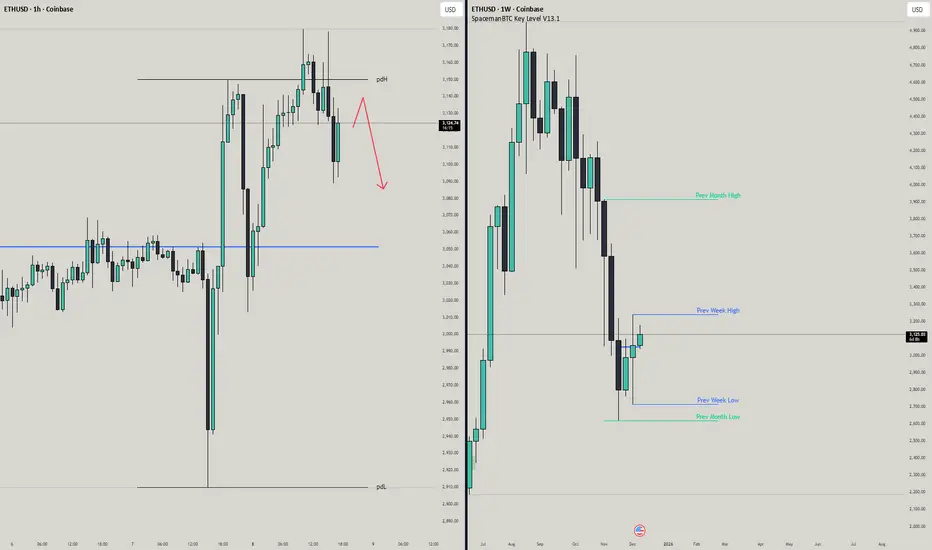
ETHUSD | RejectedEthereum showed a big rejection from the previous day high, same with bitcoin.
Will be looking for a retest of this level before going into any short positions.
When this retest happens I will be looking for a 15-30 minute candle close under the PDH.
Will be very careful entering though, daily chart is starting to look funky, with the weekly showing 2 green candles as well.
There certainly has been some bullish momentum that came in the last few days.
Let me know what your analysis is!
Stay safe out there and do your own due diligence, this is not investment advise!
ETH/USDT Bullish Reversal SetupETH/USDT Bullish Reversal Setup
The chart shows a clear transition in ETH as price moves from a prolonged distribution-driven decline into a developing accumulation range. After weeks of consistent bearish structure, the market finally printed multiple upside shifts, signaling that sell-side pressure is weakening and liquidity behavior is changing.
The recent impulsive rally out of the discounted range confirms that buyers are actively defending lower levels. Price is now pulling back toward a short-term demand pocket formed during the breakout. This area represents the first meaningful accumulation zone after the market broke a series of internal swing points.
As long as price maintains stability within this demand block, the structure favors continuation toward the next major liquidity cluster above. The next upside draw is positioned around the 3,440–3,500 region, where previous inefficiencies and unmitigated zones converge. That region also holds resting buy-side liquidity, making it the logical target for a future expansion move.
The current market behavior suggests that ETH is in the early phase of a bullish repricing cycle. A controlled pullback into the highlighted zone—followed by a reaction—would confirm continuation and attract momentum buyers aiming for the higher liquidity magnet.
Overall, this chart reflects a shift in narrative: sellers are losing dominance, the market is building a fresh bullish structure, and the path of least resistance is gradually tilting upward as long as the demand zone remains protected.

Ethereum (ETHUSD) – Momentum Shift in Progress?thereum just staged a strong rebound, signaling a potential momentum shift after months of bearish pressure.
🔄 Trend Development
After a sharp drop early last week, ETH quickly reversed and printed a higher low — a key early sign of bullish intent.
Shortly after, ETH broke above the previous week's high, marking the first higher-high and higher-low structure in months. While this happened in a tight time frame, it's a meaningful development from a price action perspective.
📉 Support & 📈 Resistance Levels
Support held strong in the $2,600 – $2,800 range
Immediate resistance now sits at $3,300
A breakout above $3,300 could trigger a move toward the upper boundary of the descending channel
However, we can't give the "all clear" just yet. A weekly close above $4,000 – $4,200 would be needed to confirm a full trend reversal and bullish continuation.

Monthly Analysis:Ethereum (ETH), Issue 280 The analyst expects Ethereum’s price to decline by the specified end time (countdown timer), based on quantitative analysis.
The take-profit level simply represents a potential price range during this period — it’s optional and not a guarantee that the price will reach it.
You don’t need to go all-in or use leverage to trade wisely.
Allocating only a portion of your capital helps keep overall risk low.
Our approach follows institutional portfolio management principles — not the “all-in or blow-up” style often promoted on social media.
Performance is evaluated over the entire time window, regardless of whether the take-profit level is hit.
The validity of this analysis is based on a specific time range (until 04 Jan 2025), and after this period, the analysis will be reviewed and updated (once every 28 days).
Monthly Analysis:Ethereum (ETH), Issue 280

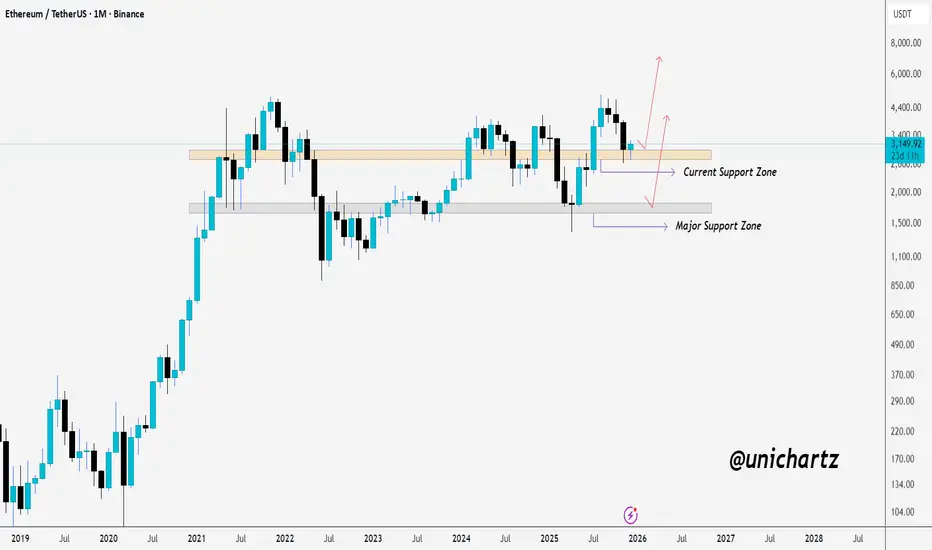
ETH Monthly Structure Intact Above SupportCRYPTOCAP:ETH is holding its monthly support zone once again, showing buyers are still defending this level.
As long as the price stays above this area, the structure favors a bounce toward the upper range.
A breakdown, however, would shift focus to the major support zone below.
DYOR, NFA
Altcoins are loading. BTC Dominance is in a downward retest following the recent breakout.
ETH/BTC confirmed its upward breakout.
The apparent silence is actually the sound of an impending power shift.
CRYPTOCAP:BTC.D vs. BINANCE:ETHBTC

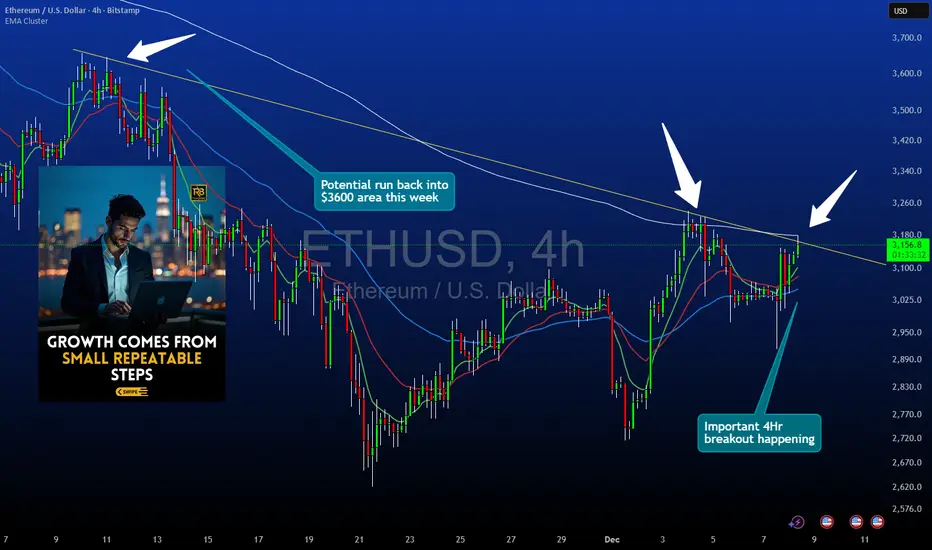
Ethereum 4HR Structure UpdateThis idea focuses on Ethereum on the 4 hour chart.
Price is approaching a descending trendline that has acted as dynamic resistance. A break and confirmed close above this trendline is required before considering any long setups.
Key Levels and Structure
• Primary focus is the descending trendline that has capped every recent bounce
• A full candle close above the trendline is essential before any entry is planned
• The upside reference area for this idea is near 3600 where prior reactions occurred
• Invalidations sit below 2950 which would represent a break beneath the recent structural base
Entry Logic
This setup is based on confirmation rather than anticipation.
• No entries should be taken while price remains under the trendline
• A strong bullish close outside the trendline is needed
• Weak closes or wicks through the trendline without body confirmation do not qualify
• The idea is only valid once the trendline is clearly violated on a closing basis
Why the Close Matters
Closing outside the trendline shows that market participants have accepted price above the descending structure rather than briefly testing it. This helps filter false breaks and reduces reliance on intrabar volatility.
Risk Parameters
Stops would be referenced below 2950 since a move under that area would indicate failure to hold recent structural support. The 3600 region is used as the first upside reference point based on previous reactions on the 4 hour chart.
Notes
This idea evaluates structural behavior and does not forecast future performance. Users should confirm levels and apply their own risk management plan before taking any trade.
#ETH/USDT (1h) (spot)#ETH
The price is moving in a descending channel on the 1-hour timeframe. It has reached the lower boundary and is heading towards a breakout, with a retest of the upper boundary expected.
We are seeing a bearish trend in the Relative Strength Index (RSI), which has reached near the lower boundary, and an upward bounce is expected.
There is a key support zone in green at 2970, and the price has bounced from this level several times. Another bounce is expected.
We are seeing a trend towards stabilizing above the 100-period moving average, which we are approaching, supporting the upward trend.
Entry Price: 30019
First Target: 3058
Second Target: 3124
Third Target: 3202
Remember a simple principle: Money Management.
Place your stop-loss order below the green support zone.
For any questions, please leave a comment.
Thank you.
