BCH Approaching Breakout Point in ChannelSET:BCH is trading inside a strong rising channel. Price has been respecting this channel for months, with each dip finding support near the lower boundary and each rally stalling at the upper band.
Right now, BCH is hovering around a minor resistance zone. If buyers manage to push through this level, we could see another leg higher toward the upper channel.
In simple terms: the trend is still bullish as long as BCH stays inside this rising channel.
DYOR, NFA
#PEACE
Ethereum (Cryptocurrency)

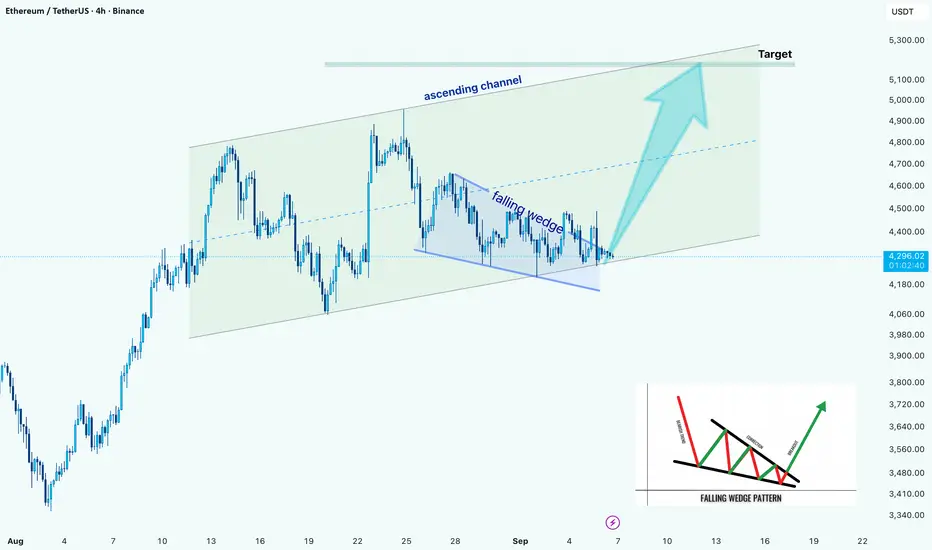
ETH/USD –> Falling Wedge Breakout Within Ascending ChannelHello guys!
Ethereum is showing a strong technical setup on the 4H chart. Price has been respecting an ascending channel since early August, and within this structure, a falling wedge has recently formed.
Right now, ETH is testing the wedge breakout point near the bottom line of the channel. If buyers manage to hold momentum here, we could see price extending toward the channel’s upper boundary, with the next major target sitting around $5,100 – $5,300.
On the downside, failure to sustain above the wedge support may lead to a retest of the lower channel trendline around $4,100 – $4,150, which remains a critical support area for bulls to defend.
Ethereum Trade Setup - Sep 12th📲 NFX Trade Alert – Swing Setup
💹 Instrument: BINANCE:ETHUSD Ethereum (ETHUSD.r)
🛒 Trade Type: Swing – Buy at Market
📍 Entry: $4,540
⛔ Stop Loss: $4,450
✅ Target Profit: $4,950
📊 Trade Setup Analysis – Ethereum
Ethereum has finally broken through the $4,500 block order, which is now acting as solid support after multiple rejections on both the H1 and H4 timeframes.
With this breakout confirmed, price has no significant resistance until $4,650 (minor) and $4,850 (major). This opens the path for higher prices in the near term.
⚖️ As always, manage risk carefully — even a high-probability setup requires discipline and protection.💚

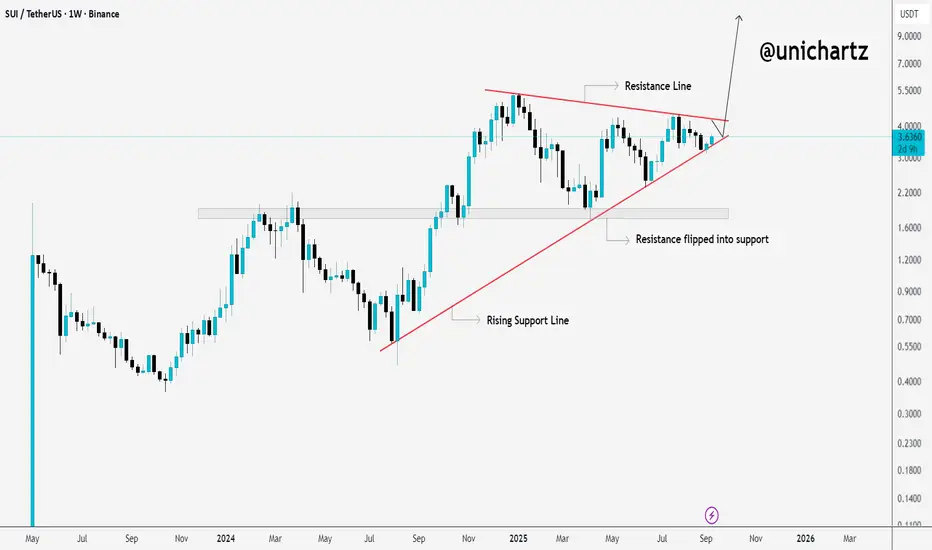
SUI at a Crossroads: Next Move Could Be HugeCRYPTOCAP:SUI has been moving inside a big triangle pattern, with rising support holding the lows and strong resistance capping the highs. Notice how the old resistance around $1.60 has already flipped into support, a healthy sign showing buyers are still in control.
Right now, SUI is sitting at the apex of the triangle. A breakout above resistance could open the door for a sharp move higher, while losing that rising support would mean buyers need to regroup at lower levels.
In simple terms: the squeeze is on, and whichever side breaks, momentum will likely follow fast.
DYOR, NFA
Stay updated everyday follow us on TradingView
#PEACE
ETH/USDT | Ethereum Eyes $5,100, $5,500 & $6,000 – New ATH AheadBy analyzing the Ethereum chart on the weekly timeframe, we can see that the price is still trading around $4,400. If it holds above the $3,900 level, I expect a strong bullish wave toward new targets and fresh all-time highs.
Given the current momentum, this bullish move could start soon, with possible targets at $5,100, $5,500, and $6,000.
Please support me with your likes and comments to motivate me to share more analysis with you and share your opinion about the possible trend of this chart with me !
Best Regards , Arman Shaban

ETHUSD bullish sideways consolidation supported at 4,100The ETHUSD remains in a bullish trend, with recent price action showing signs of a corrective pullback within the broader uptrend.
Support Zone: 4,100 – a key level from previous consolidation. Price is currently testing or approaching this level.
A bullish rebound from 4,100 would confirm ongoing upside momentum, with potential targets at:
4,450 – initial resistance
4,730 – psychological and structural level
5,070 – extended resistance on the longer-term chart
Bearish Scenario:
A confirmed break and daily close below 4,100 would weaken the bullish outlook and suggest deeper downside risk toward:
3,990 – minor support
3,830 – stronger support and potential demand zone
Outlook:
Bullish bias remains intact while the ETHUSD holds above 4,100. A sustained break below this level could shift momentum to the downside in the short term.
This communication is for informational purposes only and should not be viewed as any form of recommendation as to a particular course of action or as investment advice. It is not intended as an offer or solicitation for the purchase or sale of any financial instrument or as an official confirmation of any transaction. Opinions, estimates and assumptions expressed herein are made as of the date of this communication and are subject to change without notice. This communication has been prepared based upon information, including market prices, data and other information, believed to be reliable; however, Trade Nation does not warrant its completeness or accuracy. All market prices and market data contained in or attached to this communication are indicative and subject to change without notice.

Same Setup, Bigger Boom Incoming?The price action here is telling a clear story. Every time LSE:MYX spends time moving sideways, quietly accumulating in a range, it eventually launches into a powerful breakout. We can see it happened once, then again — each consolidation phase built up energy, and when that energy released, the market ripped higher.
Right now, the same pattern looks to be repeating. Price is sitting inside a tight range once again, showing signs of healthy consolidation. If history is any guide, this could be the calm before another explosive move.
Accumulation → Boom.
Accumulation → Boom.
And now…? The setup looks like it’s preparing for the next chapter.
DYOR, NFA
#PEACE
Stay tuned for more update

ETH Bulls Target $5,200 Next — Is $5,500 Around the Corner?ETH looks like it’s exiting a sideways/accumulation band and moving back into a bullish regime on the 4-hour chart. The structure recently shifted from range-bound to higher lows → higher highs, which is the first quality check for a sustainable push higher. The move is not yet a blow-off — it’s a controlled attempt to reclaim higher resistance.
On the chart I see three clean bands to treat differently:
• Near-term supply (resistance) sits just under ~$4,950 and extends to ~$5,200. Price has to clear and hold above this zone to confirm a larger breakout and give bulls runway to $5,500+.
• Immediate control / pivot is roughly the present area near $4,500–$4,550 (where buyers re-entered). This zone now acts as short-term support if price holds.
• Lower structural demand is near $4,220 (primary invalidation for this bullish thesis) and below that $3,940 is the deeper cushion where previous buyers stepped in strongly.
Price behavior to watch: a clean 4H close above $4,950 with follow-through opens the path to $5,200; failure there (rejection on heavy tails) turns the move into a “bull trap” and would require caution. Conversely, a breakdown and decisive 4H close below $4,220 invalidates the bullish plan and suggests revisiting lower structural supports.
________________________________________
Level-by-level careful analysis (why each matters)
• $4,220 (primary support / invalidation) — multiple prior reactions here: a daily/4H close below this suggests sellers regained control and the bullish case fails. Use this as your hard invalidation.
• $4,500 – $4,550 (current control / entry zone) — recent buyers defended this band; it’s where new longs are being accumulated. A hold/clean bounce here is a good risk-controlled entry region.
• $4,950 (first major resistance) — the choke point. This is where supply historically clustered; a close above with volume / hourly follow-through confirms breakout. Partial profit-taking is logical here even if continuation follows.
• $5,200 (secondary resistance / breakout confirmation) — significant supply cluster; a sustained break here targets extension to $5,500+.
• $3,940 (deep support / liquidity pool) — if price collapses through $4,220 this is the next magnet where buyers likely re-appear.
________________________________________
Numeric recap (all important numbers — copy/paste friendly)
• Current price area to watch: $4,500 – $4,550
• Hard invalidation (stop area): $4,220
• Short-term target / TP1: $4,950
• Breakout confirmation zone / TP2: $5,200
• Extended target / TP3: $5,500+
• Deeper demand if invalidated: $3,940
Estimated risk/reward (if entry ~$4,520 & SL $4,220):
• Risk = $300 (4,520 − 4,220)
• Reward to TP1 = $430 → R:R ≈ 1.43 : 1
• Reward to TP2 = $680 → R:R ≈ 2.27 : 1
• Reward to TP3 = $980 → R:R ≈ 3.27 : 1
________________________________________
📈 Trade setup (bullets only)
• Entry: buy $4,500 – $4,550 (prefer a constructive 4H bounce inside this zone)
• Stop-loss: $4,220 (clean 4H close below = invalidation)
• Take Profit 1 (TP1): $4,950 → take 30–40% off
• Take Profit 2 (TP2): $5,200 → take another 30–40%; move remaining to breakeven
• Take Profit 3 (TP3): $5,500+ → leave a small runner, trail stop under 4H higher lows
• Trailing stop plan: after TP1, trail SL to breakeven; after TP2, trail SL under each successive 4H higher low or use 1.5× ATR(20,4H) for dynamic trailing
• Risk per trade: keep at 1–2% of account equity; size position so $300 risk equals your dollar risk cap
________________________________________
Execution & risk notes (brief)
• Prefer confirmation: either a clean 4H bounce from $4,500–4,550 or a clean 4H close above $4,950 (for breakout entries).
• Expect whipsaws near $4,950; partials at TP1 reduce exposure to false breakouts.
• If macro events/US data are due, reduce size or wait for post-event clarity — ETH can gap around high-impact crypto or macro news.
• Re-evaluate if price closes below $4,220 on 4H — cut and re-plan.
________________________________________

ETH/USD Analysis –Potential Pullback Before the Next Bullish Leg📈 ETH/USD Analysis – Potential Pullback Before the Next Bullish Leg
Ethereum is currently trading at $4,622 after an impressive rally. The price has reached a key resistance zone (~$4,700), where a short-term correction could occur.
Key insights:
EMA ribbons show a strong bullish trend – all moving averages are aligned upward and acting as dynamic support.
Fibonacci levels indicate the nearest major support around $4,000 (blue horizontal line).
Scenario: a possible retracement toward the ~$4,000 area, followed by a bounce targeting $5,250 and beyond.
Conclusion:
In the short term, we might see a healthy pullback, but the overall market structure remains strongly bullish. Strategically, watching the reaction at the $4,000 support zone could offer a good buying opportunity.

IDOLUSDT - Break or Breakdown? IDOL at Decision Zone!Currently, MEET48/USDT is sitting at a critical decision zone after a parabolic rally from 0.012 → 0.0428. The euphoric surge was followed by a healthy correction and distribution phase, forming lower highs capped by a descending trendline (yellow) while price consolidates within the 0.030 – 0.033 box zone (yellow box).
This area now acts as the ultimate battlefield between buyers and sellers. The next decisive move will determine whether we get a bullish continuation breakout or a bearish breakdown into deeper correction.
---
Visible Patterns
1. Descending Trendline (seller pressure)
Price has repeatedly failed to close above this yellow line → showing sellers are defending strongly.
2. Consolidation Box (accumulation zone)
The 0.030–0.033 zone is the current tug-of-war area. As long as price holds above it, buyers still have a chance.
3. Two Technical Interpretations:
Descending Triangle (bearish bias): if price continues to press against support.
Falling Wedge (bullish bias): if price breaks to the upside, often signaling trend continuation after a pullback.
---
Bullish Scenario
Trigger: 4H candle close above 0.033 with strong volume confirmation.
Targets:
TP1 → 0.0361 (first resistance)
TP2 → 0.0405
TP3 → 0.0428 (local high/ATH)
Narrative: A breakout signals buyers regaining control and resuming the prior rally after consolidation.
---
Bearish Scenario
Trigger: 4H candle close below 0.030 with high selling pressure.
Targets:
First support zone → 0.024 – 0.025
Extended target → 0.0115 (historical low shown on chart)
Narrative: A breakdown confirms sellers dominating the zone, opening room for a deeper correction.
---
Key Takeaway
0.030 – 0.033 = Decision Zone
Breakout above → continuation higher.
Breakdown below → deeper correction.
Watch volume and 4H candle close for confirmation.
---
Notes for Traders
Avoid FOMO, wait for confirmation before entering.
Use scaling strategies (partial entries/exits).
Always manage risk with stop loss outside the box zone.
MEET48 is a low-cap altcoin → expect potential false moves due to low liquidity.
---
#MEET48 #MEET48USDT #CryptoAnalysis #Altcoin #TechnicalAnalysis #Breakout #DescendingTriangle #FallingWedge #SupportResistance

Bullish rise?Ethereum (ETH/USD) is reacting off the pivot and could rise to the 1st resistance, which is a pullback resistance.
Pivot: 4,437.74
1st Support: 4,264.46
1st Resistance: 4,691.58
Disclaimer:
The above opinions given constitute general market commentary, and do not constitute the opinion or advice of IC Markets or any form of personal or investment advice.
Any opinions, news, research, analyses, prices, other information, or links to third-party sites contained on this website are provided on an "as-is" basis, are intended only to be informative, is not an advice nor a recommendation, nor research, or a record of our trading prices, or an offer of, or solicitation for a transaction in any financial instrument and thus should not be treated as such. The information provided does not involve any specific investment objectives, financial situation and needs of any specific person who may receive it. Please be aware, that past performance is not a reliable indicator of future performance and/or results. Past Performance or Forward-looking scenarios based upon the reasonable beliefs of the third-party provider are not a guarantee of future performance. Actual results may differ materially from those anticipated in forward-looking or past performance statements. IC Markets makes no representation or warranty and assumes no liability as to the accuracy or completeness of the information provided, nor any loss arising from any investment based on a recommendation, forecast or any information supplied by any third-party.

ETH 4H Analysis - Key Triggers Ahead | Day 19😃 Hey , how's it going ? Come over here — Satoshi got something for you!
⏰ We’re analyzing ETH on the 4-Hour timeframe.
🔭 ETH 4H Chart: Observing Ethereum on the 4-hour timeframe, after breaking the midline of the box, ETH closed above the box. Then, following the news, it formed a shadow that hit the lower box level, triggering a series of buy orders. Now, we’re watching to see if ETH will continue upward. The overall trend behind ETH is still bullish, and a breakout above the multi-timeframe range could push it toward the box’s top again.
⛏ Key RSI Levels: ETH’s RSI is around 70 and 50. A breach of these levels could signal the start of a move, especially following today’s inflation news impact.
💰 Candle Size & Volume: Green candle sizes and volume have increased. Yesterday, $164M of ETH was bought via ETFs, which is notable.
🪙 ETHBTC 4H Chart: Observing the ETH/BTC pair on the 4-hour timeframe, this pair tends to act slightly more precisely compared to ETH/USDT. Currently, it’s trading within a box with declining volume. News caused a reaction at the top of the box. If the box’s top breaks, a significant amount of BTC could convert into ETH, potentially pumping the ETH/USDT pair as well.
🔔 Entry & Target Zones: A potential early entry is around $4443, with the box top at $4500 — a strong resistance. If ETH breaks this level, it could aim for a new ATH. Make sure to confirm across multiple timeframes before taking a position.
❤️ Disclaimer : This analysis is purely based on my personal opinion and I only trade if the stated triggers are activated .

BTC & ETH Breakouts Explained (Simple Strategy)Bitcoin just printed a perfect daily breakout candle — and Ethereum is forming a massive structure. In this video, I’ll show you the exact triggers I use on Daily, 4H, and 15m to catch the next move before everyone else.
Drop your BTC analysis in the comments — let’s debate it together.
Want me to cover a specific coin in tomorrow’s update? Comment it below.

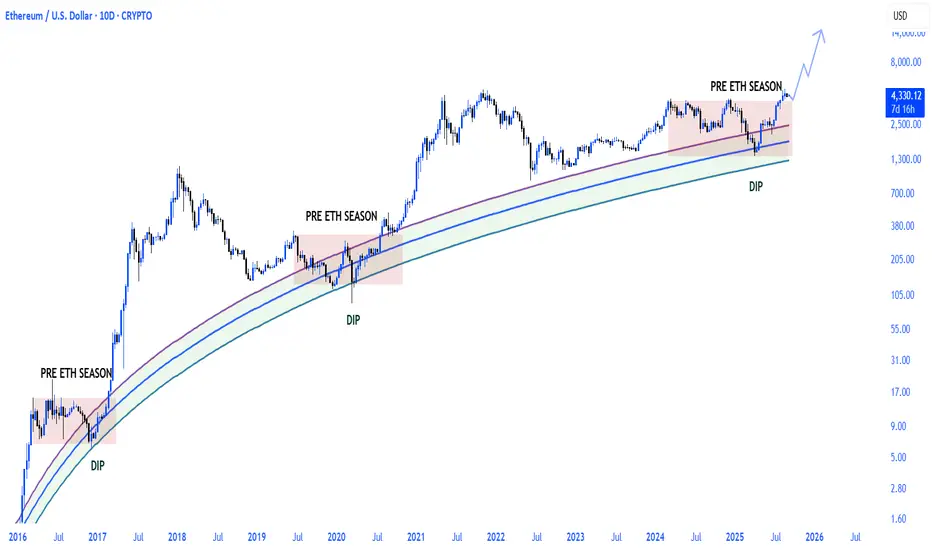
ETHUSD - Bullish Weeks/Months Ahead Curved channel shows consistent bottoms along the solid green line
I think a large pattern will play out like the one seen in this triangle in yellow
The white line is honestly max and wishful
Bullish Weekly Chart

Ethereum ETH Trade Setup: Resistance, Liquidity, and BoS Idea🟣 Ethereum (ETH) Update (further to my previous idea) 🟣
ETH is currently bullish 🟢📈 and pressing into a key resistance level ⚖️ where we see multiple relative equal highs 📍📍 forming consecutively. This is a major level 🔑.
Here’s what I’m watching:
1: The current pullback may give us a bullish BoS for an entry.
2: If price trades above this resistance 🚀, it will likely trigger buy stops 🎯, providing the liquidity 💧 needed for a potential pullback 🔽.
3: If price then breaks through decisively 💥, I’ll be looking for a retest + hold 🔄, followed by a bullish break of market structure (BOS) 🔓 as confirmation to get long 🟢.
⚠️ This is educational only, not financial advice. 📚

Ethereum ETH at Key Resistance: Equal Highs and Liquidity Play🟣 Ethereum (ETH) Update 🟣
ETH is currently bullish 🟢📈 and pressing into a key resistance level ⚖️ where we see multiple relative equal highs 📍📍 forming consecutively. This is a major level 🔑.
Here’s what I’m watching:
If price trades above this resistance 🚀, it will likely trigger buy stops 🎯, providing the liquidity 💧 needed for a potential pullback 🔽.
If price then breaks through decisively 💥, I’ll be looking for a retest + hold 🔄, followed by a bullish break of market structure (BOS) 🔓 as confirmation to get long 🟢.
⚠️ This is educational only, not financial advice. 📚

$ETH doesn’t look done pumping yetCRYPTOCAP:ETH doesn’t look done pumping yet. While it’s screaming for consolidation, past cycles suggest another leg up toward $5,200–$5,400 or even higher at $6,000 before hitting critical overbought levels.
The likely scenario, if history repeats, is a sharp correction back to the EMA 50. However, strong institutional inflows could front-run this, pushing CRYPTOCAP:ETH higher without ever revisiting $4,000.
MACD and RSI are extended, but price action remains resilient. CRYPTOCAP:ETH can stay overbought longer than expected before finally flipping bearish.
No bearish divergeance, just a nice pump.
Bottom line: CRYPTOCAP:ETH still looks bullish, with 20–50% upside from here likely. But momentum is heating up, so it may be wise to gradually secure profits before the inevitable pullback.
DYOR

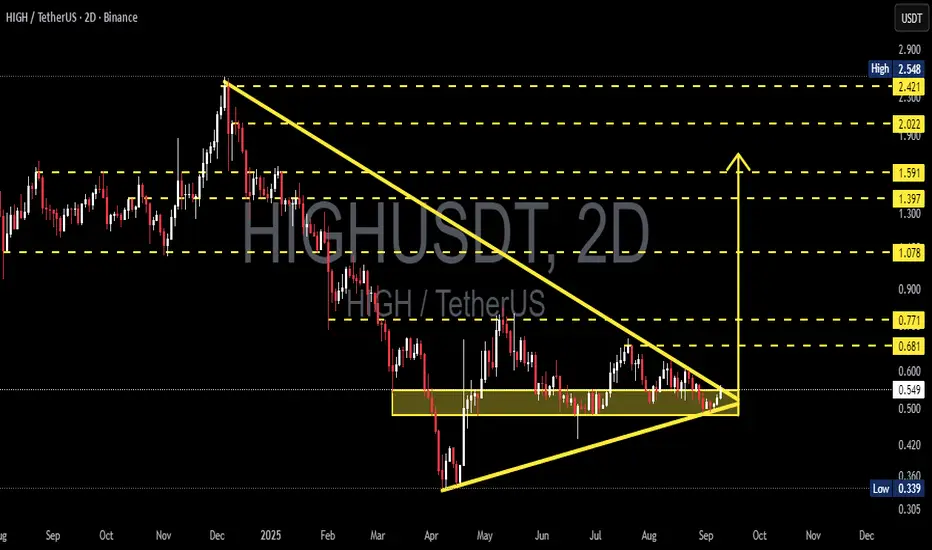
HIGHUSDT — Symmetrical Triangle A Major Breakout Is Approaching?The pair HIGH/USDT is currently at a critical stage after experiencing a prolonged downtrend earlier this year. On the chart, we can clearly see the formation of a Symmetrical Triangle, marked by a descending resistance line from the $2.5 peak and a rising support line that has been holding since April 2025.
This type of pattern usually appears during a consolidation phase, where both buyers and sellers are competing to decide the next medium-term trend.
---
🔑 Key Highlights from the Chart:
1. The accumulation zone (0.45 – 0.55) has been tested multiple times since April and continues to hold — making it a critical demand area.
2. Price action is now squeezing into the apex of the triangle, suggesting that a major breakout is likely to occur soon.
3. Key resistances: 0.681 → 0.771 → 1.078 → 1.397 → 1.591 → 2.022 → 2.421.
4. Key supports: 0.45, with the last major floor at 0.339. A breakdown here would strengthen the bearish case.
---
📈 Bullish Scenario
A breakout above the descending trendline and a confirmed 2D candle close above 0.68–0.77 would open the door for a strong rally.
Short-term targets: 0.77 → 1.08 → 1.40
Mid-term targets: 1.59 → 2.02 → 2.42
Full measured move target: 2.63 – 2.76
Confirmation: Breakout must come with rising volume + successful retest.
---
📉 Bearish Scenario
Failure to hold above 0.45 would invalidate the triangle pattern and likely lead to further downside.
First bearish target: 0.339 (previous low).
If broken, extended bearish measured move could reach around 0.12 (extreme scenario).
Confirmation: 2D close below 0.45 with strong selling volume.
---
🧭 Conclusion
HIGH is at a decisive turning point.
Bulls need a confirmed breakout above 0.68–0.77 to shift momentum and reclaim medium-term strength.
Bears will dominate if 0.45 breaks, pushing price back to 0.339 or lower.
Until confirmation, the setup remains neutral, but the tightening triangle indicates that a large move is imminent.
---
#HIGHUSDT #HIGH #Crypto #TechnicalAnalysis #SymmetricalTriangle #Breakout #Bullish #Bearish #Altcoin #SupportResistance
ETHFI Squeeze: One Close Away From a Massive RallyCRYPTOCAP:ETHFI is coiling inside a tightening structure with higher lows forming consistently. The price is pressing against the upper resistance trendline.
If ETHFI manages to break and close above the marked zone, it could trigger a massive breakout move as trapped sellers get squeezed and fresh buyers step in.
Keep a close watch, this setup is building energy for its next big move.
DYOR, NFA
#PEACE
More update coming soon, stay tuned!

ETH 4H Analysis - Key Triggers Ahead | Day 18😃 Hey , how's it going ? Come over here — Satoshi got something for you!
⏰ We’re analyzing BTC on the 1-Hour timeframe.
🔭 On the 4-hour timeframe of Ethereum we can see that ETH is clearly in a very strong consolidation, and for several days even the oscillator has been ranging around the 50 zone. This time-based range will eventually come to an end. Ethereum now has two important levels ahead with the upcoming news: the top of the box midline at $4373, where breaking this zone could trigger a strong pump, and the bottom zone, which is a maker-buyer area at $4252, considered a very strong and important support for Ethereum.
⛏ The key RSI levels for Ethereum are at 57 and 40. If the range of oscillation crosses these levels, ETH could gain more volatility and even move toward its overbought or oversold regions. Usually, this type of short-term consolidation ends with a good price move once the compression is broken.
💰 The size, volume, and number of green candles have really decreased, and multiple candles inside the range have formed, creating a decision-making phase for ETH. With today’s PPI news, it is likely that one of these zones will either be touched or broken, and after this news, candles are expected to come with stronger volume.
🪙 On the 4-hour timeframe of the ETHBTC trading pair we can see that it is in a descending continuation channel. Each time the price has reached the top or bottom of this channel, it has reacted with a reversal and then moved in the opposite direction. Currently, ETHBTC is above its midline and has shown a positive reaction to it. The volatility of this pair has significantly decreased in recent days and is now ranging under its 50 zone. A breakout above the channel top and the 0.03893 level could start a bullish move.
💡 The zones we are considering for Ethereum’s top and bottom are $4493 and $4252. Breaking either of these levels after this multi-day consolidation could start a strong trend and even a sharp directional move! Keep in mind that war and economic news have created interconnections for risky markets—trade with low risk.
❤️ Disclaimer : This analysis is purely based on my personal opinion and I only trade if the stated triggers are activated .

Will Ethereum lead next Altseason? ETF & Fusaka update in focus!Ethereum ETFs have recently seen significant inflows, outpacing Bitcoin ETFs, just ahead of the upcoming Fusaka upgrade in November.
Ethereum recently broke above its previous record high, a move that was anticipated in earlier analysis, and is pulling back before shooting higher. For a sustained move higher, a strong breakout with increased volume and momentum is needed. There are signs of momentum exhaustion, so traders should watch for confirmation before expecting further upside.
A classic cup and handle formation opens the door to $6,200 if resistance is cleared, with key support at $4,115 (previous resistance now acting as support) and a deeper pullback exposing $3,500. But this would not necessarily change the long-term bullish outlook.
Indicators to Watch
Bitcoin Dominance:
Bitcoin’s market dominance is currently around 55%, suggesting the market is still Bitcoin-led, and a true “altseason” may be at its early stage.
Total Crypto Market Cap:
Watch for breakouts in the total crypto market cap (TOTAL3 - excluding Bitcoin and Ethereum) and the formation of bullish patterns for confirmation of a broader market uptrend.
Altcoin Season Index:
The index remains below the threshold for a full altseason but is rising, indicating that Ethereum and other altcoins are not broadly outperforming Bitcoin but are nearing breakout.
Short/Medium-Term Outlook:
Expect continued consolidation or a possible pullback before any sustained move higher if support above $4,115 holds firm.
Long-Term Outlook:
As long as Ethereum holds above the 50% retracement level, the long-term trend remains positive. A confirmed breakout above resistance could signal the next major upward phase.
This content is not directed to residents of the EU or UK. Any opinions, news, research, analyses, prices or other information contained on this website is provided as general market commentary and does not constitute investment advice. ThinkMarkets will not accept liability for any loss or damage including, without limitation, to any loss of profit which may arise directly or indirectly from use of or reliance on such information.

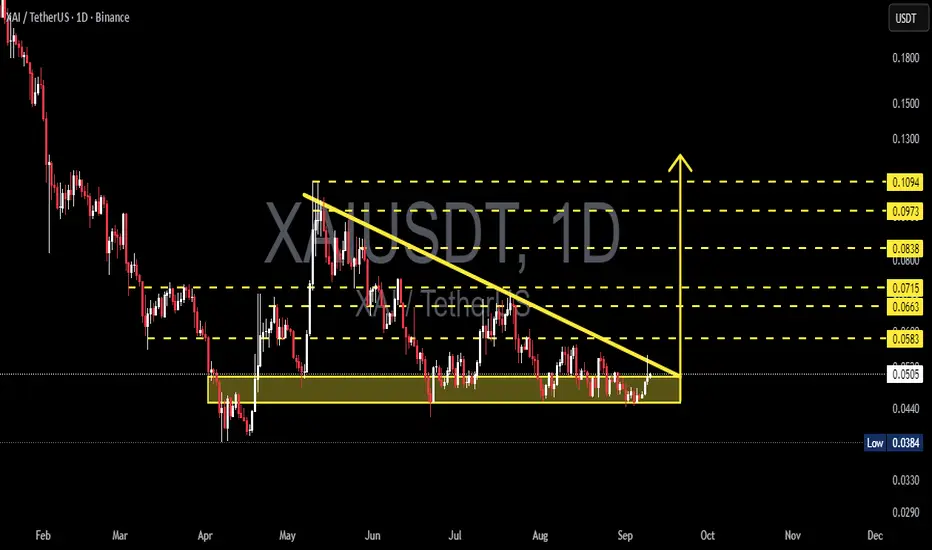
XAI/USDT — Descending Triangle: Ready for Takeoff or Breakdown?✨ Quick Summary:
The XAI/USDT chart is now at a critical decision point. For months, price has been consolidating inside the accumulation zone (0.0384 – 0.050), while being consistently pressured by a descending trendline from above. This structure forms a descending triangle, a pattern that often signals bearish continuation, but can also act as a powerful reversal base if a breakout occurs with strong volume.
Currently, price trades around 0.0504, right at the crossroads of major support and the seller’s pressure line. This means an explosive move — either a breakout or breakdown — is likely coming soon.
---
🔎 Chart Pattern & Price Structure
Support Zone (yellow box): 0.0384 – 0.050 → tested multiple times since April 2025, showing strong buyer defense.
Descending Trendline Resistance (yellow line): connecting lower highs since May, pressing price downward.
Pattern: Classic Descending Triangle → market is coiling tighter, awaiting a catalyst.
Market Psychology:
Buyers keep defending the same support.
Sellers consistently lower their asking prices.
This tug-of-war is reaching its breaking point.
---
🚀 Bullish Scenario (Breakout)
Key confirmation:
Daily close above the descending trendline.
Breakout and daily close above 0.0583 with significant volume.
Potential upside targets (layered resistances):
🎯 Target 1: 0.0583 (+15%)
🎯 Target 2: 0.0663 (+31%)
🎯 Target 3: 0.0715 (+42%)
🎯 Target 4: 0.0838 (+66%)
🎯 Target 5: 0.0973 (+93%)
🎯 Ambitious Target: 0.1094 (+117%)
Trading notes:
Strong breakouts often come with at least 2x average daily volume. The ideal setup is breakout → retest (turning resistance into support) → continuation. Conservative entries can wait for the retest confirmation above 0.0583.
---
⚠️ Bearish Scenario (Breakdown)
Key confirmation: daily close below 0.0384 with a full-bodied candle and high volume.
Downside risk:
Retest of the psychological support zone 0.033 – 0.030.
Breakdown here would likely extend the broader bearish trend, potentially setting new lows.
Trading notes:
A breakdown with volume often triggers panic selling. In this case, stop-losses for longs become crucial. Aggressive traders may consider shorts after a failed retest of broken support.
---
🔑 Extra Confirmation Factors
1. Volume: No volume = no trust in breakout/breakdown.
2. RSI / Momentum: Bullish divergence supports a breakout, bearish divergence confirms breakdown.
3. Market Sentiment: If BTC/ETH trend bullish, XAI’s breakout chances improve. A weak crypto market favors breakdown.
4. Fundamental Catalysts: Partnerships, project updates, or listings can flip the technical outlook.
---
📌 Conclusion
XAI/USDT is facing a make-or-break moment:
Bullish breakout could open a +40% to +100% rally.
Bearish breakdown could drag price back to the 0.030–0.033 zone.
For traders: this is the time to wait for confirmation. Entering too early in such a setup carries high risk. The best positions often come after the market chooses its direction.
---
#XAI #XAIUSDT #CryptoAnalysis #TechnicalAnalysis #DescendingTriangle #Altcoin #Breakout #SupportResistance #CryptoTrading