ETHUSD H4 | Bullish Bounce Off Pullback SupportMomentum: Bearish
Price is currently falling toward the buy entry, which aligns with a pullback support level sitting slightly above the 38.2% Fibonacci retracement. The market is also trading above the Ichimoku cloud, suggesting this zone could provide potential support for a bounce.
Buy Entry: 3,079.09
Pullback support
Slightly above the 38.2% Fibonacci retracement
Stop Loss: 2,876.32
Pullback support
Slightly below the 61.8% Fibonacci retracement
Take Profit: 3,407.09
Pullback resistance
Slightly above the 161.8% Fibonacci extension
High Risk Investment Warning
Stratos Markets Limited (tradu.com ), Stratos Europe Ltd (tradu.com ):
CFDs are complex instruments and come with a high risk of losing money rapidly due to leverage. 70% of retail investor accounts lose money when trading CFDs with this provider. You should consider whether you understand how CFDs work and whether you can afford to take the high risk of losing your money.
Stratos Global LLC (tradu.com ): Losses can exceed deposits.
Please be advised that the information presented on TradingView is provided to Tradu (‘Company’, ‘we’) by a third-party provider (‘TFA Global Pte Ltd’). Please be reminded that you are solely responsible for the trading decisions on your account. Any information and/or content is intended entirely for research, educational and informational purposes only and does not constitute investment or consultation advice or investment strategy. The information is not tailored to the investment needs of any specific person and therefore does not involve a consideration of any of the investment objectives, financial situation or needs of any viewer that may receive it. Past performance is not a reliable indicator of future results. Actual results may differ materially from those anticipated in forward-looking or past performance statements. We assume no liability as to the accuracy or completeness of any of the information and/or content provided herein and the Company cannot be held responsible for any omission, mistake nor for any loss or damage including without limitation to any loss of profit which may arise from reliance on any information supplied by TFA Global Pte Ltd.
Ethereum (Cryptocurrency)

ETHUSD H4 | Bullish ReversalMomentum: Bullish
Price is currently pulling back toward the buy entry, which aligns with the 50% Fibonacci retracement, a strong area where a bullish bounce may occur.
Buy Entry: 3,079.09
Strong overlap support
50% Fibonacci retracement
Stop Loss: 2,901.08
Pullback support
78.6% Fibonacci retracement
Take Profit: 3,407.09
Pullback resistance
High Risk Investment Warning
Stratos Markets Limited (tradu.com ), Stratos Europe Ltd (tradu.com ):
CFDs are complex instruments and come with a high risk of losing money rapidly due to leverage. 70% of retail investor accounts lose money when trading CFDs with this provider. You should consider whether you understand how CFDs work and whether you can afford to take the high risk of losing your money.
Stratos Global LLC (tradu.com ): Losses can exceed deposits.
Please be advised that the information presented on TradingView is provided to Tradu (‘Company’, ‘we’) by a third-party provider (‘TFA Global Pte Ltd’). Please be reminded that you are solely responsible for the trading decisions on your account. Any information and/or content is intended entirely for research, educational and informational purposes only and does not constitute investment or consultation advice or investment strategy. The information is not tailored to the investment needs of any specific person and therefore does not involve a consideration of any of the investment objectives, financial situation or needs of any viewer that may receive it. Past performance is not a reliable indicator of future results. Actual results may differ materially from those anticipated in forward-looking or past performance statements. We assume no liability as to the accuracy or completeness of any of the information and/or content provided herein and the Company cannot be held responsible for any omission, mistake nor for any loss or damage including without limitation to any loss of profit which may arise from reliance on any information supplied by TFA Global Pte Ltd.

The Crypto Money Flow CycleThe capital rotation cycle in the crypto market is not a theoretical concept, but a phenomenon that has repeated itself across multiple growth cycles. It reflects the natural behavior of capital flows: starting from the safest assets, then gradually spreading to higher-volatility instruments as confidence and risk appetite increase. Typically, capital first flows into Bitcoin — the foundational asset and “anchor” of the entire market — before rotating into Ethereum, a core ecosystem that consistently attracts strong inflows once market conditions stabilize.
When these two pillars begin to slow down, capital expands into large-cap altcoins, then accelerates into meme coins, and ultimately ends in the riskiest assets such as shitcoins. This is the point at which the market reaches peak heat: potential returns are enormous, but risk is also at its highest level.
If Bitcoin is the main river, Ethereum represents the major tributaries, altcoins are the canal system, and meme coins and shitcoins are the stagnant waters at the very end of the flow — the murkiest area, but also the place where many investors are most likely to “drown.” The imagery may sound harsh, but it accurately captures the market’s nature: the higher the potential return, the greater the downside, and near the end of the cycle, even a small variable can push the entire structure into chaos.
Understanding this cycle not only helps investors identify where the market currently stands, but also supports more rational capital allocation decisions. When capital is still concentrated in BTC and ETH, rushing into shitcoins offers little advantage and only increases the risk of capital loss. Conversely, when the market enters its euphoric phase, FOMO often overrides logic: newcomers rush in just as smart money is preparing to exit. Recognizing the cycle helps avoid these traps. It also explains the common frustration of “the coin I hold goes nowhere while others keep pumping,” because you understand where capital is flowing instead of investing based on emotion.
To accurately identify the market’s position within the cycle, it is essential to observe behavior at each stage. When BTC rallies strongly and BTC Dominance rises, capital is in the early phase. This is the time to focus on Bitcoin and avoid smaller altcoins, as they usually underperform when dominance expands. When Bitcoin starts to slow down, moving sideways or correcting slightly while the ETH/BTC pair trends steadily higher, capital is rotating into Ethereum. This phase often favors increasing exposure to ETH.
When both BTC and ETH stall, the market enters Altcoin Season. Altcoins with solid fundamentals, mid-to-large market capitalizations, and clear narratives become the primary destinations for capital. This is when Layer-1, Layer-2, DeFi, AI, and RWA sectors tend to perform strongly. However, this is still not the right time to dive into meme coins and shitcoins, as the market remains in the “mid-cycle” phase, where performance belongs to fundamentally backed assets rather than purely speculative tokens.
The final — and most dangerous — stage is when meme coins and shitcoins explode. The clearest signs are social media being flooded with x20, x50, or x100 stories and near-vertical price charts detached from any real product or utility. This is when smart money gradually exits, leaving the stage to new participants driven by euphoria. If participation is unavoidable, only a very small portion of capital should be allocated, with a mindset of “fast in, fast out,” because risk in this environment can materialize within hours.
To navigate the full cycle effectively, several indicators should be monitored consistently. BTC Dominance reveals whether the market is prioritizing safety or expanding toward risk. Market capitalization and liquidity determine both upside potential and downside resilience. Finally, the risk-on/risk-off environment clearly reflects investors’ willingness to take risk. When the market shifts to risk-on, altcoins and meme coins tend to surge; when it turns risk-off, capital typically flows back into BTC or stablecoins for defense.

Ethereum - The bearmarket is not over yet!🪚Ethereum ( CRYPTO:ETHUSD ) can still drop about -30%:
🔎Analysis summary:
Over the past four years, Ethereum has been creating a major bullish triangle. With the recent all time high retest, we are now seeing an expected reversal. But considering the bullish nature of this triangle, Ethereum will head higher after a retest of the next support.
📝Levels to watch:
$2,000
SwingTraderPhil
SwingTrading.Simplified. | Investing.Simplified. | #LONGTERMVISION

ETH/USDT Bullish Reversal SetupETH/USDT Bullish Reversal Setup
The chart shows a clear transition in ETH as price moves from a prolonged distribution-driven decline into a developing accumulation range. After weeks of consistent bearish structure, the market finally printed multiple upside shifts, signaling that sell-side pressure is weakening and liquidity behavior is changing.
The recent impulsive rally out of the discounted range confirms that buyers are actively defending lower levels. Price is now pulling back toward a short-term demand pocket formed during the breakout. This area represents the first meaningful accumulation zone after the market broke a series of internal swing points.
As long as price maintains stability within this demand block, the structure favors continuation toward the next major liquidity cluster above. The next upside draw is positioned around the 3,440–3,500 region, where previous inefficiencies and unmitigated zones converge. That region also holds resting buy-side liquidity, making it the logical target for a future expansion move.
The current market behavior suggests that ETH is in the early phase of a bullish repricing cycle. A controlled pullback into the highlighted zone—followed by a reaction—would confirm continuation and attract momentum buyers aiming for the higher liquidity magnet.
Overall, this chart reflects a shift in narrative: sellers are losing dominance, the market is building a fresh bullish structure, and the path of least resistance is gradually tilting upward as long as the demand zone remains protected.

ethereum enters into the "santa rally"gm!
ethereum just performed a very bullish move - way more bullish than whatever i was expecting.
it liquidated all of the longs this morning, with just a tiny fraction of them remaining at 3k.
this makes me believe that ethereum is gearing up for "the santa rally"
- santa rally is a mythical move in the market which causes assets to move up in price into the christmas holidays.
---
let's talk about the technicals as simply as possible.
i believe the low in december was a "truncated 5th" - aka "inorganic low"
everything after appears to be a leading diagonal. to put in wave (1).
wave (2)'s in elliott wave theory are usually very sharp,
which makes me think we are currently in a bullish 1-2.
---
if my theory is correct,
ethereum will tap the all time highs before december is over.
🎯 = 5k+

ETHUSD Bearish continuation below 3,409 resistanceThe ETHUSD pair continues to display a bearish outlook, in line with the prevailing downward trend. Recent price action suggests a corrective pullback, potentially setting up for another move lower if resistance holds.
Key Level: 3,409
This zone, previously a consolidation area, now acts as a significant resistance level.
A failed test and rejection at 3,409 would likely resume the bearish momentum.
Downside targets include:
2,994 – Initial support
2,879 – Intermediate support
2,753 – Longer-term support level
Bullish Scenario (breakout above 3,409):
A confirmed breakout and daily close above 3,409 would invalidate the bearish setup.
In that case, potential upside resistance levels are:
3,513 – First resistance
3,626 – Further upside target
Conclusion
ETHUSD remains under bearish pressure, with the 3,409 level acting as a key inflection point. As long as price remains below this level, the bias favours further downside. Traders should watch for price confirmation around that level to assess the next move.
This communication is for informational purposes only and should not be viewed as any form of recommendation as to a particular course of action or as investment advice. It is not intended as an offer or solicitation for the purchase or sale of any financial instrument or as an official confirmation of any transaction. Opinions, estimates and assumptions expressed herein are made as of the date of this communication and are subject to change without notice. This communication has been prepared based upon information, including market prices, data and other information, believed to be reliable; however, Trade Nation does not warrant its completeness or accuracy. All market prices and market data contained in or attached to this communication are indicative and subject to change without notice.

CATCH ON ETHERUM HIGH PROBABILITY LONG SETUP SOON!!!🚨ETHER HIGH PROBABILITY BUY SETUP 🚨
* Here We Can See Clearly The Next Potential Moves For ETCUSD Coming Hours/Days.
* Keep Your Eyes Close On Your Trading Positions.
* Happy PIP Hunting Traders.
FXKILLA.

ETHUSD Momentum Building! MA Breakout Keeps Bulls in Control📘 **ETHUSD “Ethereum vs U.S. Dollar”
Crypto Market Opportunity Blueprint (DAY Trade)**
🚀 Plan Overview
A bullish continuation scenario is active following a clear Moving Average breakout and clean retest. This structure builds a favorable environment for controlled entries backed by momentum confirmation.
🎯 Entry
👉 You can enter at any price level once your personal confirmation aligns with the ongoing MA structure.
The breakout + retest provides the core framework.
🛡️ Stop Loss Strategy
📍 This is the Thief SL @ 3050 Dear Ladies & Gentleman (Thief OG’s)
Adjust your Stop Loss based on your own strategy, risk tolerance, and trade model.
⚠️ Place the SL only after the MA breakout confirmation, not before.
📝 Note:
Dear Ladies & Gentleman (Thief OG's) I am not recommending that you use only my SL. It’s your own choice; you can make money then take money at your own risk.
🎯 Target
The SuperTrend ATR line is acting as a strong resistance, and current conditions suggest:
📈 Overbought signals building
Trap zones developing
📌 Smart exit required
👉 Our target: 3600
📝 Note:
Dear Ladies & Gentleman (Thief OG’s) I am not recommending that you set only my TP. It’s your own choice; you can make money then take money at your own risk.
🔍 Related Pairs to Watch (Correlation & Key Notes)
1. BITSTAMP:BTCUSD (Bitcoin vs USD)
ETHBTC correlation remains high during MA-driven moves.
BTC’s trend strength often dictates crypto-wide volatility.
Strong BTC breakout boosts ETH’s bullish follow-through potential.
2. BINANCE:ETHBTC (Ethereum vs Bitcoin)
Great pair to measure Ethereum’s relative strength.
Rising ETHBTC = ETH outperforming BTC → supports the bullish ETHUSD narrative.
Useful for detecting early reversals before USD-pairs show it.
3. CRYPTOCAP:TOTAL2 (Altcoin Market Cap)
Represents overall altcoin strength excluding BTC.
If TOTAL2 breaks resistance with volume, ETH usually moves aggressively.
Helps confirm whether the market supports a broad-based ETH rally.
4. COINBASE:SOLUSD (Solana vs USD)
Competes for capital rotation with ETH.
When SOL pumps aggressively, ETH sometimes lags before catching momentum.
Watching SOL gives early hints of altcoin capital flow.
5. TVC:DXY (US Dollar Index)
Inverse correlation with major crypto assets.
Weak DXY = supportive environment for ETHUSD upside.
Strong DXY = caution for crypto longs.

ETH 4H Trendline Retest Bounce, Bullish Structure Still HoldingEthereum continues to respect the ascending 4H trendline while holding above the 50/100 EMA cross. After tapping the 0.5–0.618 Fib retracement zone, price reacted cleanly and reclaimed structure, forming a textbook retest-and-bounce setup. The daily trendline break adds higher-timeframe confluence, and the Stoch RSI has fully reset, creating room for a potential continuation move.
If bulls maintain the trendline and stay above the 50 EMA, the next objectives remain the prior swing high near $3,400 and the mid-channel diagonal above it. A breakdown of the trendline would open a revisit of the deeper Fib levels at $3,083 and $2,997. Structure remains bullish unless those levels fail.

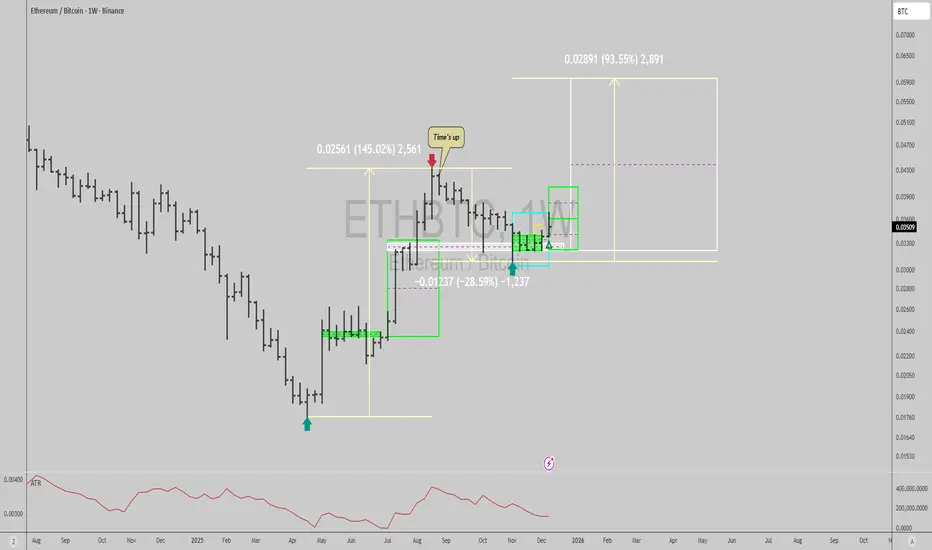
$ETHBTC: Weekly trend turning bullish again...Good afternoon lads,
Ethereum vs Bitcoin is now bullish in the short and mid term and can trigger a monthly timeframe trend soon if strength persists in the coming month.
Sentiment had reached the depths of hell by Friday Nov 21st, when I was at the Devconnect event, chatting with traders and people there I noticed that everyone was against my bullishness, and very keen on confronting or even ridiculing me for my views.
Since then, I started to DCA back into crypto positions after having reduced exposure massively when BITSTAMP:BTCUSD was at $115k and CRYPTOCAP:ETH circa $4k.
Let's see how things evolve, but know that reward to risk is skewed to the upside here.
Best of luck!
Cheers,
Ivan Labrie.
ETH USD SELL NOW 3182posting the sell trade based on sell side imbalance and buy side ineffiencicy
ETH USD SELL NOW 3182
Sl and TP are 1:4 RR

ETH Momentum Fades — Pullback Toward 3245 Expected📉 Ethereum Analysis — Pullback Setup Triggered
Ethereum has completed a sharp breakout above the previous consolidation range, pushing into the 3,350–3,365 resistance zone, but momentum has now slowed. Price is forming a potential M-top rejection, signaling a short-term reversal.
🔍 What the Chart Shows
Breakout from major accumulation range (left box).
Rising wedge / steep channel showing exhaustion at the top.
Current sideways mini-range showing loss of bullish pressure.
Ichimoku cloud below, aligning with the retest zone.
Arrow points toward the 3,245 support, which is the next high-probability retracement level.
📉 Short-Term Bias: Bearish Retracement
If ETH continues rejecting around 3,350–3,360, a clean drop into the 3,245 zone is likely as price fills the imbalance and retests cloud support.
📌 Key Levels
Resistance: 3,350 – 3,365
Immediate Support: 3,300
Main Target: 3,245
Breakout Origin: 3,110 zone
🎯 Overview
Momentum has cooled, buyers are losing strength, and structure hints at a corrective move. Expect ETH to dip before any fresh bullish continuation.

Ethereum Has Resumed Its Bearish Cycle Once Again (12H)As you can see, a bearish phase has begun from the point marked with the green arrow on the chart, forming an expanding pattern.
Wave E in expanding structures is typically very strong, and we expect the supply zone to hold, leading Ethereum to drop to lower prices within its bearish cycle.
The green zone is a strong area where a significant number of buy orders exist.
We follow the structure to see how Ethereum will react.
For risk management, please don't forget stop loss and capital management
When we reach the first target, save some profit and then change the stop to entry
Comment if you have any questions
Thank You

Ethereum - 4H Structure Call Playing Out, Daily Breakout.Ethereum Technical Breakout: 4-Hour Setup from December 8th Now Validated on Daily Chart
Our December 8th technical call on Ethereum based on 4-hour chart structure has materialized into a clean daily timeframe breakout. This analysis reviews the original setup, examines the price action that followed, and assesses the current structural picture as ETH pushes into higher territory with confirmed momentum.
🎯 Original Setup Recap (December 8th):
What We Identified:
On the 4-hour chart, Ethereum was showing:
Consolidation after a pullback to key support
Higher lows forming during the correction phase
Volume compression indicating accumulation
Momentum indicators resetting from overbought conditions
Critical support holding at structural levels
The Call:
Long position anticipation based on 4-hour structure suggesting the correction was nearing completion and continuation was probable. The setup offered defined risk below support with upside targets at previous resistance zones.
Why It Mattered:
The 4-hour timeframe captures intraday structure while filtering out noise from lower timeframes. When 4H patterns align with broader trend direction, they often precede significant multi-day moves that eventually appear on daily charts.
📈 What Happened Next:
Price Action Validation:
Following the December 8th structural read, Ethereum:
Held the identified support zone without breaking down
Began forming higher highs and higher lows on the 4-hour chart
Broke above intermediate resistance levels with increasing volume
Momentum indicators shifted from neutral to bullish
Daily chart structure began reflecting the 4H anticipation
The Breakout:
What started as a 4-hour setup has now translated into a clean daily chart breakout. This progression from lower timeframe structure to higher timeframe confirmation is textbook technical development - the 4H provided the early signal, the daily now provides the broader validation.
📊 Daily Chart Breakdown:
Current Structure:
Switching to the daily timeframe reveals:
Clean breakout above resistance: Previous consolidation highs have been cleared decisively
Volume confirmation: Breakout occurred with expansion in volume, not on declining participation
Momentum shift: Daily momentum oscillators flipping bullish after extended reset period
No immediate overhead resistance: Path to next major level is relatively clear
Why Daily Matters:
When a 4-hour setup evolves into a daily breakout:
Institutional participation typically increases (larger players operate on daily+ timeframes)
The move gains credibility beyond short-term speculation
Probability of continuation increases as higher timeframe traders enter
Support levels become more significant (daily structure holds better than intraday)
Key Observations:
Breakout candle characteristics: Strong close, minimal upper wick, suggesting buying conviction
Support conversion: Previous resistance now becomes support if price retests
Trend alignment: Daily now confirms what 4H structure was telegraphing weeks ago
🎯 From 4-Hour Call to Daily Confirmation:
The Progression:
December 8th (4H): Structural setup identified - accumulation phase near support
Initial Response: Price respected support, began building higher lows
Intermediate Action: 4H breakout triggered, resistance levels tested
Current State: Daily chart validates with clean breakout above consolidation
Why This Sequence Matters:
This is how professional technical analysis works:
Lower timeframes provide early positioning opportunities
Risk is defined based on structure (not arbitrary stops)
Higher timeframes eventually confirm or reject the thesis
Confirmation on daily adds conviction for position management
Key Lesson:
The 4-hour chart gave entry opportunity with tight risk. The daily chart now provides the validation that the trade thesis was correct. Traders who entered on 4H structure now have daily confirmation supporting continued upside.
📈 What the Daily Breakout Suggests:
Bullish Implications:
Next resistance target: Previous cycle highs now become the next logical objective
Momentum continuation: Daily breakout with momentum often sustains for multiple sessions
Support buffer: If price retraces, the breakout level should provide support
Trend clarity: Daily chart removes ambiguity - structure is now clearly bullish
Fibonacci Extensions:
From the correction low to breakout high, Fibonacci extension targets suggest:
1.272 extension: First projected resistance
1.618 extension: Major target zone where profit-taking typically occurs
2.0 extension: Extended target if momentum remains strong
These aren't guarantees but mathematical projections based on the measured move from consolidation.
🧠 Psychology of Early Entry vs. Breakout Chasing:
December 8th Entry (4H Structure):
Entry felt uncomfortable (price had just pulled back)
Risk was defined and relatively tight
Reward-to-risk was favorable (3:1 or better to first targets)
Required patience through consolidation period
Chasing Now (Post-Daily Breakout):
Entry feels "safer" (price is rising, daily confirms)
Risk has expanded significantly (stop would be much wider)
Reward has compressed (already moved toward targets)
Late entry often leads to getting shaken out on first retracement
The Professional Approach:
Buy structure on 4H when risk is defined. Use daily confirmation to hold position or add selectively, not to initiate at worse risk/reward.
📊 Current Trade Management Framework:
For Those In From December 8th:
Profit Taking Strategy:
First reduction: At previous major resistance (book partial profits)
Second reduction: At Fibonacci 1.618 extension (lock gains)
Final portion: Trailing stop or 2.0 extension (maximize upside)
Stop Management:
Move stops to breakeven after daily breakout confirmed
Trail stops below daily swing lows as new structure forms
Give daily structure room - don't tighten stops based on 4H noise
Position Psychology:
Daily confirmation means the trade thesis was correct. Avoid the temptation to overtrade or add aggressively here. The best risk/reward was on December 8th current management is about optimization, not aggressive scaling.
📅 What's Next?
Bullish Scenario:
Daily breakout continues with momentum
Price targets Fibonacci extensions sequentially
Minor retracements find support at breakout level
Volume remains elevated on green candles, diminishes on red
Retest Scenario:
Price pulls back to test breakout level as new support
This would be healthy consolidation, not failure
4H chart may provide re-entry or add opportunity
Daily structure remains intact unless breakout level fails
Invalidation:
Daily close back below breakout level
Volume deterioration suggesting exhaustion
Momentum divergence appearing on daily chart
Fundamental shifts in crypto market conditions
⚠️ Risk Considerations:
What Could Go Wrong:
Crypto Volatility:
Ethereum can experience 10-20% pullbacks even during bullish trends. Daily breakouts don't eliminate volatility - they suggest directional bias but not linear price action.
Market-Wide Weakness:
If Bitcoin enters correction or broader crypto sentiment shifts negative, individual coin technicals become secondary to market-wide flows.
False Breakout:
Daily breakouts can fail. If price closes back below the breakout level with volume, the technical picture changes and positions should be reassessed.
Regulatory/Fundamental Events:
Crypto markets remain sensitive to regulatory news, exchange issues, and macroeconomic factors that can override technical structure.
🏆 Key Trading Lessons from This Setup:
✅ Lower timeframes identify structure early: The 4H chart provided the early read when risk was defined
✅ Higher timeframes provide confirmation: Daily breakout validates the 4H thesis was correct
✅ Best entries feel uncomfortable: December 8th near support felt uncertain - that's when risk/reward was optimal
✅ Structure over emotion: The technical setup suggested bullish resolution despite uncertainty
✅ Patience pays: Allowing the 4H structure time to develop into daily confirmation requires discipline
✅ Manage, don't chase: Use daily confirmation for position management, not aggressive late entries
📌 Summary:
Then (December 8th):
4-hour chart showing structural setup
Support holding, accumulation visible
Entry opportunity with defined risk
Now (Current):
Daily chart confirms with clean breakout
Momentum supporting continued upside
Original thesis validated by higher timeframe
Next:
Monitor daily structure for continuation
Manage positions based on daily swing points
Watch for retest of breakout as potential support
⚠️ Important Disclaimers:
This analysis is for educational purposes and reflects a technical progression from 4-hour structure to daily confirmation. It is not financial advice or a recommendation to buy or sell Ethereum or any cryptocurrency.
Cryptocurrencies are highly volatile and speculative. Daily breakouts can fail, and past performance of similar setups does not guarantee future results. The December 8th call was based on structure visible at that time - subsequent price action could have invalidated the thesis.
Ethereum carries specific risks including regulatory uncertainty, technological vulnerabilities, market manipulation, and extreme volatility. Position sizing must account for potential 20-30% drawdowns even during bullish trends.
This review examines what happened after a technical call, not a prediction of future price movement. Markets change, structure fails, and no technical pattern guarantees success.
Always conduct independent research, manage risk appropriately, and never invest more than you can afford to lose. All cryptocurrency trading involves substantial risk of loss.
✨ Community Discussion:
Did you catch the December 8th setup on the 4H chart? How do you use multi-timeframe analysis in your trading? Share your approach to transitioning from lower to higher timeframe confirmation.
📜 Read the structure. Trust the process. Manage the risk.

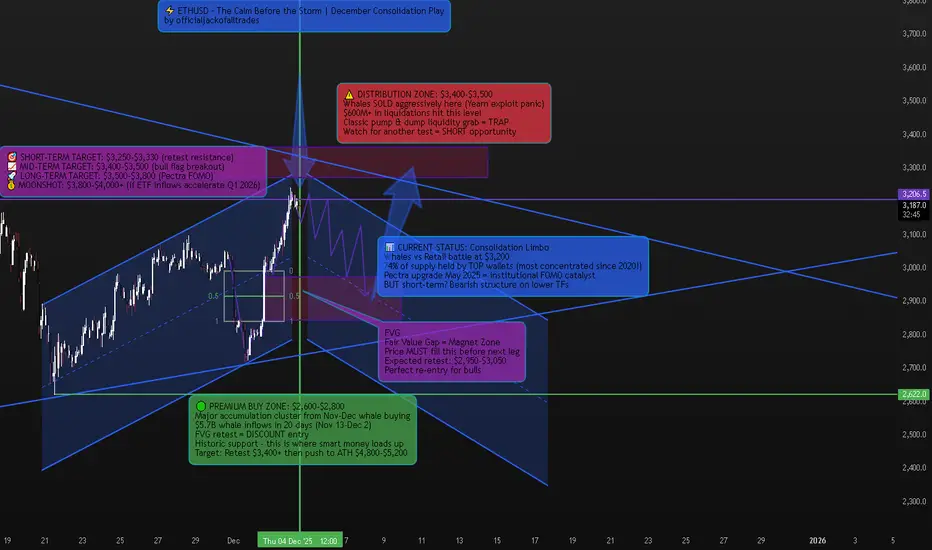
ETHUSD – The Calm Before the Storm | December's Most Misundersto📈 Market Context – Why Everyone's Wrong About ETH Right Now
Ethereum is sitting at one of the most deceptive price levels in crypto right now. Most traders see the recent dump from $3,762 on December 2 and think "it's over." Others see the consolidation around $3,208 and think "dead cat bounce."
They're both missing the bigger picture.
Here's what ACTUALLY happened: A 2015 Ethereum ICO wallet that had been inactive for a long time moved 40,000 ETH suddenly, worth around $120 million. Crypto Twitter panicked. But then Lookonchain verified that it was for internal transfer, and not a liquidation. Classic FUD.
What REALLY tanked ETH? A Yearn Finance exploit that happened at the worst possible time, when the market was stretched by leverage and rising speculative positioning. More than $600 million in crypto liquidations hit the market. This wasn't an organic selloff—this was a leveraged washout.
But here's the kicker: While retail was panic-selling, whales were accumulating like it's 2020 all over again.
🔎 Technical Framework – The Deceptive Calm
Current State:
Ascending broadening wedge inside rising channel—classic volatility compression before explosive move
Key Liquidity Zones:
🔴 Distribution Liquidity Zone (SHORT Opportunity):
$3,550 - $3,650 (recent spike high + whale distribution cluster)
This is where whales moved 40,000 ETH at $120 million valuation before the "transfer" narrative
Since December 2024, aggressive selling by whales has been evident in the rise of average market order sizes
🟢 Accumulation Liquidity Zone (BUY ORIGIN):
$2,900 - $3,000 (FVG retest + November-December whale buy zone)
From November 13 to December 2, whales acquired a total of 1,702,835.5 ETH at an average price of $5.7 billion
In early 2025, large holders acquired over 330,000 ETH, valued at approximately $1.08 billion
⚖️ Chop Zone (NO TRADE ZONE):
$3,100 - $3,400 (current consolidation limbo)
This struggle between institutional investors and retail traders could define Ethereum's price action in the coming weeks
🐋 WHALE ACTIVITY – The REAL Story Nobody's Talking About
While everyone's focused on the dump, let me show you what the ACTUAL data says:
The Accumulation Phase (That Everyone Missed):
Ethereum whale wallets have recorded positive netflows in each of the last 20 trading days, dating back to November 13
The highest single-day inflows of 2570 ETH came on November 14 when Gensler's exit was confirmed
Ethereum ETFs attracted $2.63 billion in inflows in December 2024, led by the Fidelity Ethereum Trust
The Concentration Effect (This is MASSIVE):
Over the past four months, Ethereum's Gini coefficient increased from 0.7563 in September to 0.7630 in December 2024—a clear sign of growing ownership concentration. Translation? Whales are consolidating control.
Even crazier: Addresses holding 10,000+ ETH now control 74.47% of Ethereum's circulating supply. Compare that to Bitcoin where large holders control only about 15%—ETH is FIVE TIMES more whale-controlled than BTC.
This is why ETH moves are so violent and why large transfers or sales by a tiny fraction of holders can rapidly sway Ethereum's price and sentiment.
The Distribution Signal:
But here's where it gets interesting: Since December 2024, there has been an increase in aggressive sell orders, particularly from whales, with rising average market order sizes suggesting they are offloading holdings.
So what gives? Are whales accumulating or distributing?
BOTH. They're accumulating at discount levels ($2,900-$3,050) and distributing at premium levels ($3,550-$3,650). This is classic smart money behavior—they're range-trading the volatility while retail gets chopped.
🚨 Recent Developments – The Catalyst Stack
Pectra Upgrade – May 7, 2025 (GAME CHANGER)
The Pectra upgrade went live in May 2025, introducing batch transactions, gas payment in any token, and doubling blob capacity for Layer 2s.
Key improvements:
Account Abstraction enables gas payments using multiple tokens like USDC and DAI, with third-party fee sponsorship
EIP-7691 doubles Ethereum's blob throughput from three blobs with a maximum of six to six with a maximum of nine
With the Pectra upgrade, Ethereum's data capacity significantly increases to about 420 TPS from 210 TPS
Translation: ETH just became TWICE as fast for Layer 2s. This is MASSIVE for scalability and will drive institutional adoption.
ETF Inflows – The Silent Accumulation
Ethereum ETFs attracted substantial institutional interest, with inflows reaching $2.63 billion in December 2024. This is institutional money positioning for the next leg up—they don't buy at tops, they buy at bottoms.
Gary Gensler Exit – Regulatory Tailwind
The impending exit of SEC chairman Gary Gensler enhanced investor confidence in the altcoin sector, putting Ethereum in prime position to deliver superior performance relative to BTC.
Staking Explosion
Staking activity reached near-all-time highs, with 36.19 million ETH locked in validators—a 4.5% increase since October 2024. That's $115+ BILLION locked away, reducing circulating supply.
DeFi TVL At $90 Billion
Total Value Locked in Ethereum protocols surged to $90 billion, driven by renewed interest in yield-bearing DeFi products. Institutional money is FLOODING into ETH DeFi.
🎯 Trade Plans – High-Probability Setups
🟢 BUY ETHUSD: $2,900 - $3,000 | SL $2,820
Thesis: FVG retest at proven whale accumulation zone + November-December $5.7B whale buying cluster = institutional re-entry point
Entry Rules (MUST WAIT FOR CONFIRMATION):
Price dips into $2,900-$3,000 FVG zone
Bullish CHoCH (Change of Character) + BOS (Break of Structure) on H1-H4
Strong bullish rejection wick with volume spike (100K+ ETH volume on 4H)
Ideally on Order Block retest after initial bounce
BONUS CONFIRMATION: Check whale netflow data on IntoTheBlock—if showing positive inflows, ADD to conviction
Targets:
$3,350 - $3,400 (mid-channel retest, quick 12-15% gain)
$3,600 - $3,750 (previous high retest + distribution zone, 23-28% gain)
$4,200 - $4,500 (bull flag breakout + Pectra FOMO begins, 42-50% gain)
$5,200 - $5,800 (ATH retest + full bull market confirmation, 75-95% gain)
Moonshot: $6,500+ (if ETF inflows accelerate post-Pectra like BTC did)
Risk Management:
Position size: 3-5% of portfolio (this is a HIGH-CONVICTION setup)
Scale in 40% at $3,000, 30% at $2,950, 30% at $2,900
Trail stop to breakeven after hitting Target 1
Take 30% profit at Target 2, let rest ride with trailing stop
🔴 SELL ETHUSD: $3,550 - $3,650 | SL $3,750
Thesis: Premium liquidity retest at proven whale distribution zone—classic "return to scene of crime" before deeper correction
Entry Rules (WAIT FOR CONFIRMATION):
Price pumps into $3,550-$3,650 zone (previous spike high)
Bearish CHoCH + MSS (Market Structure Shift) + BOS down on H1-H4
CRITICAL: Check CryptoQuant whale-to-exchange flow—if showing HIGH exchange inflows (whales moving ETH to exchanges to sell), this is your GO signal
Heavy volume spike on bearish candle (150K+ ETH on 4H)
Entry after FVG fill or Order Block retest post-initial rejection
Targets:
$3,200 - $3,250 (first support retest, quick 8-12% gain)
$3,050 - $3,100 (mid-channel support)
$2,900 - $3,000 (FVG zone—BUY setup reactivates here!)
Risk Management:
This is a COUNTER-TREND trade—use tighter stops
Position size: 2-3% max (smaller than long setup due to higher risk)
Take 50% profit at Target 1, move SL to breakeven
Exit FULLY at Target 3 and flip to LONG setup
⚠️ Risk Management & Critical Notes
The #1 Mistake: Trading inside the $3,100-$3,400 chop zone without confirmation. The struggle between institutional investors and retail traders in this range creates whipsaw conditions this is where retail accounts get DESTROYED.
Whale Flow Monitoring is NON-NEGOTIABLE: High leverage remains with funding rates indicating very high risk-taking activities and markets still inclined towards speculative long positions. Use Glassnode or IntoTheBlock to monitor whale exchange inflows BEFORE entering trades.
Volatility Warning: This concentrated ownership structure means large transfers or sales by a tiny fraction of holders can rapidly sway Ethereum's price. Set alerts for 10,000+ ETH whale movements on Whale Alert.
Macro Headwind: Japan has indicated tightening, and U.S. real interest rates remain high. Under low liquidity conditions, even minor shocks can trigger significant price changes. If SPX dumps 5%+, ETH follows—be ready to cut positions.
Position Sizing: Given the extreme whale concentration, never go all-in. Scale positions at key levels. This isn't a casino—it's warfare against billion-dollar players.
📊 The Bottom Line – Why This Time Is Different (Or Isn't)
Let me give it to you straight: ETH is at a crossroads.
The Bull Case (What I'm Leaning Toward):
✅ $5.7 billion in whale accumulation over 20 days since November 13
✅ $2.63 billion in ETF inflows in December 2024
✅ $90 billion TVL in DeFi protocols institutions are building
✅ Pectra upgrade doubled transaction throughput to 420 TPS
✅ 36.19 million ETH staked = reduced supply
✅ Gary Gensler gone = regulatory tailwind
✅ Technical structure: Rising channel still intact, FVG below = perfect retest setup
The Bear Case (What Keeps Me Up at Night):
⚠️ Aggressive whale selling since December with rising average market order sizes
⚠️ Even as Bitcoin and Solana hit all-time highs after Trump's election, Ether topped out at $4,000 in December, well short of its 2021 high of $4,800
⚠️ High leverage with funding rates indicating very high-risk speculative long positions
⚠️ Global liquidity tightening from Japan and high U.S. real interest rates
⚠️ 74.47% of supply controlled by whales = extreme manipulation risk
⚠️ Price underperforming BTC and SOL = capital rotation away from ETH
My Take:
The $5.7 billion whale accumulation since November 13 tells me smart money is positioning for a move. But the aggressive whale selling at premium levels tells me they're range-trading, not accumulating for a straight pump to $10K.
Here's the play:
Short-term (Dec-Jan): Expect consolidation with violent swings. Trade the range: buy $2,900-$3,000, sell $3,550-$3,650.
Medium-term (Feb-April): After Pectra hype builds + ETF inflows accelerate, we get the push to $4,200-$4,800.
Long-term (Mid-2025+): If ETH breaks $4,800 ATH with volume, we're going to $5,800-$7,000+.
BUT: If ETH breaks below $2,850 with volume, the bull case is dead and we're heading to $2,600-$2,400 to fill lower FVGs.
🔥 Strategy Summary – How I'm Trading This
Phase 1 (NOW - January):
Wait for dip to $2,900-$3,000 FVG zone
Scale in long position (3-5% of portfolio)
Target: $3,600-$3,750 for 25-30% gain
Take 30% profit, trail stop on rest
Phase 2 (If we hit $3,600+):
Watch whale exchange inflows
If HIGH inflows (distribution signal) → SHORT at $3,550-$3,650
If LOW inflows (holding) → add to longs, target $4,200-$4,500
Phase 3 (Post-Pectra Hype, March-May):
If ETH holds above $3,600 and Pectra adoption is strong → go HEAVY long
Target: ATH breakout to $5,200-$5,800
This is the "generational wealth" move IF it plays out
Invalidation:
Close ALL longs if ETH closes below $2,850 on daily
Flip bearish, target $2,600-$2,400
💡 Final Word – The Truth About ETH Right Now
ETH isn't "dead." But it's not "mooning tomorrow" either.
Critics have blasted developers' decision to focus on Layer 2 blockchains, arguing those chains siphon value from ETH. That's a real concern. ETH isn't pumping like BTC or SOL because value is flowing to L2s.
But here's the counterargument: With the Pectra upgrade, this will double L2 performance out of the gate, leading to lower costs and faster transaction times. If L2s explode in adoption, ETH benefits as the base layer. It's like owning the toll road, not the cars.
The Question: Will the $2.63 billion in ETF inflows and $5.7 billion in whale accumulation be enough to push ETH to new ATHs? Or will whale distribution at premium levels and high leverage markets cause another violent shakeout first?
My bet: One more shakeout to $2,900-$3,000 (FVG retest), THEN the real pump begins. But I'm not holding through a breakdown below $2,850. That's where I cut and flip bearish.
Trade the structure. Follow the whales. Protect your capital.
Drop a 🔥 if you're watching that $2,900-$3,000 FVG like a hawk. This is where fortunes are made or lost.
The rally is back: from Ethereum to Toncoin!Recently, the pairs ETHUSD, TONUSD, LNKUSD, ADAUSD, and AAVUSD have been climbing amid improving market sentiment and inflows into ETFs — including spot ETFs (funds that buy the underlying asset itself rather than derivatives). Investors are reacting to ecosystem news and protocol upgrades that enhance the real utility of networks. As a result, the market has received fresh momentum: demand is expanding, and prices are following.
Five Growth Factors:
ETHUSD (Ethereum +15.3%) — Supported by inflows into spot ETFs and heightened developer activity around network upgrades, which strengthened buyer interest (spot ETFs are funds that directly hold ETH).
TONUSD (Toncoin +9.7%) — User growth driven by Telegram mini-apps and attention campaigns like SERA (a gaming/social ecosystem event; SERA is the initiative’s name) is expanding the user base.
LNKUSD (Chainlink +13.9%) — Adoption of CCIP (a cross-chain messaging and value transfer protocol) continues to grow, including through bridges (technology that transfers assets between networks) — on December 4, the Base–Solana bridge was announced (Base and Solana are blockchains; the bridge connects them).
ADAUSD (Cardano +16.2%) — December saw the launch of Midnight/NIGHT (Midnight is a privacy-focused sidechain — a separate network alongside the main one; NIGHT is its token). This gave Cardano a real new feature: private transactions and business-ready smart contracts.
AAVUSD (Aave +15.8%) — Progress toward protocol version v4 (the fourth major upgrade enhancing flexibility and reducing client risk): a public testnet and preparation for the mainnet are heating up expectations around functionality and token economics.
If interest in Ethereum ETFs remains strong, Ethereum can maintain its momentum. Toncoin benefits from easy access through Telegram apps; Chainlink gains strength as more services adopt its cross-chain “translator,” enabling secure data and token transfers; Cardano benefits from having a dedicated private network for business use cases; and Aave grows on expectations surrounding its upcoming core protocol upgrade.
FreshForex analysts note that in the coming weeks, the performance of ETH, TON, LINK, ADA, and AAVE will depend on three factors: sustained inflows into Ethereum-backed ETFs, real user and use-case growth (TON via Telegram mini-apps; LINK as the “connector” between blockchains), the pace of technological rollouts (the Midnight private network in the Cardano ecosystem and Aave’s transition from testing to the full v4 release). Investors are advised to maintain strict risk management and monitor the macroeconomic calendar.

eth is poised to go below 2k into january.gm,
as we near the holidays, and many people begin to believe that the bottom is in,
i see a scenario that few are discussing.
all i hear these days is how qe is beginning, how rates are getting cut, and how crypto adoption is taking place globally, but the price action does not reflect this sentiment, yet.
the main reason for this, in my opinion, is i believe we're in a corrective move; specifically, the 4th wave, of this 5 waves down from the recent all time highs.
---
4th wave are categorized the moves which trap the most amount of traders. they create uncertainty, after an already long downtrend, and people start entering into a state of hopium \ complacency one final time before the last flush out takes place in the trend.
that flushout, is designed to push all of the complacency and hopium out of the market by a large institution, who preys on the stops + liquidations of the small traders for liquidity purposes.
---
which brings me to my point here;
i believe ethereum will sweep the november low one more time, before some sort of sustained uptrend begins. whether that uptrend will be corrective, or impulsive will be determined by how we begin to come up. i have a few theory-crafts about what this move down could be, and even how it could be marking the end of a flat, rather than the beginning of the highly anticipated bear market that everyone keeps talking about.
---
🎯 = low 2k region

$ETH about to outperform BitcoinHey traders!
These last three months have been marked by a sticky uncertainty. During this cycle, one thing has been very clear: Bitcoin has continuously outperformed all altcoins (including Ethereum).
However… is it finally time for Ethereum and the altcoins to enter a rally?
The truth is that this uncertainty was purely liquidity-driven, and with the current rate cuts and the slowdown in QT, medium- to long-term liquidity is likely to expand.
As we all know, this tends to benefit higher-risk assets — meaning $ETH.
That’s why, unless we see a crash, I believe it’s likely we’ll get a clearly bullish move this December and even into January (including for altcoins).

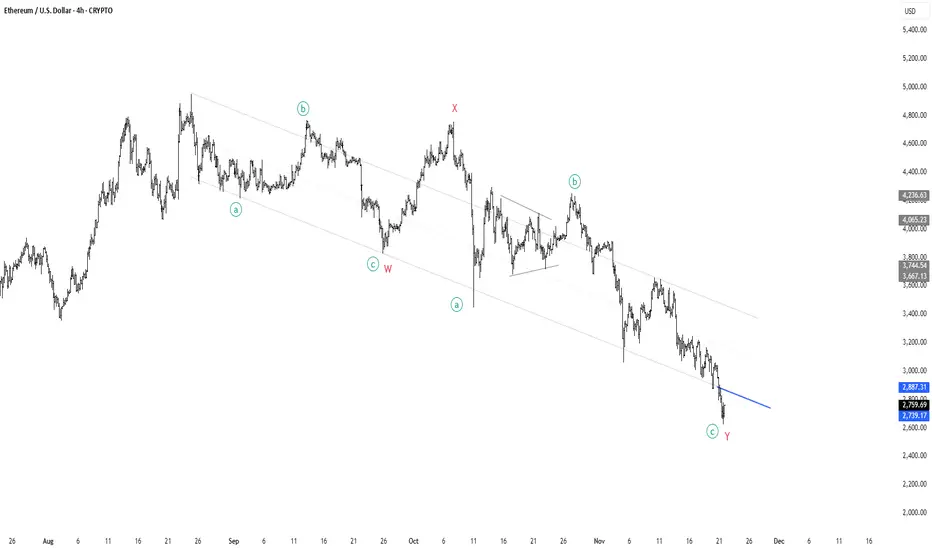
ETH to all time high! Lets go!🚨 ETH Elliott Wave Update 🚨
What we’re looking at here is a clean W-X-Y complex correction unfolding over months — a classic structure when the market wants to correct deeper without breaking the macro trend.
• Wave W completed with an ABC decline
• Wave X gave us the relief rally everyone thought was the bottom ❌
• Wave Y extended lower, subdividing into a-b-c, pulling price into the lower boundary of the corrective channel
Now we’re sitting right at the end of minor wave c of Y, the final leg of this entire structure. The pattern is mature, sellers look exhausted, and the downtrend channel is tightening — perfect conditions for a potential reversal.
🔵 The blue trendline is the key.
If ETH can punch through that level with momentum, it confirms the entire WXY correction is complete and opens the door for a major impulsive leg upward.
💥 Break the blue line → reclaim macro structure →
I believe ETH will begin the march toward new all-time highs.
This is where long-term bottoms historically form:
deep structure, clean proportions, fading downside velocity, and a clear invalidation level.
📈 Eyes on the breakout.
ETH Trade Plan (December 10, 2025)ETH Trade Plan (December 10, 2025)
(D1 / H4 / H1 / M15)
⬛️ 1. Higher Timeframe Context (D1 and H4)
• D1 bias: bullish
• D1 range (approx): $3,000 – $4,000
• Key D1 zones:
• Supply: $3,800–$4,000 (historical resistance)
• Demand: $3,000–$3,300
• H4 bias: buy dips
• H4 zones of interest:
• H4 Sell Zone 1: – highs cluster
• H4 Buy Zone 1: – OB + demand
Active setups are trend-aligned with D1/H4.
⬛️ 2. Preferred Setups by Horizon
🔳 2.1 Swing Setup (D1/H4)
• Idea: Buy dips to $3,300 for $4,000+ (trend-aligned).
• Time horizon: multi-day.
• Context: Macro risk-on + on-chain strength.
🔲 2.2 Intraday Setup (H1 focus)
• Idea: Long above $3,370.
• Time horizon: intraday.
• Context: H4 impulse + rally regime.
▫️ 2.3 Scalp Setup (M15 focus)
• Idea: Buy pullbacks to $3,350 with absorption.
• Time horizon: minutes–hours.
▪️ 2.4 Arbitrage/Pairs Concept (if relevant)
• Long ETH/BTC – outperforming bias.
⬛️ 3. Entry Zones and Triggers
🟩 3.1 Long Setup (Trend-Aligned)
• Execution timeframe: H1
• Trigger timeframe: M15
• Entry zone:
• Context: H4 demand, whale flows supportive.
• Pattern tags:
Trigger conditions:
• Reclaim above $3,370 with positive delta.
• ML-Predictive (15m): upside ≥ downside.
• No extreme risk flags.
🔴 4. Stops (Invalidation Levels)
Long setups:
• Stop: $3,300.
• Logic: Break of demand; idea wrong below.
🟢 5. Targets
Long:
• TP1: $3,500 – H1 extension.
• TP2: $3,800 – H4 supply.
• TP3 (optional): $4,000 – D1 objective.
⬛️ 6. Position Sizing
• Baseline risk:
• Trend-aligned setups: 1.0.
• Adjust: low uncertainty + high alignment.
Final: 1.0 for trend long.
⬛️ 7. Risk Flags
• Put skew volatility.
• Fed event risk.
• High OI crowding.
⬛️ 8. Flip Conditions
• Long to bear: Close below $3,300 + negative funding.
⬛️ 9. Alternative Scenario
Rejection at $3,800: double top, short zone $3,750–$3,800, stop $3,850, targets $3,500/$3,300. Differs as failed breakout vs continuation.
⬛️ 10. Model Self-Critique
• Assumptions: Rally sustains on macro, no Fed surprise.
• Vulnerabilities: Sudden risk-off, misinterpreted flows.
• Do not chase highs without confirmation.
⬛️ 11. Uncertainty and Constraints
• Uncertainty.level: low.

ETHUSD H1 | Bullish Bounce Off Pullback SupportMomentum: Bullish
Price is currently above the ichimoku cloud.
Buy entry: 3,226.27
- Pullback support
- 50% Fib retracement
Stop Loss: 3,083.94
- Multi-swing low support
Take Profit: 3,380.09
- Overlap resistance
High Risk Investment Warning
Stratos Markets Limited (tradu.com/uk ), Stratos Europe Ltd (tradu.com/eu ):
CFDs are complex instruments and come with a high risk of losing money rapidly due to leverage. 70% of retail investor accounts lose money when trading CFDs with this provider. You should consider whether you understand how CFDs work and whether you can afford to take the high risk of losing your money.
Stratos Global LLC (tradu.com/en ): Losses can exceed deposits.
Please be advised that the information presented on TradingView is provided to Tradu (‘Company’, ‘we’) by a third-party provider (‘TFA Global Pte Ltd’). Please be reminded that you are solely responsible for the trading decisions on your account. Any information and/or content is intended entirely for research, educational and informational purposes only and does not constitute investment or consultation advice or investment strategy. The information is not tailored to the investment needs of any specific person and therefore does not involve a consideration of any of the investment objectives, financial situation or needs of any viewer that may receive it. Past performance is not a reliable indicator of future results. Actual results may differ materially from those anticipated in forward-looking or past performance statements. We assume no liability as to the accuracy or completeness of any of the information and/or content provided herein and the Company cannot be held responsible for any omission, mistake nor for any loss or damage including without limitation to any loss of profit which may arise from reliance on any information supplied by TFA Global Pte Ltd.

ETHUSD H1 | Bullish Breakout Off Pullback SupportMomentum: Bullish
Price is currently above the ichimoku cloud.
Buy entry: 3,129.51
- Pullback support
- 23.6% Fib retracement
Stop Loss: 3,075.69
- Swing low support
Take Profit: 3,225.90
- Swing high resistance
High Risk Investment Warning
Stratos Markets Limited (tradu.com/uk ), Stratos Europe Ltd (tradu.com/eu ):
CFDs are complex instruments and come with a high risk of losing money rapidly due to leverage. 70% of retail investor accounts lose money when trading CFDs with this provider. You should consider whether you understand how CFDs work and whether you can afford to take the high risk of losing your money.
Stratos Global LLC (tradu.com/en ): Losses can exceed deposits.
Please be advised that the information presented on TradingView is provided to Tradu (‘Company’, ‘we’) by a third-party provider (‘TFA Global Pte Ltd’). Please be reminded that you are solely responsible for the trading decisions on your account. Any information and/or content is intended entirely for research, educational and informational purposes only and does not constitute investment or consultation advice or investment strategy. The information is not tailored to the investment needs of any specific person and therefore does not involve a consideration of any of the investment objectives, financial situation or needs of any viewer that may receive it. Past performance is not a reliable indicator of future results. Actual results may differ materially from those anticipated in forward-looking or past performance statements. We assume no liability as to the accuracy or completeness of any of the information and/or content provided herein and the Company cannot be held responsible for any omission, mistake nor for any loss or damage including without limitation to any loss of profit which may arise from reliance on any information supplied by TFA Global Pte Ltd.
