ETH Price Action Looks Heavy – Danger Ahead?This chart is showing a clear pattern of accumulation followed by decline. Every time price moves sideways in a box range, instead of breaking upward with strength, it rolls over into another drop.
What this tells us is that the market is using these sideways phases as resting points for sellers to reload, not buyers to take control. Until CRYPTOCAP:ETH can break out of this cycle and hold above one of these consolidation zones, the overall trend remains heavy to the downside.
DYOR, NFA
#PEACEFUL
Follow for more updates and market insights on TradingView
Ethereum (Cryptocurrency)

MUBARAK/USDT — Confluence Accumulation Zone?🔎 Overview
MUBARAK/USDT is currently testing the critical support zone (0.022 – 0.028 USDT), which aligns with a medium-term ascending trendline. This confluence makes the area a decisive “do or die” zone: either a strong rebound that may trigger a reversal, or a confirmed breakdown that could push prices much lower.
---
📍 Key Technical Levels
Current Price: ≈ 0.0298
Main Support Zone (yellow box): 0.022 – 0.028
Critical invalidation support: 0.0208
Resistances:
R1 = 0.03862
R2 = 0.04299
R3 = 0.04999
R4 = 0.06630
---
🧩 Structure & Patterns
1. Accumulation zone: price repeatedly bounced within 0.022–0.028, suggesting active buyers.
2. Ascending trendline: supports higher lows on the mid-term structure.
3. Lower highs still dominate → bulls need a breakout above 0.0386 to flip the structure.
4. Potential double bottom: a strong rejection here could mark a classic bullish reversal.
5. Breakdown scenario: a daily close below 0.022 with volume = bearish continuation toward 0.0208 → 0.0164.
---
🚀 Bullish Scenario
Confirmation signals:
Strong rejection candle (long lower wick + close above zone).
Volume expansion.
Daily close above 0.0386.
Upside targets:
TP1 = 0.03862
TP2 = 0.04299
TP3 = 0.04999
TP4 = 0.06630
Strategy:
Conservative entry on retest after rejection.
SL below 0.0208.
Scale out profits gradually.
---
⚠️ Bearish Scenario
Confirmation signals:
Daily close below 0.022 with strong volume.
Failed retest (support turns resistance).
Downside targets:
S1 = 0.02080
S2 = 0.01640
Strategy:
Cut longs if breakdown is confirmed.
Aggressive traders may short toward 0.0208 → 0.0164.
---
📑 Entry Checklist
1. Wait for daily close confirmation (not intraday wick).
2. Volume above average.
3. Successful retest (support ↔ resistance flip).
4. RSI divergence or recovery.
5. MACD bullish cross / rising histogram.
6. BTC & overall altcoin sentiment aligned.
---
🛡️ Risk Management
Risk per trade: 1–2% of total capital.
Use SL strictly below 0.0208 for longs.
Move SL to breakeven after TP1.
Accumulation zones often produce false breaks → do not enter without confirmation.
---
🌍 Market Context
Altcoins remain correlated with BTC: a BTC rebound could boost upside potential.
On-chain events (token unlocks, listings, or major news) may drive volatility.
Liquidity is thin → expect high volatility and manage position sizes accordingly.
---
📌 Conclusion
MUBARAK is at a golden zone of decision: a confirmed rejection could spark a +100% rally toward 0.066, while a breakdown would likely drag it back to 0.0208 or even 0.0164.
This is where market makers and big players decide the next major move — patience and risk control are key.
---
#MUBARAK #MUBARAKUSDT #CryptoAnalysis #Altcoins #SupportResistance #BreakoutWatch #RiskManagement

ASTERUSDT — Will Buy Zone Hold or Break?Overview
ASTER price is currently consolidating after a strong rally toward 2.42. On the 2-hour chart, we can clearly see two major highlighted areas: Buy Zone 1 (primary support) and Buy Zone 2 (deeper secondary support).
The structure still maintains a potential bullish continuation, but repeated weakness around support indicates risk of a breakdown if buyers fail to defend the current zone.
---
🔑 Key Levels
Nearest Support (Buy Zone 1): 1.75 – 1.95
Secondary Support (Buy Zone 2): 1.25 – 1.45
Minor Resistance: 2.12
Major Resistance: 2.33 – 2.42 (previous supply zone / local high)
Current Price: 1.91
---
📐 Technical Pattern
1. Bullish Flag / Rectangle
A sideways consolidation after a strong uptrend move, often a continuation pattern. A confirmed breakout to the upside could lead to a retest of 2.42.
2. Multiple Support Tests at Buy Zone 1
Several rejections at 1.8 – 1.9 confirm this zone as a critical short-term demand area. However, the more often a support is tested, the weaker it becomes.
3. Lower Highs Formation
Minor lower highs suggest mild selling pressure. This structure often precedes either a breakout or a breakdown, depending on which side gets taken out.
---
🚀 Bullish Scenario
Confirmation: A 2H close above 2.12 with rising volume.
Targets:
TP1 = 2.12 (breakout retest)
TP2 = 2.33
TP3 = 2.42 (previous high)
Extended Target: If 2.42 breaks, next psychological resistance sits around 2.80 – 3.00.
📌 Bullish entry ideas:
Aggressive: Buy within Buy Zone 1 with stop loss below 1.75.
Conservative: Wait for breakout above 2.12 + confirmed retest.
---
🐻 Bearish Scenario
Confirmation: A 2H close below 1.75 (breakdown from Buy Zone 1).
Targets:
TP1 = 1.50
TP2 = Buy Zone 2 (1.25 – 1.45)
Extended Target: If Buy Zone 2 fails, the structure shifts into a downtrend, potentially moving closer to 1.00.
📌 Bearish entry idea:
Enter short after breakdown (close <1.75), with stop above 1.95 (former support turned resistance).
---
📊 Risk Management
Always set stop losses below support (for longs) or above breakdown (for shorts).
Scale out profits at key resistance levels.
Keep risk per trade ≤2% of total capital.
---
⚠️ Things to Watch
False breakouts: Require volume confirmation.
Correlation with BTC/ETH: Broader market moves can strongly influence ASTER’s direction.
High volatility: Fakeouts may occur before the real move.
---
📌 Conclusion
As long as price holds above Buy Zone 1, the bullish continuation toward 2.12 – 2.42 remains valid.
A breakdown below 1.75 would invalidate the short-term bullish case and open the door toward Buy Zone 2.
Key decision point is very close — watch carefully for breakout or breakdown confirmation.
---
#ASTER #ASTRUSDT #CryptoAnalysis #BuyZone #SwingTrade #PriceAction #SupportResistance #BullishScenario #BearishScenario

ETHEREUMAfter the liquidation caused the price of the cryptocurrency to fall, Ethereum managed to break 4000 again, this is now a support region, following the upward trend line, Ethereum goes to 4100

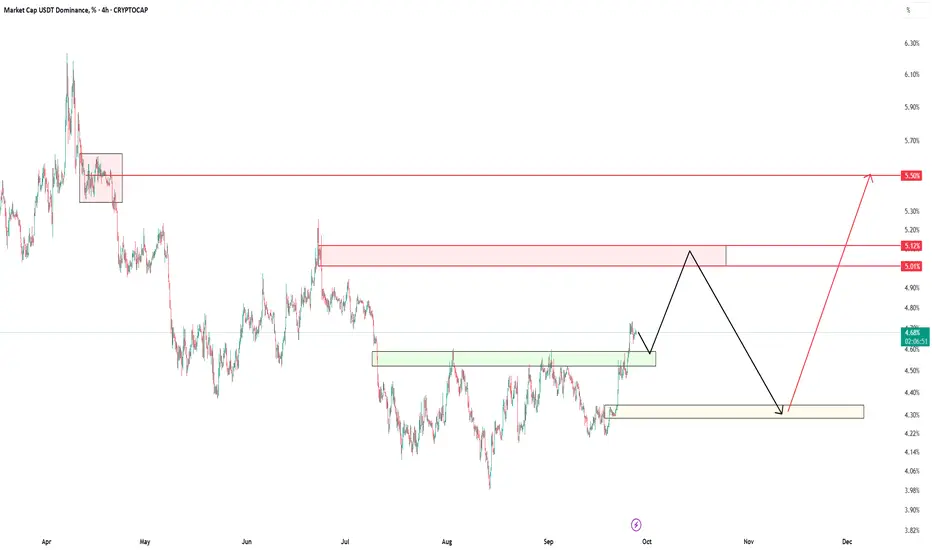
#USDT.D (4H Chart)#USDT.D
(4H Chart)
🔹️ USDT Dominance Analysis 🔹️
USDT dominance usually moves in the opposite direction of Bitcoin — when Bitcoin rises, this index tends to fall, and vice versa.
🟢 Green Box (Current Support)
The current support level for USDT dominance is in the green box: 4.60 – 4.50%.
We expect the price to move toward this level first, and after touching it, head toward the red box.
🟥 Red Box (Main Resistance)
The red box is at 5.00 – 5.12%.
This is the first and most important resistance level ahead.
After reaching this level, a correction is expected back toward the yellow box.
🟡 Yellow Box (Key Support)
The yellow box sits at 4.30%, which is a strong support area.
Once this level is tested, a major bullish move in USDT dominance is expected, targeting around 5.50%.
🎯 Final Target
When USDT dominance reaches 5.50%, the crypto market will likely be near its price bottoms.
💡 These bottoms could approximately align with Bitcoin around $85,000 and Ethereum around $3,000.
🆔 @RasoolAhmadi
ETHUSD Weekly Scenarios BullsWeekly Scenarios
Bulls
If ETH holds support at $4,200 and manages to rebound above the $4,500-4,600 resistance, we can expect a rally to $5,000 and beyond.
Sideways/Consolidation
The price may remain stuck in the $4,200-4,600 range until the market finds enough signal or volume to break out.
Bears
A breakout below $4,200 with volume confirmation will lead to a decline to $3,800 and below.

ETHEREUM HIGH PROBABILITY SETUP SOON!!!🚨 ETHER HIGH PROBABILITY BUY SETUP 🚨
* Here We Can See Clearly The Next Potential Moves For ETHUSD Coming Hours/Days.
* Keep Your Eyes Close On Your Trading Positions.
* Happy PIP Hunting Traders.
FXKILLA.

ETH 4H Analysis - Key Triggers Ahead | Day 28❄️ Welcome to the cryptos winter , I hope you’ve started your day well.
⏰ We’re analyzing BINANCE:ETHUSDT on the 4-Hour timeframe .
👀 On the 4-hour chart, after the recent drop, Ethereum managed to hold above $3,900 thanks to support from its maker-buyer zone. Price is currently trading below a key resistance at $4,034. A breakout and confirmation above this level could lead ETH toward its next major trend-shift resistance.
The primary resistance for initiating a new bullish leg sits at $4,133. A break and stabilization above this zone could trigger a solid upside move, potentially extending toward the $4,800 area.
🧮 The RSI oscillator shows that during the recent sell-off, ETH dipped twice into deep oversold territory, with significant time spent under selling momentum. The key RSI zone now is the 50 baseline, which acts as resistance. A momentum break above this level would support price stabilization over $4,034, and allow ETH to retest and potentially break its resistance on the way to the overbought zone.
🕯 The candle size and volume on the rebound from the maker-buyer support have been reasonably strong, suggesting that ETH has likely established a key floor around $3,837. As price approached the $4,034 resistance, red candles have become smaller — signaling weakening bearish pressure and absorption of sell orders at that zone.
Given the weekend environment, volume has cooled off, and price is moving in a range. With the start of the new week, increased volume could spark a breakout, and trader reaction on ETH may be notable.
💸 The BINANCE:ETHBTC pair is also sitting below a key resistance zone. A breakout and confirmation here could shift ETH’s trading behavior and momentum. On RSI, the pair is around the 50 level, showing reduced volatility due to weekend conditions.
The first key resistance is at 0.03687. A breakout and confirmation above this level could support a long setup on ETH. However, the critical resistance sits at 0.03853 — which aligns with the pair’s overbought potential. Breaking and stabilizing above that level would likely trigger notable bullish continuation, but only if RSI enters the overbought zone as confirmation.
🧠 Since CRYPTOCAP:USDT.D recently rejected from 4.72% and Bitcoin has shown some support, Ethereum now holds a reliable floor that can be used for long setups once the specified resistances break. Two main scenarios are in play:
1️⃣ Scenario 1: We need a higher-timeframe candle close above key resistance, starting with $4,034, which also aligns with RSI’s 50-level resistance.
After that, spotting a multi-timeframe indecision candle could allow an entry with controlled risk.
Upon a confirmed break of the major resistance at $4,133, or signs of trend reversal, additional position size can be added.
Essentially, we require a higher low above $4,034, enabling formation of a higher high and eventual breakout through $4,133.
2️⃣ Scenario 2 : A short on ETH is less favorable due to strong buying interest at current levels and weaker risk-to-reward. However, if price breaks and confirms below the key support and maker-buyer zone, a deeper correction could follow.
❤️ Disclaimer : This analysis is purely based on my personal opinion and I only trade if the stated triggers are activated .

My only remaining hope for Ethereum !!!My only remaining hope for Ethereum is this PRZ. If the price holds this level, it could rise above $5000 otherwise, you know what will happen if this level breaked...

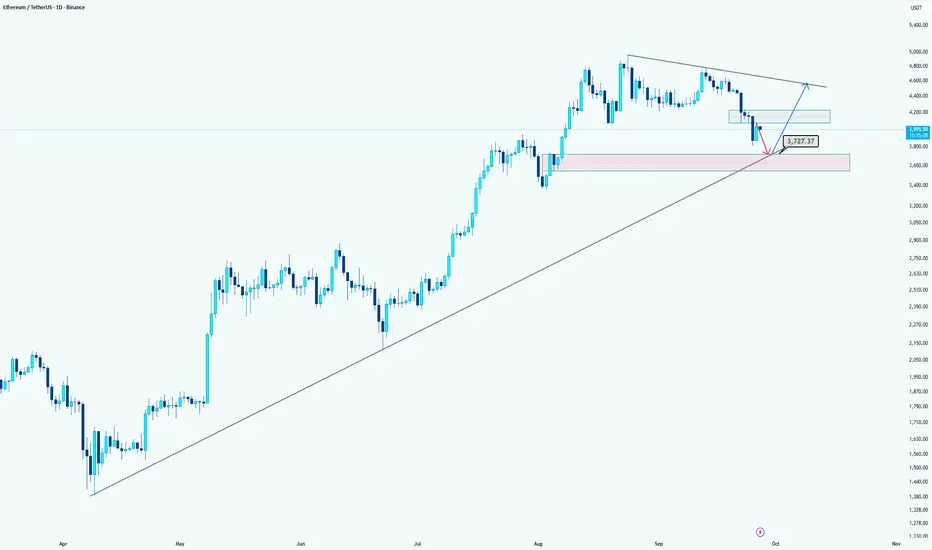
Ethereum: Levels to WatchHi guys!
Ethereum is currently showing weakness after failing to break higher. The price is likely to retest the MPL zone around $3727, which also aligns with the long-term ascending trendline, making it a strong confluence support.
The pink area highlights a potential demand zone where buyers may step in. If the market confirms bullish signals in this area, a long position toward the descending trendline resistance could be considered. However, extra confirmations are recommended before entering long.
Summary:
Short-term target for shorts: $3727 (MPL plus trendline support).
Watch the pink zone for potential long entries, but wait for confirmation.
Let's see what will happen!
ETHUSD SELL NOW 3990🔻 ETHUSD Short Setup – Entry: 3990
Ethereum is facing resistance near 3990, presenting a clean intraday short opportunity. Key bearish signals:
- 🔸 Price rejection at prior supply zone
- 🔸 Bearish divergence on RSI (1H)
- 🔸 Lower high structure forming below 4030
- 🔸 Volume fading on recent push
📉 Trade Plan:
- Entry: 3990
- Stop Loss: 4030
- Take Profit: 3910
Risk/reward ratio: 1:2 – ideal for disciplined scalpers and short-term swing traders. Watch BTC correlation and macro headlines for volatility spikes.

From 4800 Highs to 3850 Lows – ETH Eyes RecoveryAfter a fresh test of the 4800 zone in mid-September, ETH started to decline, with the selloff accelerating after September 22nd, in line with the broader crypto market weakness.
The drop broke below the 4100 technical support and even under the psychological 4K mark, sending price as low as 3850.
Yesterday, however, ETH managed to recover part of the losses and climbed back above 4K, a positive sign for the bulls.
From a structural point of view, the overall trend remains strongly bullish, and I see this move as nothing more than a correction and a hunt for liquidity at lower levels.
Trading Outlook:
• In the coming days, I expect ETH to reclaim the 4100 zone, turning the breakdown into a false break.
• If that happens, the door opens for upside continuation, with potential to retest 4500 and even challenge the 4800 resistance again.
• For now, I remain on the sidelines, waiting for confirmation before taking a new position.

Ethereum $ETH crypto trade idea using the weekly demand levelThere is an Ethereum CRYPTOCAP:ETH crypto trade idea using the weekly demand at $3,872. This is a very similar crypto swing trade idea I recently shared with BitCoin. Let's see if it wants to rally for a couple of weeks. You can use the smaller timeframes to trade crypto intraday strategies or scalping strategies.

#ETH is on a mission New ATH#ETH is on a mission to reach its new all-time high (ATH).
First, it may liquidate some long traders, then fill the order blocks of smart buyers before creating a new ATH.
~Namaste~
$ Jai Shree Ram $

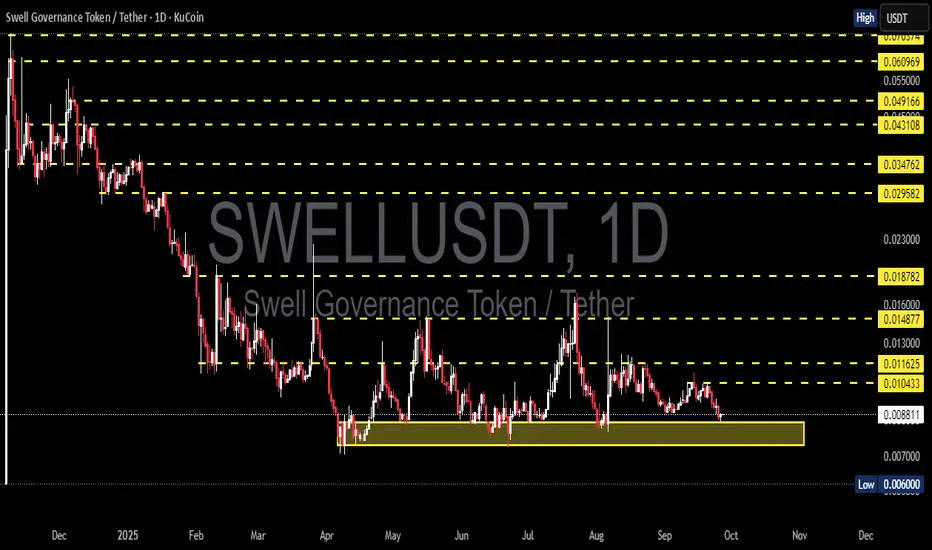
SWELL/USDT – Key Demand Zone: Relief Rally or Breakdown?Full Analysis
SWELL is currently at a critical juncture. After a prolonged downtrend since early 2025, the price has shifted into a range-bound structure, with a strong demand zone around 0.0060 – 0.0088 (highlighted in yellow).
This zone has been tested multiple times over the past few months, suggesting that buyers—potentially whales or institutions—are defending it. However, the more a support level is tested, the weaker it often becomes, raising the stakes for what comes next.
---
Structure & Price Pattern
Primary trend: bearish since the start of the year, but the momentum of the decline has slowed since Q2 → forming a range market.
Current pattern: multi-touch support combined with lower highs on the upside → signaling a phase of accumulation or distribution.
Key levels:
Support zone: 0.0060 – 0.0088.
Resistance layers: 0.0104 → 0.0116 → 0.0149 → 0.0187.
If the support zone holds, the probability of a relief rally is high. If it breaks, we could see a new capitulation phase.
---
Bullish Scenario
1. Bounce from demand zone
Confirmation: a strong daily rejection candle (hammer / bullish engulfing) with rising volume.
Short-term target: 0.0104 – 0.0116.
Extended targets: 0.0149 – 0.0187 if a breakout gains traction.
Upside potential: +30% to +100% from current levels.
2. Structural breakout
If price closes above 0.0116 on the daily chart, structure shifts into a higher-high formation.
This would significantly increase the probability of a larger bullish leg.
---
Bearish Scenario
1. Support breakdown
If the daily close falls below 0.0060, the demand zone will have failed.
This could trigger another strong sell-off and force the price to search for lower support levels.
Downside potential: at least -30% from current price, possibly more under heavy selling pressure.
---
Implications for Traders
Aggressive traders may consider entering within the demand zone with a tight stop-loss just below 0.0059. High risk, but potentially high reward if the bounce materializes.
Conservative traders should wait for a confirmed breakout above 0.0116, then enter on the retest. This approach provides a clearer bullish structure and better confirmation.
Risk management is critical here—SWELL is a small-cap altcoin with high volatility.
---
Conclusion
SWELL/USDT is standing at a major decision point. The 0.0060–0.0088 demand zone is the battlefield where the next trend direction will be decided—whether we see a relief rally toward higher resistances or a bearish breakdown into uncharted territory.
For traders, this is the time to stay patient and wait for confirmation: watch daily candle closes, volume spikes, and market reactions around this zone before making a move.
---
#SWELL #SWELLUSDT #CryptoAnalysis #Altcoin #TradingView #PriceAction #SupportResistance #Breakout #CryptoTrading #TechnicalAnalysis
PYR/USDT — Critical Zone: Accumulation for Rebound or Breakdown?PYR/USDT is now trading at a critical decision zone. After a prolonged downtrend since late 2024, the price has been consolidating inside the demand zone at 0.78 – 0.98 USDT. This area has repeatedly acted as a strong foundation to prevent deeper declines. With multiple retests, the market is approaching a tipping point: will PYR stage a significant rebound or break down into new lows?
---
🔎 Market Structure & Price Pattern
Long-Term Trend: Bearish, characterized by sharp declines and a series of lower highs since early 2025.
Mid-Term Trend: Sideways / Range-bound, with the lower boundary at 0.78–0.98 and upper boundary near 1.38.
Pattern Observed:
Potential Double/Triple Bottom formation at major support. If confirmed, this could signal accumulation before a trend reversal.
Failure to hold this zone, however, would turn the structure into a distribution breakdown, triggering new selling pressure.
---
📈 Bullish Scenario (Rebound Potential)
1. Price holds above 0.78 – 0.98 with a clear bullish reversal candle (engulfing / hammer / piercing line) on the daily timeframe.
2. Additional confirmation if daily close sustains above 1.045.
3. Step-by-step upside targets:
🎯 T1 = 1.181
🎯 T2 = 1.382
🎯 T3 = 2.148 (major mid-term resistance)
🎯 T4 = 2.592 – 3.458 if momentum extends further.
4. Bullish structure strengthens once a higher low forms after the rebound.
---
📉 Bearish Scenario (Breakdown Potential)
1. Price fails to hold and closes daily candle below 0.78.
2. A retest of the 0.78–0.98 zone as new resistance would confirm the bearish bias.
3. Downside targets:
⚠️ 0.60 (psychological support)
⚠️ 0.45 – 0.40 (deeper historical demand zone)
4. Such a breakdown will likely be accompanied by heavy sell volume, signaling panic selling and loss of key support.
---
📌 Conclusion & Strategy
The 0.78–0.98 zone is the golden decision point for PYR.
Bullish case: wait for a confirmed breakout above 1.045, with targets at 1.18–1.38.
Bearish case: breakdown below 0.78 opens room for a deeper sell-off.
Best strategy: stay patient, wait for confirmation, and let price action decide whether this zone becomes an accumulation base or a distribution top.
#PYR #PYRUSDT #CryptoAnalysis #Altcoin #SupportResistance #DemandZone #CryptoTrading #TechnicalAnalysis

$ETH is trading around $4,000 after hitting the $4,800–5,000 $ CRYPTOCAP:ETH is trading around $4,000 after hitting the $4,800–5,000 resistance zone I mentioned in my last update. As expected, a short-term correction is playing out toward $3,500–$3,200, with possible extension to $3,100, where I’ll be looking to buy again. My bullish targets remain around $5,000 and $6,000, and I’ll share timely updates as the setup develops.

Ethereum’s $4K Battle: What's Next?CRYPTOCAP:ETH is currently retesting a strong support level on the weekly timeframe, previously acting as resistance, around the $4,000 mark.
If Ethereum holds this support, we could see a potential bounce back towards higher levels. However, if the price fails to hold, further downside may test lower support areas.
This could be a pivotal point for Ethereum’s next move, so monitoring this zone is essential for short- or long-term strategies.
DYOR, NFA
#PEACE

Eth USD SELL Trade Today🔻 ETHUSD Short Setup – Entry: 3965
Ethereum is showing signs of exhaustion near the 3965 resistance zone, setting up for a potential intraday pullback. Key bearish signals include:
- 🔸 Double top formation around 3965
- 🔸 Bearish divergence on RSI (1H/4H)
- 🔸 Volume drop on recent push
- 🔸 Rejection from upper Bollinger Band
📉 Trade Plan:
- Entry: 3965
- Stop Loss: 4005 (above resistance)
- Take Profit Zones: 3900 / 3840 / 3785

ETH/USDT -> Clear Head & Shoulders → bearish biasHello guys!
Pattern: obvious Head & Shoulders on the 4-hour. The neckline was taken out by a large bearish candle, which is a good confirmation of the breakdown.
Retest: price is testing the broken neckline/supply zone (blue box). The current action is a classic retest → if it gets rejected here again, probability favors more downside.
Target: the measured move projects into the red box; roughly ~$3,850 (range $3.7k–$3.9k depending on where you measure the neckline/head). This level also lines up with the last major resistance zone, so it’s a natural magnet.
Momentum: RSI showed divergence around the head and has dropped into oversold territory with a small relief bounce.
Invalidation: a clean, sustained reclaim and close back above the blue supply zone (above ~4.32–4.40k with conviction) would invalidate the immediate H&S bearish thesis and open the door for a deeper retrace.
-----------------------
A simple trade idea:
Short on a failed retest of the blue box (4.20–4.32k) after a bearish price candle.
Stop: just above the supply zone / last swing high.
Targets: scale profits into 3.9k then 3.8k (final target ~3.7–3.9k). Trail if price action turns constructive.
Manage risk: keep position sizing sensible.

Ethereum Price Hits 6-Week Low, But Here Lies An OpportunityAt press time, Ethereum is trading at $3,938, attempting to establish $3,910 as a support floor. This decline marks a crucial break below the $4,000 level, highlighting short-term weakness.
Given current signals, ETH may remain rangebound under $4,074 resistance until stronger bullish cues emerge. Market sentiment suggests consolidation rather than sharp recovery, keeping investors cautious.
However, if Ethereum flips $4,074 into support, a push toward $4,222 could follow. This move would require investor participation and sustained inflows to counter bearish momentum, ultimately invalidating the short-term negative outlook.

Solana coin up another 60% Whats next In this video I recap our previous video calling for a pullback into $150 with a target of $240 which has now been fulfilled .
The question is whats next from $240, we are top heavy and despite market structure still bullish I anticipate a move up to fill the single prints at $245/250 before a healthy pull back into $200 zone .
I also recap Bitcoin and the ETH /BTC pair
Take the trades level by level and plan ahead . Enjoy

$ETH Market OutlookCRYPTOCAP:ETH Market Outlook
Ethereum is currently consolidating, with a critical downside level at $4,000.
If $4,000 does not hold, the next supports are $3,500 and $2,400.
The $2,400 scenario remains highly unlikely, as it would imply a full retracement of the previous rally. In contrast, a pullback to $3,500 represents a 50% correction of the last upward move—a realistic outcome that would signal a temporary setback rather than a trend reversal, potentially setting the stage for continued upside momentum.
At present, CRYPTOCAP:ETH is trading within a range and sitting near the midpoint. Should this level break, the bottom of the range becomes the next logical target.
⚠️ Always DYOR.
