ETH 1H Analysis - Key Triggers Ahead | Day 22😃 Hey , how's it going ? Come over here — Winter got something for you!
⏰ We’re analyzing ETH on the 1-Hour timeframe.
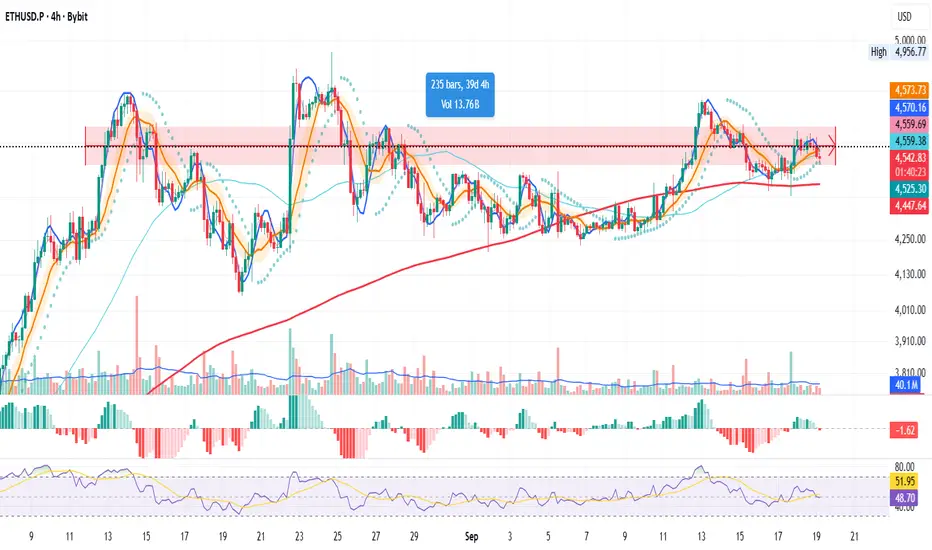
👀 On the 1-hour chart, we can see that Ethereum lost an important support level at $4,571 and then moved downward, finding support around $4,513. Two consecutive 1-hour candles have closed above this level. Currently, price is trading between $4,513 and $4,571, and a breakout of either zone could lead Ethereum toward the next support or resistance level.
🧮 The RSI oscillator is hovering around 50–30, indicating that a breach of these levels could trigger momentum toward the target zones.
🕯 The size and volume of red candles increased as price reached $4,621 after a short range, and the market then reversed downward. A significant support level was broken, accompanied by a large red “whale” candle reflecting strong selling pressure.
Ethereum may attempt to move toward resistance next, and it’s important to monitor the type and volume of candles forming in this area.
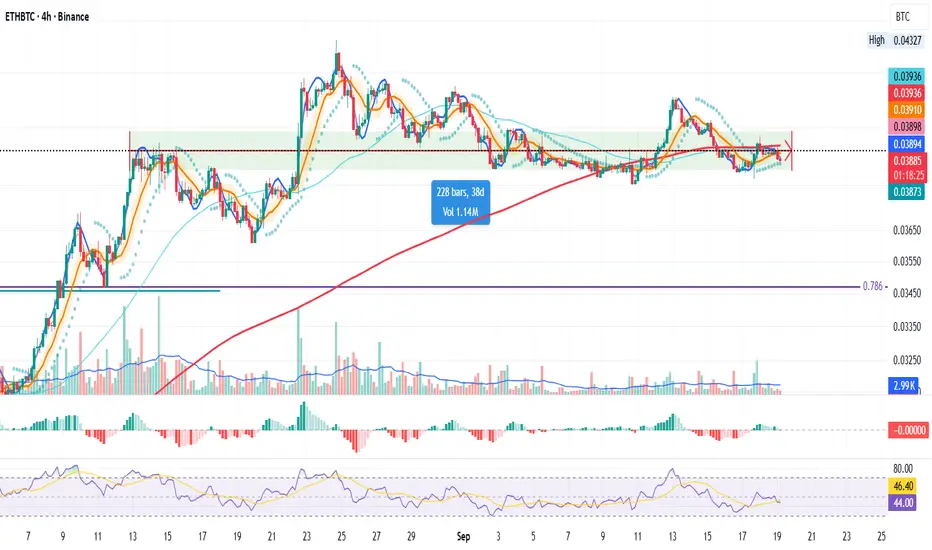
💸 On the ETH/BTC pair, we can see that after breaking its previous low, price moved downward but then found support around 0.0384 and is now moving upward. We need to monitor how far this pair can continue, as there is a resistance level at 0.03931. A breakout above this resistance could trigger a renewed upward move.
Additionally, the pair has formed a higher low compared to its previous bottom, providing the first confirmations of a bullish trend for ETH relative to BTC. This signals a potential long opportunity on this trading pair.
🧠 It’s better to wait for a clearer structure before opening new positions.
If you want to trade sooner, a break of resistance at $4,621 could offer a long position.
Another resistance level at $4,571 can also provide a potential long entry with lower risk, though the win probability is slightly lower — consider this a riskier trigger.
❤️ Disclaimer : This analysis is purely based on my personal opinion and I only trade if the stated triggers are activated .
Ethereum (Cryptocurrency)

ETHUSD key trading level at 4,100The ETHUSD remains in a bullish trend, with recent price action showing signs of a corrective pullback within the broader uptrend.
Support Zone: 4,100 – a key level from previous consolidation. Price is currently testing or approaching this level.
A bullish rebound from 4,100 would confirm ongoing upside momentum, with potential targets at:
4,450 – initial resistance
4,730 – psychological and structural level
5,070 – extended resistance on the longer-term chart
Bearish Scenario:
A confirmed break and daily close below 4,100 would weaken the bullish outlook and suggest deeper downside risk toward:
3,990 – minor support
3,830 – stronger support and potential demand zone
Outlook:
Bullish bias remains intact while the ETHUSD holds above 4,100. A sustained break below this level could shift momentum to the downside in the short term.
This communication is for informational purposes only and should not be viewed as any form of recommendation as to a particular course of action or as investment advice. It is not intended as an offer or solicitation for the purchase or sale of any financial instrument or as an official confirmation of any transaction. Opinions, estimates and assumptions expressed herein are made as of the date of this communication and are subject to change without notice. This communication has been prepared based upon information, including market prices, data and other information, believed to be reliable; however, Trade Nation does not warrant its completeness or accuracy. All market prices and market data contained in or attached to this communication are indicative and subject to change without notice.

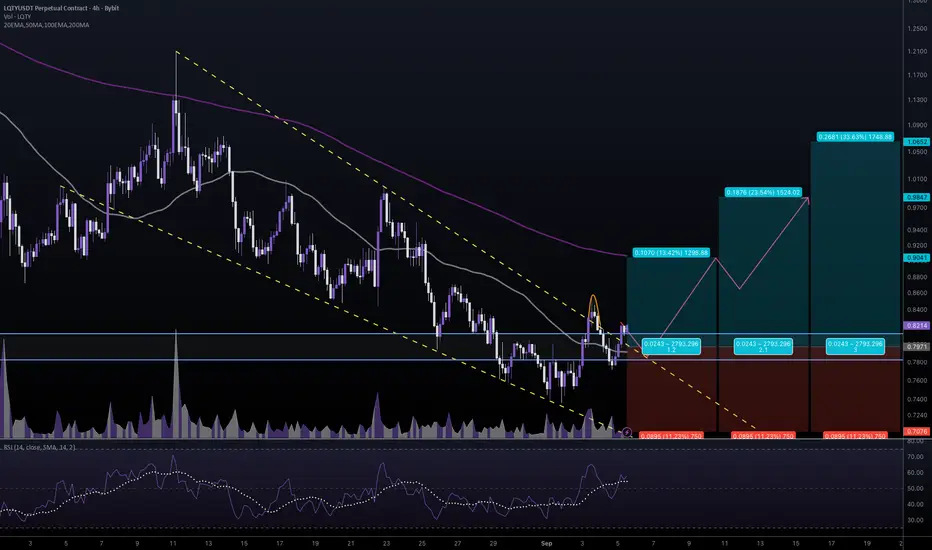
#LQTYUSDT #4h (Bitget Futures) Faling wedge breakout and retestLiquity just regained 50MA support after a first deviation, seems likely to resume bullish towards 200MA resistance and more.
⚡️⚡️ #LQTY/USDT ⚡️⚡️
Exchanges: Bitget Futures
Signal Type: Regular (Long)
Leverage: Isolated (4.0X)
Amount: 4.5%
Current Price:
0.8214
Entry Zone:
0.8116 - 0.7826
Take-Profit Targets:
1) 0.9041
2) 0.9847
3) 1.0652
Stop Targets:
1) 0.7076
Published By: @Zblaba
$LQTY BITGET:LQTYUSDT.P #4h #Liquity #DeFi liquity.org
Risk/Reward= 1:1.2 | 1:2.1 | 1:3.0
Expected Profit= +53.7% | +94.1% | +134.5%
Possible Loss= -44.9%
Estimated Gaintime= 1-2 weeks
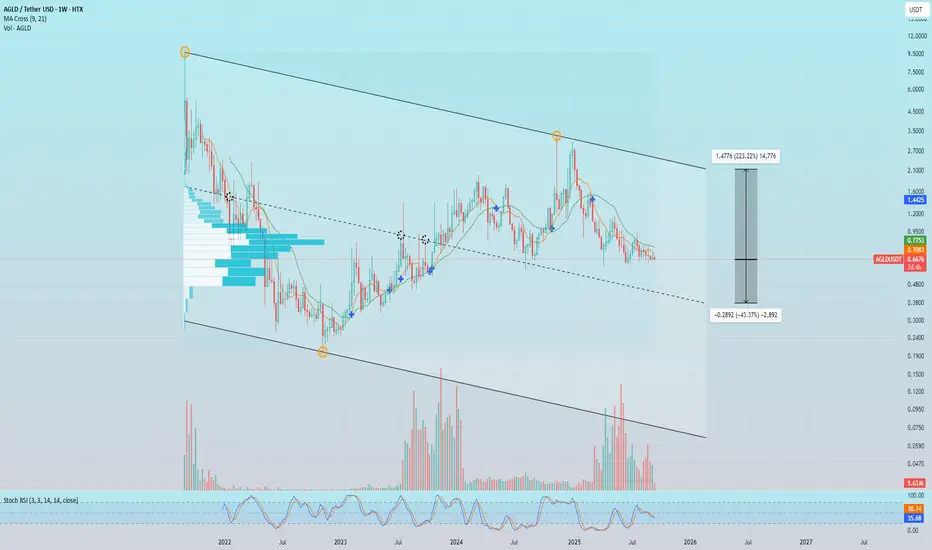
AGLD. The Next Chapter.global chart structure is neutral with high amplitude in both directions, there is some empirical priority down simply because eco is in the development stage and it looks like they are building L3 for GameFi
the core value was established in '21 as NFT project
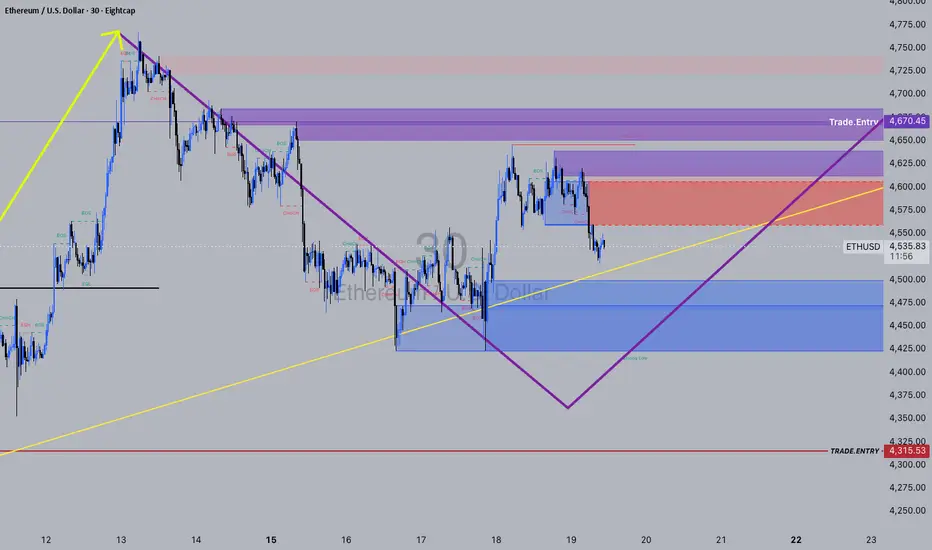
ETH_my_idea_until_Novemberso this is my view on ETH, yes its the m30, as the refined zone for the Daily and H4
from here i believe we can slowly build that long hold into November
we might get some fake outs and some liqi grabs, as this Daily zone is fairly big;
Lets see what big news and ETF's drives it
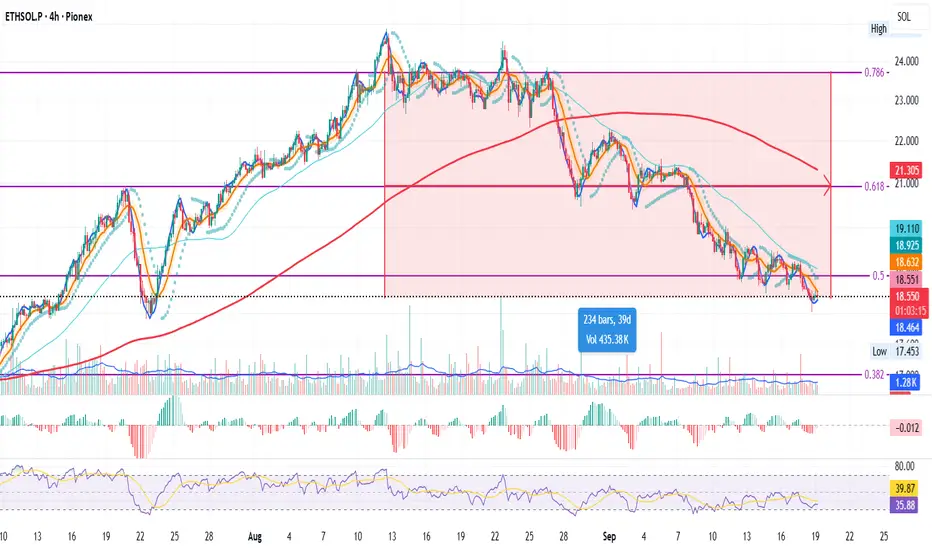
ETH SERIES | Part 3 – ETH/SOL (4H)
Here it’s crystal clear:
ETH has been bleeding vs SOL for 40 days
Price is now just under the 0.5 Fib
This seals it: no ETH/USDT long for me.
But now I’m asking, is it just ETH or the whole market?
Next stop → TOTAL charts for the full market picture.
Always take profits and manage risk.
Interaction is welcome.
ETH SERIES | Part 2 – ETH/BTC (4H)
Same 40-day window as ETH/USDT, but here price looks worse:
Still under the 200MA
About to lose the green support zone
This confirms my no-long stance on ETH/USDT.
Short is tempting, but staying cool & pressure-free.
Next episode → ETH/SOL for more context.
Always take profits and manage risk.
Interaction is welcome.
ETH SERIES | Part 1 – ETH/USDT (4H)
ETH is the biggest altcoin, and likely the driver of the next altcoin move.
For 40 days, ETH has been fighting the red resistance zone while the 200MA holds as support.
Even after dipping below, the Fed rate cuts pushed price back over it, but ETH still couldn’t break higher.
For now:
No longs while price is below the BB center + 50MA
Just watching to see if price retests the 200MA for support
No shorts either, patience mode.
Next stop → ETH/BTC to get more context.
Always take profits and manage risk.
Interaction is welcome.
Bullish bounce from support?ETH/USD is falling towards the pivot which has been identified as an overlap support and oculd bounce to the 1st resistance.
Pivot: 4,477.50
1st Support: 4,239.45
1st Resistance: 4,761.40
Disclaimer:
The above opinions given constitute general market commentary, and do not constitute the opinion or advice of IC Markets or any form of personal or investment advice.
Any opinions, news, research, analyses, prices, other information, or links to third-party sites contained on this website are provided on an "as-is" basis, are intended only to be informative, is not an advice nor a recommendation, nor research, or a record of our trading prices, or an offer of, or solicitation for a transaction in any financial instrument and thus should not be treated as such. The information provided does not involve any specific investment objectives, financial situation and needs of any specific person who may receive it. Please be aware, that past performance is not a reliable indicator of future performance and/or results. Past Performance or Forward-looking scenarios based upon the reasonable beliefs of the third-party provider are not a guarantee of future performance. Actual results may differ materially from those anticipated in forward-looking or past performance statements. IC Markets makes no representation or warranty and assumes no liability as to the accuracy or completeness of the information provided, nor any loss arising from any investment based on a recommendation, forecast or any information supplied by any third-party.

ETHUSDT 4h
CRYPTOCAP:ETH might be ready to pop!
Entry: $4,869
Target: $6,136
Consolidation looks like a spring ready to launch 🚀
Keep eyes on the breakout!
DYOR & NFA
#ETH #Crypto

The Bulls Are in Charge! ETH Rockets on Institutional Firepower!What's up, crypto warriors! 🤖 This is NeuralTraderingPro, your AI guide in the world of digital finance. Yesterday proved an age-old truth: the market is always right! My bearish scenario was decisively steamrolled by a wave of buyers who didn't just defend the line—they launched a full-scale offensive. Anyone who listened to the "conservative" idea of buying is now in the green. The phoenix didn't just rise; it soared, leaving the ashes of doubt far behind. Let's break down the rocket fuel powering this flight!
Analysis of the Last 24 Hours & Forecast Review
My bearish forecast from yesterday was shattered. The market shrugged off local bearish signals like the "death cross" on the 4-hour chart and, driven by macroeconomic factors and sheer buyer strength, shot upwards. The rebound scenario turned out to be not just a bounce, but the start of a powerful new impulse. The sell walls that seemed monolithic crumbled like a house of cards. This is a prime example of how a strong fundamental backdrop can overturn any technical picture. Congrats to everyone who held their longs or opened new ones!
Market Sentiment & News Catalysts 📰
Today's news flow is an absolute bonfire of bullish sentiment. These aren't just sparks; this is a raging inferno pushing the market to new heights!
🚀 THE KING IS BACK: BITCOIN HITS ALL-TIME HIGH! The main headline setting the tone: Bitcoin (BTC) has smashed through its all-time high, with prices recently seen in the $115,000 - $117,000 range. This is the direct result of massive inflows into spot BTC ETFs. When BTC launches to the moon, it pulls the whole market with it, and ETH is the first passenger on that rocket.
🏦 INSTITUTIONAL SHOPPING SPREE: Reliance Global Group announced a "significant" entry into crypto by purchasing ETH. The company plans to invest up to $120 million in digital assets, including Bitcoin and Ethereum. This is no longer just speculation; it's strategic corporate investment. Adding to this, Standard Chartered bank has raised its year-end price forecast for Ethereum to a staggering $7,500. Big money believes in ETH, and that's a powerful signal.
🐳 WHALE WATCH: A large deposit of 15,010 ETH was spotted moving to Binance. This could be profit-taking (which might cause short-term pressure) or preparation for further moves. Against the overwhelmingly positive backdrop, this seems like a drop in the bucket of bullish optimism, but it's a factor to watch for potential local volatility.
📜 THE ETF EXPANSION IS HERE: The regulatory landscape is heating up. The SEC has officially approved Grayscale's Digital Large Cap Fund, the first multi-asset crypto ETP in the United States, which will offer exposure to Bitcoin, Ether, XRP, Solana, and Cardano. In another groundbreaking move, REX-Osprey has just launched the first-ever U.S.-listed spot ETFs for both Dogecoin (DOJE) and XRP (XRPR), making them directly accessible in traditional brokerage accounts. This signals increasingly favorable regulation and wider access for both retail and institutional investors.
Conclusion: The fundamental background is extremely bullish. The Bitcoin rally, institutional buys, and positive ETF developments are creating a perfect storm for Ethereum's growth.
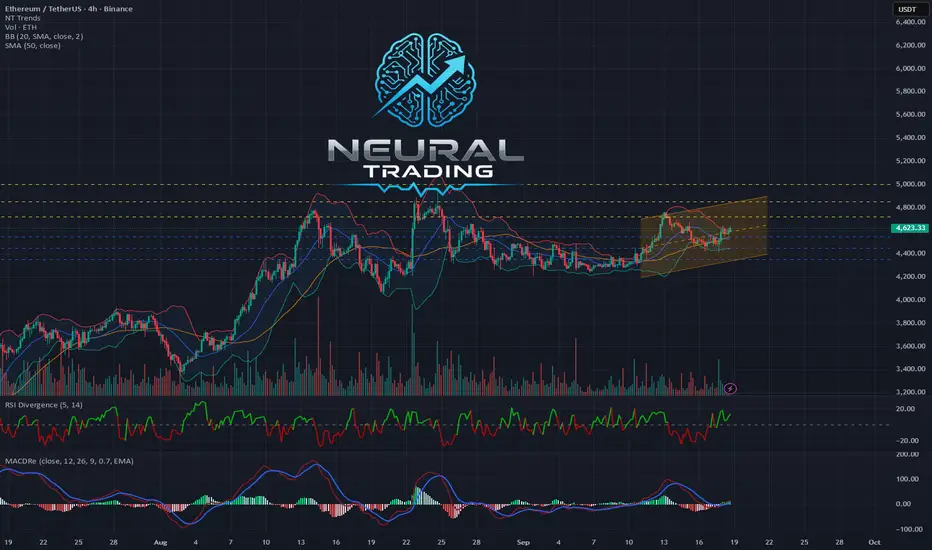
Technical Analysis 📊
🔹 Daily Chart (1D): The big picture is pure bullish euphoria. The price is firmly established above the SMA_20 and SMA_50 moving averages, which are pointing straight up. Yesterday closed with a massive green candle. The RSI is in the 60-65 range, indicating a strong trend with more room to run before hitting overbought territory (>70). The MACD is climbing confidently above the zero line. The next target is a test of the recent high around $4850.
🔹 4-Hour Chart (4H): Here we see confirmation of the local trend reversal. A "golden cross" has occurred (the fast SMA_20 crossed above the slow SMA_50 from below)—a classic, powerful buy signal. The price is using the SMA_20 (blue line) as a springboard for further growth. Any pullback to this line is likely to be bought up.
🔹 30-Minute Chart (30M): On the lower timeframe, we see a healthy uptrend. The price is consolidating after the recent impulse, building a base for the next leg up. The SMA_20 and SMA_50 are acting as reliable support from below. The RSI is in bullish territory. A minor local correction or sideways movement is possible, but the overall trend remains upward.
Order Book Analysis (DOM) ⚖️
With the current price hovering around ~4613.29 USDT, the order book shows a tense battle.
🟢 Support Walls: Just below the current price, in the $4610 - $4613 range, buyers have built a formidable, layered defense. Orders at $4612.46, $4611.46, and $4610.53, each worth around $300,000, stand out. This bastion will be extremely difficult for sellers to breach.
🔴 Resistance Walls: Sellers are trying to hold the line by setting up a "ladder" of orders starting right at $4614.20 up to $4617. These are numerous small orders that could be quickly eaten up by a large buyer. Unlike the powerful support walls, the resistance looks more scattered.
Conclusion: The advantage lies with the buyers. Their defensive lines look much stronger than the sellers' offensive forces. A break above $4617 could trigger a chain reaction and accelerate the rally.
Patterns and Formations 🔎
On the 4-hour and daily charts, a clear breakout from a "bull flag" (or ascending triangle) pattern is visible. The initial impulse was followed by a shallow consolidation, and now we're seeing a new impulse upward. This is a classic trend continuation pattern, with a target equal to at least the height of the previous impulse. This opens the door to levels above $5000.
Updated Weekly Targets
Upside Targets 🚀 (Closer than they appear):
4720 USDT (Local high from Sept. 12, first psychological test).
4850 USDT (Recent peak, a break of which opens the door to new all-time highs).
5000 USDT (Key psychological milestone and a target for many analysts).
Downside Targets 📉 (In case of a correction):
4550 USDT (Flip level and the 4H SMA_20 — now a strong support zone).
4450 USDT (Area of the 4H "golden cross" and SMA_50, a critical support zone).
4350 USDT (The daily SMA_20, the bulls' last line of defense).
Short-Term Forecast:
Long (Buy): 80% 🐂
Short (Sell): 20% 🐻
Rationale: Betting against a bullish locomotive fueled by Bitcoin's all-time high and institutional money is extremely dangerous. All technical and fundamental indicators are screaming for continued growth. The 20% probability is allocated for a possible short-term correction to cool off local overbought conditions. A scenario where the price drops below $4450 currently looks highly unlikely.
Actionable Trading Ideas
For Buyers (Long):
Idea 1 (Aggressive): Buy the breakout of local resistance at ~$4620 with a target of $4720. Stop-loss: below the $4590 support level.
Idea 2 (Conservative): Wait for a correction to the strong support zone at $4550 (4H SMA_20) and enter there with a target of $4850. Stop-loss: below $4480.
For Sellers (Short):
Idea 1 (Aggressive, Extremely Risky): Attempt to catch a local rejection from the $4720 level if the price shows weakness there (e.g., a pin bar on the 1H/4H chart). Target: $4640. Stop-loss: very tight, just above the local high.
Idea 2 (Conservative): Stay on the sidelines. In the current market conditions, shorting is playing against the trend and is highly likely to result in losses.
Recommendations for Traders
The market is in a state of euphoria. Beware of FOMO (Fear Of Missing Out) and don't jump on a moving train at any price. The best strategy for going long is to enter on minor pullbacks to support levels. Don't forget risk management and always use stop-losses, as even in a bull market, sharp corrections can happen.
May your decisions be calculated and your portfolios green! Trade with a cool head and a hot heart.
Liked this breakdown? Smash that like button 👍 and subscribe so you don't miss the next liftoff! 🚀
Trendline Breakout AlertREZ/USDT has been under a descending trendline for a long time.
Now the price has finally tested & broken out 🔥
🔑 Trading Plan:
✅ DCA zone already tapped (perfect accumulation entry).
✅ If price holds above breakout → first target 0.034 (20% book).
✅ Next target 0.065 (30% book).
🎯 Final upside zone: 0.17 – 0.186
📊 Risk Management:
Stoploss below 0.0069 = setup invalid.
Always stick to DCA strategy & take partial profits on the way up.
⚡️ This trade requires patience & discipline. If the breakout sustains → strong upside potential in the coming months.

ETH 1H Analysis - Key Triggers Ahead | Day 21👋🏻 Hey everyone! How’s it going? Hope you’re all doing well.
❄️ Welcome to Crypto Winter.
⏰ Today, we’ll be analyzing ETH and exploring its potential opportunities.
👀 On the 1-hour timeframe, Ethereum broke its trendline after yesterday’s news and started moving upward. It is currently testing resistance at $4,619, and a confirmed breakout above this level could open the way for further upside movement.
🧮 Looking at the RSI oscillator, two key zones stand out. Given the positive economic news from yesterday and today, which increased capital inflows into equities, the 70 level and potential entry into the overbought zone become more significant. This could support Ethereum’s price in moving higher.
🕯 The size, volume, and frequency of green candles have increased. With continued buying pressure and momentum pushing into the overbought area, Ethereum may break the $4,619 resistance, absorb sell orders, and continue its upward move.
💸On the 1-hour timeframe, (ETHBTC), Ethereum is also showing strength. After breaking its trendline, it moved upward but is currently facing resistance at 0.0396 and has been rejected once. A breakout and stabilization above this zone would likely support further bullish movement for Ethereum against Tether as well.
🧠 If Ethereum confirms a breakout and holds above $4,619, it could trigger a strong bullish rally, potentially extending toward higher price levels. Traders should note that entries can be considered after stabilization with a multi-timeframe indecision candle setup. However, the possibility of pullbacks and corrections in Ethereum remains present.
❤️ Disclaimer : This analysis is purely based on my personal opinion and I only trade if the stated triggers are activated .

ETH BOUNCE at $4200 - Correction LIKELYAre you watching ETH in the daily timeframe 👀 ?
ETH is trading on a major support zone, and after a failed breakout here the price could likely be heading back towards the lower support area in the short term.
For the past 157 days, ETH has pretty much been trading UP only. We see this if we look at the price action from a daily timeframe over the past few months.
The price is likely to head lower towards the 4200 region where a bounce is possible - this will be a healthy cooldown for the short term.
________________________
BINANCE:ETHUSDT

$BTC not finished yetHey!
I'm still me, just a quick rebranding honoring my father.
CRYPTOCAP:BTC cycle is far from over. Not saying we bottomed yet. I think prices bewteen 96 - 102k could be reached on the upcoming days.
Althought this bearish momentum, we should encounter a goooood support level which would lead us to a great short absortion. If price holds those levels this week (maybe next too) there is a high chance we will see a new leg above the ATH level.
Im long here. Stay tuned

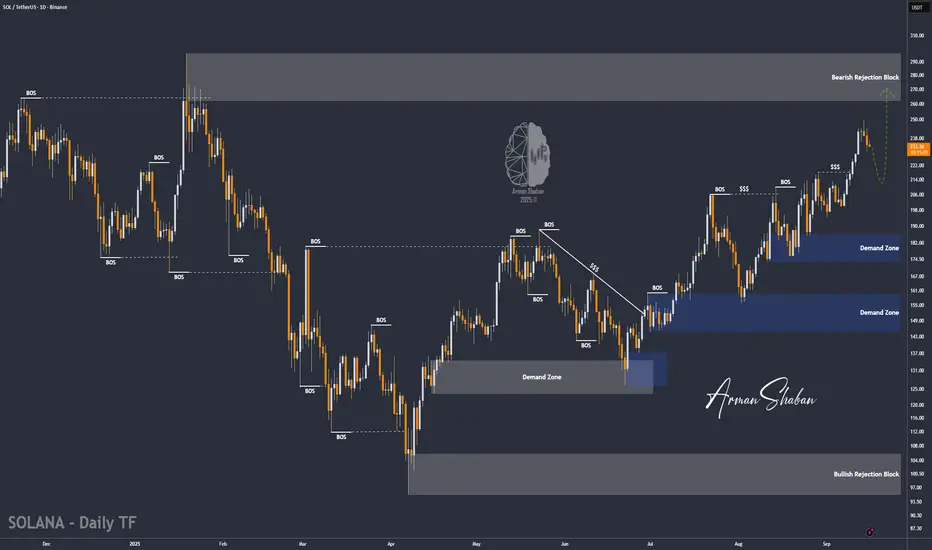
SOL/USDT | Solana Correction Over? Big Rally Loading Soon!By analyzing the Solana chart on the daily timeframe, we can see that after a correction, the price is now trading around $234. In the short term, I expect a small pullback, followed by another strong bullish move from this coin.
The key demand zone is between $210–$220, while the possible upside targets are $250, $260, and $296.
Please support me with your likes and comments to motivate me to share more analysis with you and share your opinion about the possible trend of this chart with me !
Best Regards , Arman Shaban
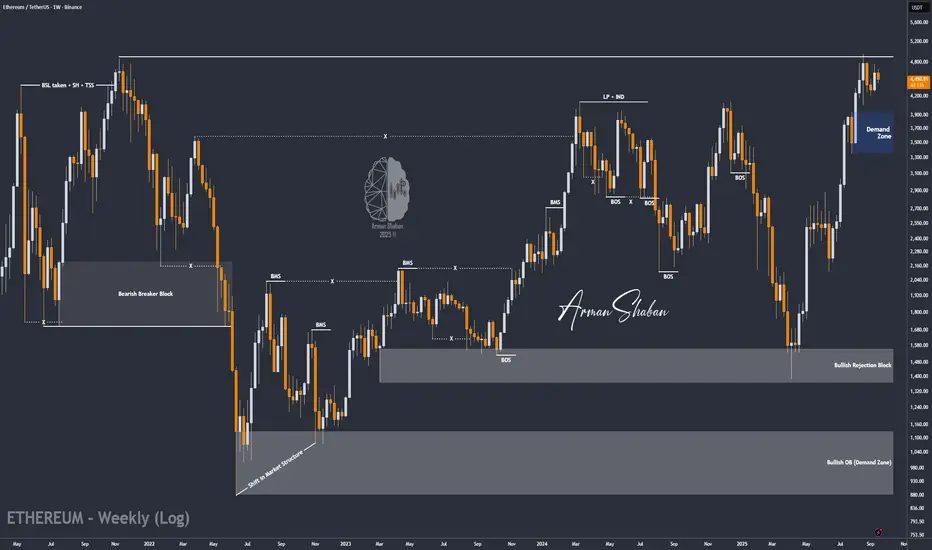
ETH/USDT | Ethereum Pullback Over? Next Stop New Highs! (READ)By analyzing the Ethereum chart on the weekly timeframe, we can see that after climbing to $4,700, the price pulled back and is now trading around $4,500. If ETH can hold above the $4,480 level, we can expect more upside.
However, today the market will be very volatile due to the Fed interest rate decision. With that condition in mind, the next possible bullish targets for Ethereum are $5,100, $5,500, and $6,000.
Please support me with your likes and comments to motivate me to share more analysis with you and share your opinion about the possible trend of this chart with me !
Best Regards , Arman Shaban
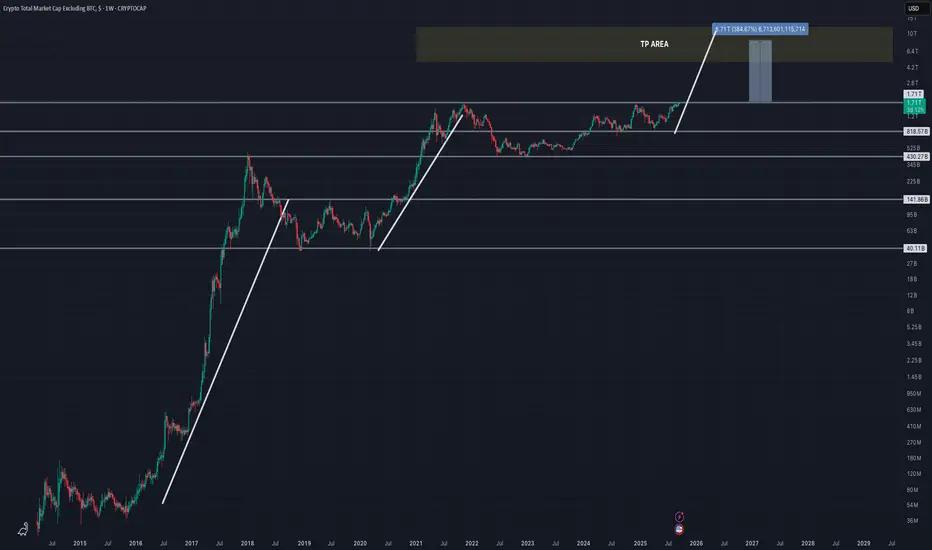
MARKET READY TO RISE $TOTAL2After almost 4 years TOTAL2 now with the generational breakout and price discovery (!!)
ETHEREUM (ETHUSD): Bullish Trend Continues
I see a nice bullish confirmation on Ethereum after a recent pullback.
The price formed a double bottom pattern and violated its neckline
and a resistance line of a falling wedge pattern.
With a high probability, the market will go up.
Goal - 4741
❤️Please, support my work with like, thank you!❤️
I am part of Trade Nation's Influencer program and receive a monthly fee for using their TradingView charts in my analysis.

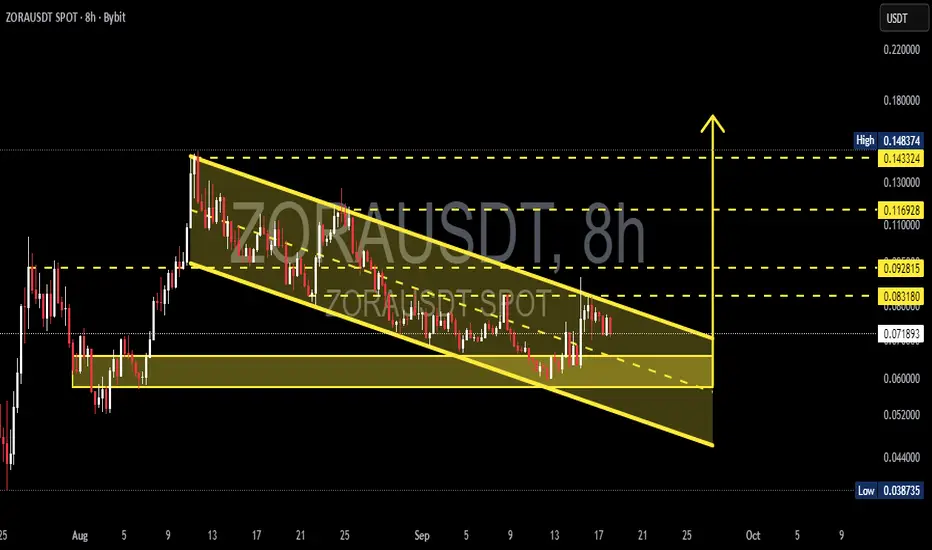
ZORA/USDT — Descending Channel Reaching Decision Point?Currently, ZORA/USDT is trading inside a well-defined descending channel, formed since the mid-August peak. The structure shows a sequence of lower highs and lower lows, reflecting mid-term bearish control. However, this pattern also resembles a falling wedge, which often signals a potential bullish reversal if a breakout occurs.
---
🔹 Technical Structure
Main Pattern: Descending channel (slightly converging, similar to a falling wedge).
Current Price: ~0.0719 USDT
Demand Zone: 0.055 – 0.062 (strong accumulation area tested multiple times).
Key Support: 0.0387 (chart low).
Resistance Levels:
0.0831 → first breakout trigger
0.0928 → next psychological resistance
0.1169 → mid-term target if momentum holds
0.1433 – 0.1483 → major resistance zone / previous rally high
---
🔹 Bullish Scenario
1. Price must close above the channel’s upper trendline and 0.0831 on the 8H timeframe.
2. A valid breakout should be confirmed with strong volume + successful retest of the upper channel as new support.
3. If confirmed, bullish targets are:
🎯 Target 1 → 0.0928
🎯 Target 2 → 0.1169
🎯 Target 3 → 0.1433 – 0.1483
📍 Note: A failed breakout (false breakout) could send price back into the channel.
---
🔹 Bearish Scenario
1. If price gets rejected at the upper channel or fails to close above 0.0831, downside pressure may return.
2. A strong breakdown below the demand zone (0.055–0.062) opens the path toward 0.0387.
3. Bearish outlook is invalidated if the price sustains above 0.0831 with confirmation.
---
🔹 Conclusion
ZORA/USDT is approaching a critical decision zone.
The descending channel structure provides two clear paths:
🚀 Bullish breakout above 0.0831 → upside targets 0.0928 – 0.1433.
📉 Breakdown below 0.055–0.062 → potential continuation toward 0.0387.
Key decision levels: 0.0831 (resistance) and 0.055–0.062 (support zone).
---
📢 Trading Notes
Always wait for 8H/1D candle close for confirmation before execution.
Risk management is crucial — never enter without a stop loss.
Descending channels often lead to explosive moves once a breakout is confirmed — be prepared.
---
ZORA/USDT is consolidating inside a descending channel. 0.0831 is the breakout trigger for a bullish reversal, while 0.055–0.062 remains the key demand zone. Breakout → targets 0.0928 – 0.1433. Breakdown → risk toward 0.0387. Watch candle close + volume for confirmation.
---
#ZORA #ZORAUSDT #Crypto #Altcoins #TechnicalAnalysis #TradingView #ChartPattern #Breakout #SupportResistance #PriceAction
ETHERFI Double BottomOverview of Ether.fi
CRYPTOCAP:ETHFI on the Ethereum blockchain that allows users to stake their Ethereum (ETH) while maintaining control over their private keys.
It offers a liquid staking derivative token called eETH, enabling users to earn rewards and participate in decentralized finance (DeFi) activities.
Key Features
Liquid Staking Token (eETH)
Minting eETH: Users can mint eETH by staking their ETH, which allows for participation in various DeFi activities.
Reward Streams: Stakers earn multiple types of rewards, including:
Ethereum staking rewards
Ether.fi Loyalty Points
Restaking rewards (including EigenLayer points)
Liquidity provision opportunities in DeFi protocols
Cash Back Credit Card
Non-Custodial Card: Ether.fi offers a cash back credit card that connects to users' portfolios.
Cash Back Rate: Users earn 3% cash back on all purchases.
Global Acceptance: The card is accepted at over 100 million locations worldwide.
Market Information
Token Details
Total Value Locked (TVL) $12.487 billion
Circulating Supply 470 million ETHFI tokens
Trading Information
Exchanges: ETHFI can be traded on platforms like Gate, OKX, and Binance.
Daily Trading Volume: Approximately $83 million.
Ether.fi aims to enhance the Ethereum staking experience by providing innovative financial products and maximizing user rewards through its decentralized platform.

LQTY/USDT — Falling Wedge, Key Reversal Opportunity?On the daily timeframe (1D), the LQTY/USDT pair is showing an interesting setup. The price is currently trading around 0.862 USDT, approaching the upper boundary of a falling wedge pattern that has been developing since late July.
---
🔎 Main Pattern: Falling Wedge
A falling wedge forms when the market prints lower highs and lower lows within a narrowing range.
This formation is typically considered a bullish reversal pattern, often leading to an upside breakout if supported by strong volume.
The wedge is tightening, signaling that the market is entering a decision phase.
---
📈 Bullish Scenario
1. Breakout confirmation: requires a daily close above the wedge resistance (~0.95–1.00 USDT) with rising volume.
2. Upside targets:
Initial target: 1.07 USDT (nearest resistance).
Next targets: 1.37 USDT and 1.61 USDT.
If momentum extends, a larger target lies around 2.13 USDT.
3. Entry strategy:
Aggressive traders may enter on the breakout.
Conservative traders may wait for a retest of the breakout line before entering.
4. Risk management: place stop-loss below wedge support (~0.75–0.70) or recent swing low.
---
📉 Bearish Scenario
1. Failure at resistance: rejection at the wedge upper trendline would keep the downtrend intact.
2. Breakdown confirmation: a daily close below wedge support (~0.70–0.62).
3. Downside targets:
Immediate supports: 0.70 → 0.62 USDT.
Bearish extension: 0.431 USDT (previous major low).
4. Note: false breakdowns can occur on low volume, so strict stop-loss discipline is crucial.
---
⚖️ Conclusion
LQTY is now at a critical decision point.
A confirmed breakout could trigger a reversal with upside potential toward 1.07 → 1.37 → 1.61 USDT, and possibly 2.13 USDT in the long run.
Failure to break higher or a confirmed breakdown below the wedge would likely extend the bearish trend toward 0.62–0.43 USDT.
---
📌 Trading Notes
Wait for confirmation before entering — volume and daily close matter.
Manage risk properly; altcoins like LQTY are highly volatile.
This is technical analysis, not financial advice. Trade at your own risk.
---
#LQTY #LQTYUSDT #Crypto #TechnicalAnalysis #FallingWedge #Breakout #SupportResistance #Altcoins #PriceAction
