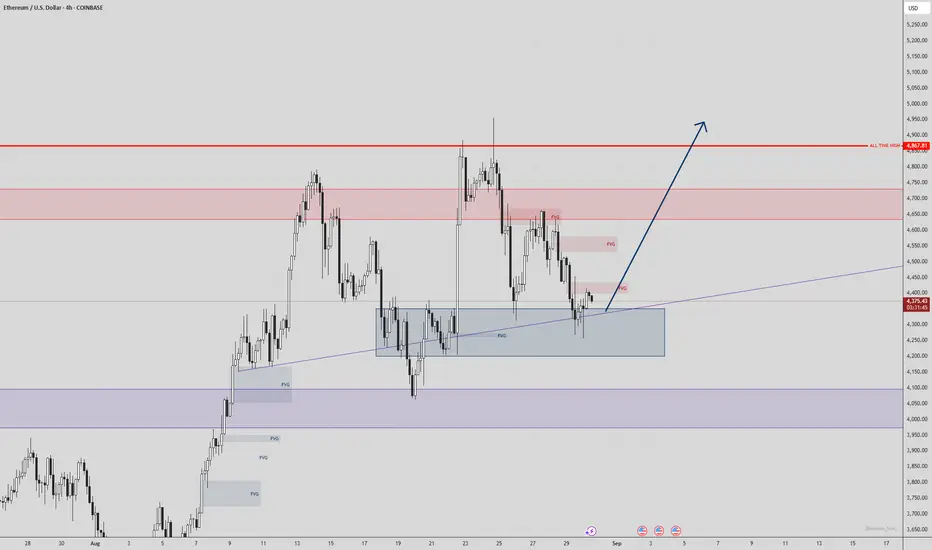
Ethereum – Bullish Reversal from Demand Zone Towards ATHEthereum has successfully respected the ascending trendline and reacted strongly from the blue demand zone & FVG. Current structure suggests a potential bullish reversal targeting liquidity above 4,680 and eventually the All-Time High (4,887).
Ethereum (Cryptocurrency)
ETH/USD: ETH on the Edge!ETH is currently trading around $4,390–$4,430 after a summer rally and a modest pullback, reflecting broader crypto weakness linked to shifting U.S. rate-cut expectations. Demand from spot ETH ETFs has been a key support factor, with inflows continuing steadily and several trackers reporting multi-billion-dollar monthly additions.
On-chain activity also remains robust, with DeFi TVL, daily transactions, and active addresses near 2025 highs, indicating that real usage underpins price action. The completion of the Pectra upgrade and upcoming scalability improvements further support medium-term confidence, while macro developments remain the main swing factor, as crypto reacts to Fed guidance and broader risk appetite.
Technically, $4,300–$4,350 provides immediate support, with deeper support at $4,150–$4,200, while resistance sits at $4,600, above which $4,950–$5,000 becomes achievable. In the next 2–6 weeks, ETH is likely to trade in a range of $4,200–$4,950, with ETF inflows and strong on-chain metrics cushioning dips, though a decisive close above $4,600 would open a run toward $4,900–$5,000, and a close below $4,300 risks probing $4,150–$4,200.
Into Q4, the outlook remains constructive but choppy, with potential to retest and break $5,000 if flows persist and macro conditions remain favorable. Key risks include a macro downside surprise, ETF outflows, and technical or regulatory setbacks.
Market participants should watch ETF flow prints, on-chain activity, and U.S. rates data, as these will heavily influence ETH price action. Overall, near-term trading likely remains choppy between $4,200 and $4,950, with $4,600 acting as pivotal resistance and $4,300 as immediate support, while ETF inflows and real usage favor buy-the-dip behavior, and macro developments will determine whether ETH can sustainably challenge $5,000.

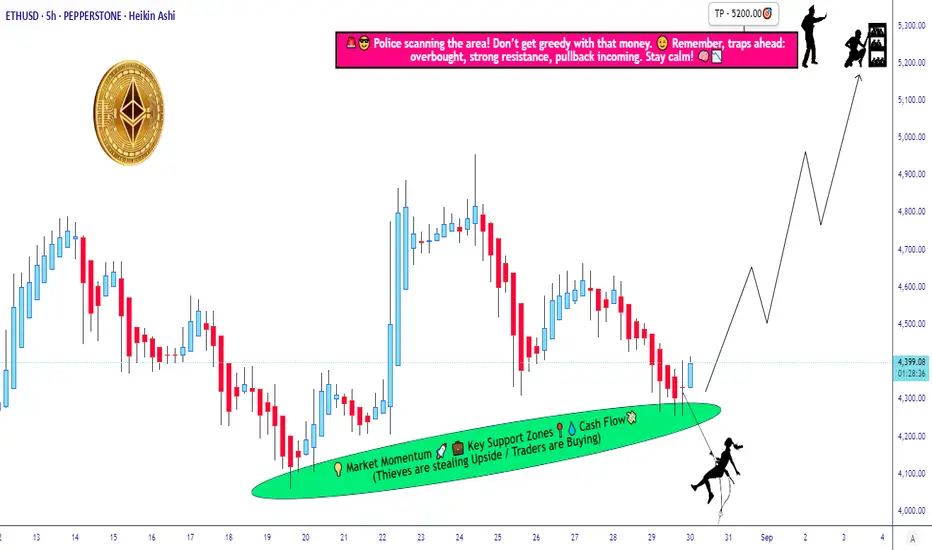
Stealing Profits from ETH! Bullish Layer Strategy Activated🔓💰 ETH/USD "Ethereum vs. Dollar" Money Heist Plan 💰🔓
🎯 Plan: Bullish Robbery | Swing/Day Trade
💎 Layered Entries | Precision Loot | Multi-Bag Grab
🚀 Target: 5200.00 | 🛑 Stop Loss: 4060.00
🚨👀 Attention Traders, Crypto Bandits & Market Looters! 👀🚨
The Ethereum vault is wide open – and Thief Trader is here with the LAYERED ENTRY STRATEGY. Stack those buy limits like gold bars in a secret vault. 🏦💎
💥 ENTRY: Any Price is a Good Price 💥
Thief style means we don’t chase – we LAYER.
⚔️ Multiple limit entries:
4400.00
4300.00
4200.00
(Add more layers if you’re savage enough.)
Every dip is a robbery opportunity – we’re not here to beg, we’re here to loot.
🔐 STOP LOSS: 4060.00 🔐
This is Thief’s SL Zone – where the cops show up.
OG Thieves know: adjust your SL to your own heist plan & risk appetite.
💸 TARGET: 5200.00 💸
That’s the police barricade – take the cash and escape before the sirens.
Secure the bag, don’t get greedy.
🧠 Thief Trader Secrets:
📊 Layered entries = survival + sniper precision.
⚡ Swing traders ride it, day traders loot it, investors just chill & count.
🔔 Trail your SL – don’t let profits get hijacked.
⚠️ HEIST PROTOCOL:
✅ No panic entries.
✅ Risk small, layer smart.
✅ Remember: patience = payday.
❤️🔥 Smash that 💥 BOOST BUTTON 💥 if you’re rolling with the Thief Squad.
Follow for the next Market Heist Plan – we rob, we layer, we escape with bags full. 💼💰
“Markets pay the disciplined thieves, not the desperate gamblers.” – Thief Trader
🤑📈🐂 #ETHUSD #CryptoHeist #ThiefTrader #EthereumHeist #LayeredEntries #CryptoTrading #RobTheMarket #MoneyHeistETH
$ETH Did The Poke Above All Time High!As I said in my last update it would be unusual to complete the Elliot wave motif wave without a poke above all time high first and we got that this week adding confluence to an expected retracement ahead in wave 2. Poke above all time high shows long term strength.
Weekly RSI has bearish divergence from the wave 3 top in overbought territory.
Initial target is the (4) bottom and weekly pivot point at $3200 followed by $2800 High Volume Node and then the weekly 200EMA, S1 pivot and High Volume Node support at $2250. I will look out for longs in these areas.
Analysis is invalidated if proceed into price discovery.
Safe trading

ETH parabolic advanceThere seems to be a deviation from the previously communicated ETH BTC parabolic advance.
However, the prior curve fitting was tentative and there may still be a lot of steam in ETH BTC to the .05188 range by mid/late October
Sharing an updated alternative curve that does retain a parabolic advance, even with the price action between prior publication and today.
Will increase exposure to ETH after exiting, should the ETH BTC pair demonstrates fit to the new parabolic advance.


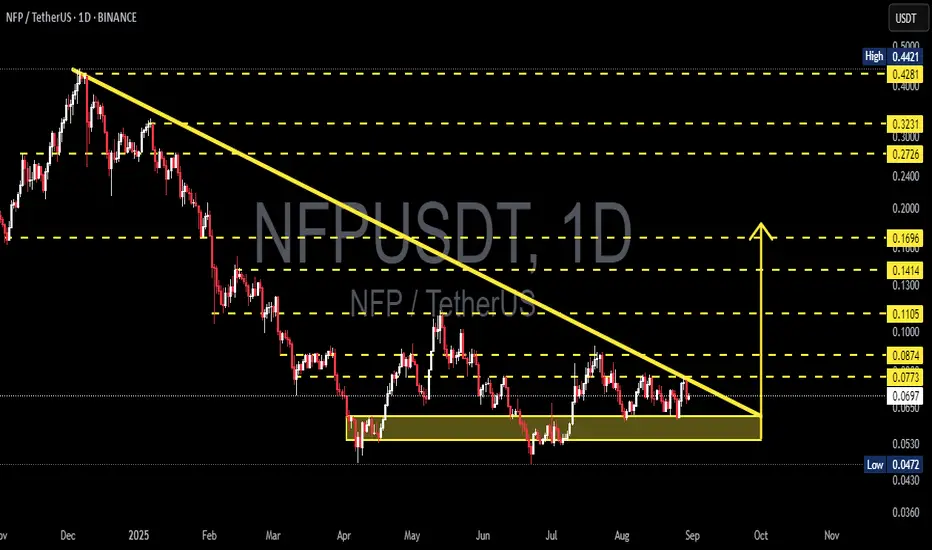
NFP/USDT — Descending Triangle, Watch for Breakout or Breakdown?The pair NFP/USDT is currently at a critical juncture. The chart shows a clear Descending Triangle pattern: a series of lower highs (seller pressure) aligned with a falling trendline, while a strong horizontal support zone around 0.047 – 0.062 continues to hold as buyers defend it.
Typically, this formation suggests a bearish continuation, but as the price approaches the triangle’s apex, the probability of a bullish breakout also rises if supported by strong volume. In other words, NFP is now in a “do or die” position — preparing for its next major move.
---
🔎 Technical Structure & Key Levels
Main Pattern: Descending Triangle → generally bearish bias, but breakout upside is possible.
Current Price: ~ 0.0697, very close to the apex, signaling an upcoming strong move.
Strong Support Zone: 0.047 – 0.062 (demand area repeatedly tested).
Key Resistance near trendline: 0.077 – 0.087 (bullish breakout confirmation zone).
Next Resistances: 0.1105, 0.1414, 0.1696, then 0.2726 – 0.3231, and 0.4421 (major historical resistance).
---
📈 Bullish Scenario — Breakout Potential
If NFP breaks above the descending trendline and closes a daily candle above 0.077 – 0.087 with strong volume, a medium-term reversal could be underway.
🎯 Short-term target: 0.1105
🎯 Next targets: 0.1414 – 0.1696
🎯 Extended targets: 0.2726 – 0.3231, up to 0.4421 if momentum sustains
🔑 Additional confirmation: successful retest of the breakout zone, proving buyer strength.
---
📉 Bearish Scenario — Breakdown Continuation
If price breaks below the strong support 0.0472, the descending triangle confirms as a bearish continuation pattern.
🎯 First target: 0.036 – 0.030 (next historical support zone).
🎯 Deeper targets possible if selling pressure accelerates.
🔑 Additional confirmation: failed retest of the broken support, turning into resistance.
---
⚖️ Key Takeaways
NFP/USDT is at a decision point. The descending triangle is tightening and a big move is near.
Bias: Slightly bearish due to the pattern, but bullish reversal remains possible with a breakout above 0.087 and strong volume.
Conservative traders: Wait for confirmation before entry. False breakouts/breakdowns are common without volume.
Risk management is crucial: set stop-loss below the support zone for longs, or above breakout levels for shorts.
---
As price approaches the apex of the triangle, volatility usually spikes. That means a decisive move is coming soon — either a breakout rally or a bearish continuation. For now, NFP/USDT is a must-watch: will buyers flip the script, or will sellers win the battle?
#NFP #NFPUSDT #Crypto #TechnicalAnalysis #DescendingTriangle #SupportResistance #Breakout #BearishOrBullish #CryptoTrading
Ethereum ETH Analysis: 1D Bullish Trend with Order Block Support🔎 I’m currently looking at Ethereum (ETH), which is showing a strong bullish trend on the daily timeframe 📈. Price has pulled back significantly into a daily bullish order block 🟢 — a previous accumulation range that I expect to act as a key support level.
On the 30-minute timeframe ⏱, I’m watching closely for a bullish break of structure 🔑 as confirmation for a potential long entry 🎯.
⚠️ Not financial advice.

Ethereum sideways ┆ HolderStatBINANCE:ETHUSDT on the daily chart is showing a consolidation phase after rallying past 4200. Price could test the 4500 zone before continuing higher. Resistance remains at 5000, and a breakout there could extend to 5200+.

ETH 1H Analysis – Key Triggers Ahead | Day 6💀 Hey , how's it going ? Come over here — Satoshi got something for you !
⏰ We’re analyzing ETH on the 1-hour timeframe timeframe .
🔭 On the 1H timeframe for Ethereum, we can observe that ETH broke its midline to the downside and moved toward the bottom of the box. With the slightly higher-than-expected U.S. inflation news, Ethereum bounced again from the bottom of its box, and now we need to see whether it can consolidate above the midline or not.
⛏ The key RSI levels are at 50 and 30, and once the oscillation surpasses these thresholds, Ethereum can begin its main move.
💰 The volume and number of red candles increased after the midline break, accompanied by selling pressure. The volume and size of Ethereum’s reversal candles can show us the strength of the rebound and the strength of the box bottom, since the bottom has not been lost yet.
📊 On the 1H ETHBTC chart, we can observe that if the bottom of the 1H box at 0.03972 is lost, more Ethereum will be sold and converted into Bitcoin. This index reflects the relative value between ETH and BTC. Breaking this marked level could serve as a confirmation for a short trade on Ethereum.
💡 The Ethereum alert zones remain the same as before, with the difference that for an early trigger we can consider a break and consolidation above the midline, which is relatively risky.
❤️ Disclaimer : This analysis is purely based on my personal opinion and I only trade if the stated triggers are activated .

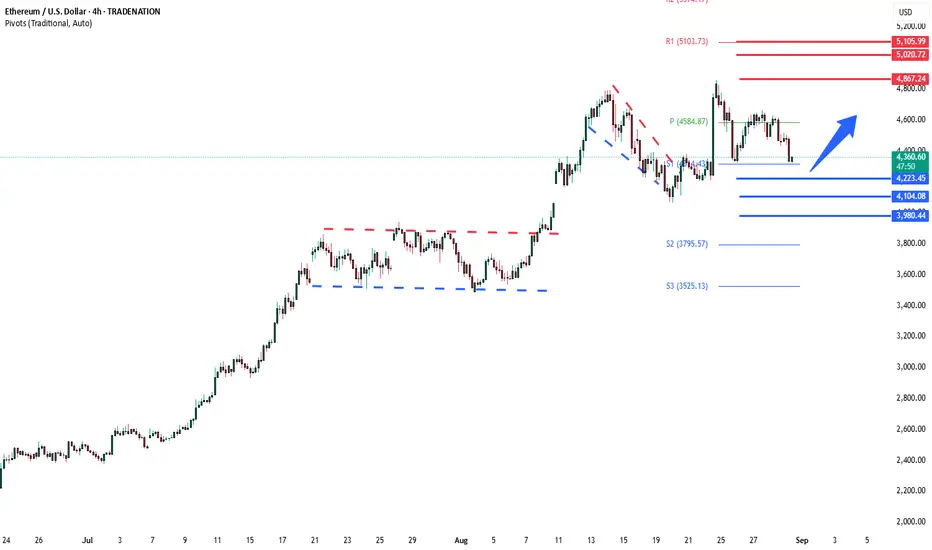
ETHUSD breakout retest ?The ETHUSD remains in a bullish trend, with recent price action showing signs of a corrective pullback within the broader uptrend.
Support Zone: 4,100 – a key level from previous consolidation. Price is currently testing or approaching this level.
A bullish rebound from 4,100 would confirm ongoing upside momentum, with potential targets at:
4,450 – initial resistance
4,730 – psychological and structural level
5,070 – extended resistance on the longer-term chart
Bearish Scenario:
A confirmed break and daily close below 4,100 would weaken the bullish outlook and suggest deeper downside risk toward:
3,990 – minor support
3,830 – stronger support and potential demand zone
Outlook:
Bullish bias remains intact while the ETHUSD holds above 4,100. A sustained break below this level could shift momentum to the downside in the short term.
This communication is for informational purposes only and should not be viewed as any form of recommendation as to a particular course of action or as investment advice. It is not intended as an offer or solicitation for the purchase or sale of any financial instrument or as an official confirmation of any transaction. Opinions, estimates and assumptions expressed herein are made as of the date of this communication and are subject to change without notice. This communication has been prepared based upon information, including market prices, data and other information, believed to be reliable; however, Trade Nation does not warrant its completeness or accuracy. All market prices and market data contained in or attached to this communication are indicative and subject to change without notice.
time to long your longs BTCI think. I would long it from here. As you can see here trend is the following people also expect some draw down here in September but we are aint getting any we are in 2017

Don’t Buy Ethereum Until You Watch This!In this episode, I take a skeptical look at Ethereum’s latest price action. We’ll break down the recent pullback, identify clear triggers for long setups, and discuss what happens if key levels fail. Plus, a quick educational tip on how ETH.D and BTC.D can signal the start of altseason.
⚠️ This content is for educational purposes only and not financial advice.


ETHUSD Buy SetupHi everyone.
As the price has touch the 4H OB, Now I'm waiting for a candle close above the swing high in the 15min TF to confirm a CHoCH in lower TF and then I'll set an order to buy.
Let's see what happens next...
Dear traders, please support my ideas with your likes and comments to motivate me to publish more signals and analysis for you.
Best Regards
Navid Nazarian

Potential bearish drop off?Ethereum (ETH/USD) has rejected off the pivot which lines up with the 50% Fibonacci retracement and could drop to the swing low support.
Pivot: 4,644.35
1st Support: 4,106.00
1st Resistance: 4,948.64
Risk Warning:
Trading Forex and CFDs carries a high level of risk to your capital and you should only trade with money you can afford to lose. Trading Forex and CFDs may not be suitable for all investors, so please ensure that you fully understand the risks involved and seek independent advice if necessary.
Disclaimer:
The above opinions given constitute general market commentary, and do not constitute the opinion or advice of IC Markets or any form of personal or investment advice.
Any opinions, news, research, analyses, prices, other information, or links to third-party sites contained on this website are provided on an "as-is" basis, are intended only to be informative, is not an advice nor a recommendation, nor research, or a record of our trading prices, or an offer of, or solicitation for a transaction in any financial instrument and thus should not be treated as such. The information provided does not involve any specific investment objectives, financial situation and needs of any specific person who may receive it. Please be aware, that past performance is not a reliable indicator of future performance and/or results. Past Performance or Forward-looking scenarios based upon the reasonable beliefs of the third-party provider are not a guarantee of future performance. Actual results may differ materially from those anticipated in forward-looking or past performance statements. IC Markets makes no representation or warranty and assumes no liability as to the accuracy or completeness of the information provided, nor any loss arising from any investment based on a recommendation, forecast or any information supplied by any third-party.

$ETHBTC - Weekly ChartBINANCE:ETHBTC | 1w
We got our initial test of the breakdown area, rejecting from lower band of anchored vwap.
Ideally, a proper retest of .030 to .026 before moving higher.
for CRYPTOCAP:ETH , I think it can drop to 4k-3.8k

Cronos Mega pump incoming! Based on this fractal comparison of Ethereum's cycle to CRO, I expect a mega run on this coin. It’s ready for a vertical move, just like we saw with Ethereum in 2020–2021. Watch for a big-picture breakout and a super moon.
As always, stay profitable,
– Dalin Anderson

ETHUSD ready to drop below 3200$Distribution looks done, secondary test is in — market ready to drop below $3200.

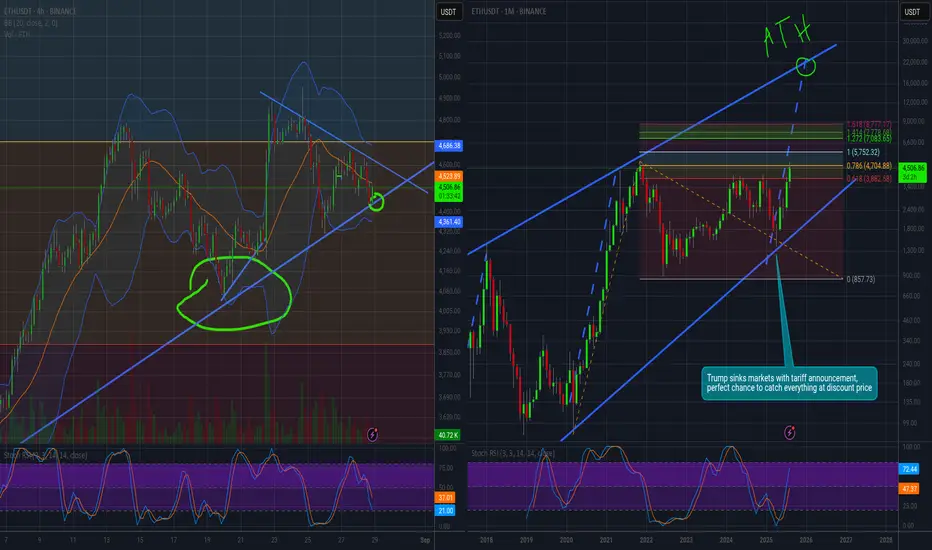
Bull Pennant Almost OverHere's hoping the trend line holds.
If the trend continues we could hit a new price target of 5752 according to trend-based fibonacci extension with 2020's covid impulse dip as the starting point.
Ethereum - Here comes the final breakout!🚀Ethereum ( CRYPTO:ETHUSD ) breaks the all time high:
🔎Analysis summary:
Finally, after a consolidation of about four years, Ethereum is back at the previous all time high. With the recent rally of more than +200%, bulls are flexing their muscles, preparing the breakout. So far, everything is playing out according to plan with new all time highs soon.
📝Levels to watch:
$5.000
SwingTraderPhil
SwingTrading.Simplified. | Investing.Simplified. | #LONGTERMVISION

Ethereum Exit Queue Hits $5B: Wall Street’s Big Bet?
Ethereum Exit Queue Hits $5B: Sell Pressure or Wall Street’s Big Bet?
Ethereum continues to dominate crypto headlines in 2025. The network’s staking system has reached an unprecedented milestone with nearly $5 billion worth of ETH awaiting withdrawal—a development that has sparked both optimism and concern. While some fear that this backlog could translate into significant sell pressure, others see it as part of a broader realignment toward institutional adoption.
At the same time, Ethereum’s spot ETFs are outperforming Bitcoin ETFs by a wide margin, drawing in nearly $1.83 billion in just five days—ten times the inflows of Bitcoin funds. This surge highlights a growing narrative: Wall Street is tilting its focus toward Ethereum, not only as a cryptocurrency but as a foundational layer of modern finance.
This article examines the implications of the record exit queue, the rise of Ethereum ETFs, and whether ETH is poised to outperform BTC as the crypto market’s dominant asset.
Ethereum’s Record Exit Queue: A $5B Test for the Market
Ethereum’s exit queue refers to the backlog of stakers who have requested to withdraw their ETH from the staking contract. Following Ethereum’s transition to proof-of-stake in 2022 and the Shanghai/Capella upgrade in 2023, staked ETH has become liquid, enabling participants to lock and unlock their holdings as they choose.
Today, that queue has swelled to nearly 5 million ETH—worth around $5 billion. This is the largest exit queue in Ethereum’s history, and it raises critical questions:
1. Will this ETH be sold on the open market?
After a 72% rally in the past three months, many stakers may be tempted to take profits, especially those who locked in ETH at lower prices during the bear market. A mass sell-off could put downward pressure on prices.
2. Or is this a rotation of capital?
Not all withdrawals translate into selling. Many institutional investors may be withdrawing ETH to redeploy it into spot ETFs, where liquidity, custodial security, and regulatory approval are more attractive. Others may seek higher yields in decentralized finance (DeFi) protocols, liquid staking derivatives, or alternative strategies.
3. What about long-term holders?
A sizable portion of Ethereum’s stakers are long-term believers in the protocol. For them, withdrawing doesn’t necessarily mean exiting—rather, it may signal repositioning into newer financial products that better fit their strategies.
Ultimately, the exit queue is both a sign of Ethereum’s growing liquidity and a potential near-term overhang on price.
The 72% Rally: Profit-Taking or Momentum?
Ethereum’s price surge—up 72% in just three months—gives context to the withdrawal queue. After a prolonged bear market, ETH holders have seen one of the strongest rallies in years. For many, the exit queue represents an opportunity to lock in profits at multi-month highs.
However, the rally is not just speculative. Several fundamental drivers are fueling Ethereum’s rise:
• ETF approvals and inflows are bringing unprecedented institutional demand.
• Layer 2 scaling solutions such as Arbitrum, Optimism, and Base are driving transaction volumes while reducing costs.
• Tokenization pilots by major banks and asset managers are increasingly choosing Ethereum as a settlement layer.
This means the rally is underpinned by both sentiment and structural adoption, making it harder to dismiss as a short-lived pump.
Ethereum ETFs: Outshining Bitcoin
One of the most striking developments is the flow of capital into Ethereum ETFs. In just five days, spot Ether ETFs have attracted $1.83 billion in inflows, compared to only around $180 million into Bitcoin ETFs. This 10-to-1 ratio in favor of Ethereum is rare, as Bitcoin has traditionally dominated institutional flows.
Why are ETFs favoring Ethereum?
1. Utility Beyond Store of Value
Bitcoin is often called “digital gold,” but Ethereum is more than a speculative hedge. It underpins decentralized finance, NFTs, tokenization, and smart contracts—areas with real-world utility that institutions can leverage.
2. Yield Through Staking
Unlike Bitcoin, Ethereum offers staking rewards. Even though ETF structures may not directly pass staking yields to investors, the narrative of a yield-bearing crypto asset appeals to long-term capital allocators.
3. Alignment with Wall Street’s Future
Ethereum’s programmability makes it easier for Wall Street to imagine building products and services on top of it. From tokenized bonds to on-chain settlement systems, Ethereum’s relevance extends beyond speculation.
As a result, institutional flows are tilting toward ETH, reinforcing its narrative as the infrastructure layer of finance.
Will Ethereum Outperform Bitcoin?
The question on every investor’s mind: can Ethereum outperform Bitcoin in this cycle?
Ethereum’s Tailwinds:
• ETF Momentum: With stronger inflows, ETFs could become a steady channel for demand.
• Broader Use Cases: Ethereum is not just money—it’s programmable finance.
• Institutional Adoption: Banks and asset managers are experimenting with Ethereum for tokenization and settlement.
Ethereum’s Risks:
• Sell Pressure: The $5B exit queue could weigh heavily on prices if too much ETH hits the market.
• Competition: Alternative blockchains like Solana and Avalanche are vying for institutional attention with faster throughput.
• Regulation: Ethereum’s staking system could attract more scrutiny than Bitcoin, which is generally classified as a commodity.
Bitcoin’s Defenses:
Bitcoin still has the advantage of being the original, most secure, and most decentralized crypto asset. Its supply cap of 21 million gives it unmatched scarcity. But in terms of growth opportunities and utility, Ethereum may have the edge.
Wall Street’s Tilt Toward Ethereum
Ethereum’s ETF inflows and VanEck CEO Jan van Eck’s recent remarks calling ETH “the Wall Street token” suggest a broader narrative shift. Wall Street is beginning to view Ethereum not just as another cryptocurrency, but as the financial operating system of the future.
• Banks are exploring blockchain-based stablecoin transfers.
• Asset managers are launching tokenization pilots on Ethereum.
• Investors are reallocating from Bitcoin to Ethereum ETFs.
This alignment means Ethereum is no longer just a crypto-native story. It is becoming central to how global finance evolves.
Looking Ahead: Short-Term Pressure, Long-Term Promise
The $5 billion exit queue is a short-term concern. If even a fraction of that ETH is sold, prices could face volatility. But in the bigger picture, withdrawals represent liquidity and flexibility—a sign of a maturing ecosystem.
At the same time, Ethereum’s ETF success and its growing reputation as Wall Street’s blockchain suggest that institutional adoption is only beginning. If these inflows persist, Ethereum could not only outperform Bitcoin but also cement its role as the primary financial infrastructure of the digital age.
Conclusion
Ethereum is at a crossroads. On one hand, the record $5 billion exit queue raises fears of sell pressure and short-term volatility. On the other, Ethereum’s ETF dominance, institutional adoption, and 72% rally signal powerful momentum.
The battle between profit-taking and institutional accumulation will define Ethereum’s near-term price action. But the broader trend is clear: Ethereum is no longer just competing with Bitcoin—it is carving out its identity as the backbone of decentralized and traditional finance alike.
As Wall Street piles into ETH and banks experiment with on-chain settlement, Ethereum’s claim to be the future of finance grows stronger. Whether it outperforms Bitcoin in this cycle remains to be seen, but one thing is certain: Ethereum has secured its place at the center of the crypto narrative.

Strong Support at $4448The blue is the demand zone and the red is the supply zone. So as you can tell demand’s beginning at $4448.
