ETHEREUM (ETHUSD): Bullish Trend Continues
I see a nice bullish confirmation on Ethereum after a recent pullback.
The price formed a double bottom pattern and violated its neckline
and a resistance line of a falling wedge pattern.
With a high probability, the market will go up.
Goal - 4741
❤️Please, support my work with like, thank you!❤️
I am part of Trade Nation's Influencer program and receive a monthly fee for using their TradingView charts in my analysis.
Ethereum (Cryptocurrency)

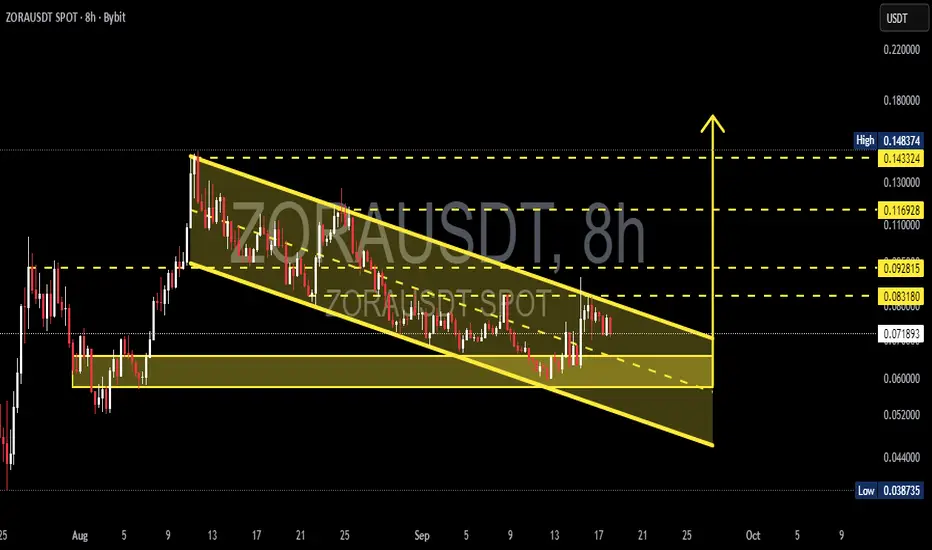
ZORA/USDT — Descending Channel Reaching Decision Point?Currently, ZORA/USDT is trading inside a well-defined descending channel, formed since the mid-August peak. The structure shows a sequence of lower highs and lower lows, reflecting mid-term bearish control. However, this pattern also resembles a falling wedge, which often signals a potential bullish reversal if a breakout occurs.
---
🔹 Technical Structure
Main Pattern: Descending channel (slightly converging, similar to a falling wedge).
Current Price: ~0.0719 USDT
Demand Zone: 0.055 – 0.062 (strong accumulation area tested multiple times).
Key Support: 0.0387 (chart low).
Resistance Levels:
0.0831 → first breakout trigger
0.0928 → next psychological resistance
0.1169 → mid-term target if momentum holds
0.1433 – 0.1483 → major resistance zone / previous rally high
---
🔹 Bullish Scenario
1. Price must close above the channel’s upper trendline and 0.0831 on the 8H timeframe.
2. A valid breakout should be confirmed with strong volume + successful retest of the upper channel as new support.
3. If confirmed, bullish targets are:
🎯 Target 1 → 0.0928
🎯 Target 2 → 0.1169
🎯 Target 3 → 0.1433 – 0.1483
📍 Note: A failed breakout (false breakout) could send price back into the channel.
---
🔹 Bearish Scenario
1. If price gets rejected at the upper channel or fails to close above 0.0831, downside pressure may return.
2. A strong breakdown below the demand zone (0.055–0.062) opens the path toward 0.0387.
3. Bearish outlook is invalidated if the price sustains above 0.0831 with confirmation.
---
🔹 Conclusion
ZORA/USDT is approaching a critical decision zone.
The descending channel structure provides two clear paths:
🚀 Bullish breakout above 0.0831 → upside targets 0.0928 – 0.1433.
📉 Breakdown below 0.055–0.062 → potential continuation toward 0.0387.
Key decision levels: 0.0831 (resistance) and 0.055–0.062 (support zone).
---
📢 Trading Notes
Always wait for 8H/1D candle close for confirmation before execution.
Risk management is crucial — never enter without a stop loss.
Descending channels often lead to explosive moves once a breakout is confirmed — be prepared.
---
ZORA/USDT is consolidating inside a descending channel. 0.0831 is the breakout trigger for a bullish reversal, while 0.055–0.062 remains the key demand zone. Breakout → targets 0.0928 – 0.1433. Breakdown → risk toward 0.0387. Watch candle close + volume for confirmation.
---
#ZORA #ZORAUSDT #Crypto #Altcoins #TechnicalAnalysis #TradingView #ChartPattern #Breakout #SupportResistance #PriceAction
ETHERFI Double BottomOverview of Ether.fi
CRYPTOCAP:ETHFI on the Ethereum blockchain that allows users to stake their Ethereum (ETH) while maintaining control over their private keys.
It offers a liquid staking derivative token called eETH, enabling users to earn rewards and participate in decentralized finance (DeFi) activities.
Key Features
Liquid Staking Token (eETH)
Minting eETH: Users can mint eETH by staking their ETH, which allows for participation in various DeFi activities.
Reward Streams: Stakers earn multiple types of rewards, including:
Ethereum staking rewards
Ether.fi Loyalty Points
Restaking rewards (including EigenLayer points)
Liquidity provision opportunities in DeFi protocols
Cash Back Credit Card
Non-Custodial Card: Ether.fi offers a cash back credit card that connects to users' portfolios.
Cash Back Rate: Users earn 3% cash back on all purchases.
Global Acceptance: The card is accepted at over 100 million locations worldwide.
Market Information
Token Details
Total Value Locked (TVL) $12.487 billion
Circulating Supply 470 million ETHFI tokens
Trading Information
Exchanges: ETHFI can be traded on platforms like Gate, OKX, and Binance.
Daily Trading Volume: Approximately $83 million.
Ether.fi aims to enhance the Ethereum staking experience by providing innovative financial products and maximizing user rewards through its decentralized platform.

LQTY/USDT — Falling Wedge, Key Reversal Opportunity?On the daily timeframe (1D), the LQTY/USDT pair is showing an interesting setup. The price is currently trading around 0.862 USDT, approaching the upper boundary of a falling wedge pattern that has been developing since late July.
---
🔎 Main Pattern: Falling Wedge
A falling wedge forms when the market prints lower highs and lower lows within a narrowing range.
This formation is typically considered a bullish reversal pattern, often leading to an upside breakout if supported by strong volume.
The wedge is tightening, signaling that the market is entering a decision phase.
---
📈 Bullish Scenario
1. Breakout confirmation: requires a daily close above the wedge resistance (~0.95–1.00 USDT) with rising volume.
2. Upside targets:
Initial target: 1.07 USDT (nearest resistance).
Next targets: 1.37 USDT and 1.61 USDT.
If momentum extends, a larger target lies around 2.13 USDT.
3. Entry strategy:
Aggressive traders may enter on the breakout.
Conservative traders may wait for a retest of the breakout line before entering.
4. Risk management: place stop-loss below wedge support (~0.75–0.70) or recent swing low.
---
📉 Bearish Scenario
1. Failure at resistance: rejection at the wedge upper trendline would keep the downtrend intact.
2. Breakdown confirmation: a daily close below wedge support (~0.70–0.62).
3. Downside targets:
Immediate supports: 0.70 → 0.62 USDT.
Bearish extension: 0.431 USDT (previous major low).
4. Note: false breakdowns can occur on low volume, so strict stop-loss discipline is crucial.
---
⚖️ Conclusion
LQTY is now at a critical decision point.
A confirmed breakout could trigger a reversal with upside potential toward 1.07 → 1.37 → 1.61 USDT, and possibly 2.13 USDT in the long run.
Failure to break higher or a confirmed breakdown below the wedge would likely extend the bearish trend toward 0.62–0.43 USDT.
---
📌 Trading Notes
Wait for confirmation before entering — volume and daily close matter.
Manage risk properly; altcoins like LQTY are highly volatile.
This is technical analysis, not financial advice. Trade at your own risk.
---
#LQTY #LQTYUSDT #Crypto #TechnicalAnalysis #FallingWedge #Breakout #SupportResistance #Altcoins #PriceAction

BMNR may Open BIG on Monday..BMNR is the largest holder of Ethereum in the world. If you look at ethereum right now, it's heading towards making a new all time high. Obviously, the price of this stock is tied to the price of ethereum. Trading is closed right now for the weekend. If ethereum continus to trend up, this stock will explode on monday opening, with realistic targets as high as $150. The stock can go much higher than that, even up to $800 or more.
Keep an eye on this. Not investment advice.

ETH re-distribution patternHere we have a classic Wyckoff re-distribution pattern for a continuation to the downside. I'm looking for 4200 by Friday.

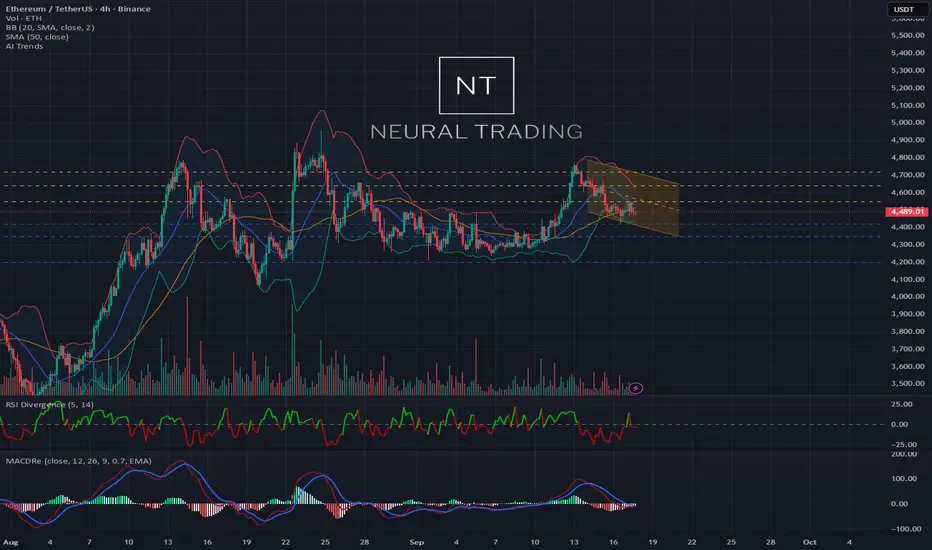
#ETH: Daily AI Market Breakdown. 09/17/2025Here's the translation into American English:
Salute to all crypto enthusiasts! 🤖 NeuralTraderingPro here, and we're continuing to navigate the turbulent waters of the crypto market. Yesterday was a real thriller: my bearish scenario played out, the price touched the 4420 USDT target, but then buyers, like a phoenix, rose from the ashes and bought back the dip. This wasn't just a level defense; it was a demonstration of strength. The market showed it's not ready for an unconditional surrender. Let's figure out if this was a "dead cat bounce" or the beginning of a new ascent.
Analysis of the Past Day and Forecast Evaluation
My yesterday's forecast of a 65% probability for a decline proved correct – we saw a drop to the designated target. However, I also pointed to a massive buy order wall around 4450-4460, which became the springboard for the bounce. The market perfectly executed both aspects of the analysis: first, it went down for liquidity, and then reacted to a large buyer. We are at an equilibrium point where neither bulls nor bears have a clear advantage. The battle for initiative continues.
Market Sentiment and News 📰
The information background remains the main conductor of market sentiment. Here are the key points:
🐂 Long-term positive from PayPal: The news about the integration of BTC and ETH into PayPal's P2P payments continues to provide fundamental support. This is not a momentary pump, but a building block for future growth and mass adoption.
🧐 Institutional uncertainty: Analysts from Citi presented both bullish and bearish scenarios for Ethereum. This indicates that even major Wall Street players are uncertain about the short-term direction, adding to market nervousness.
💰 "Smart money" is buying the dip: Data showing an inflow of $3.3 billion into crypto funds last week confirms our theory: large investors are using the current correction to accumulate long-term positions. They are not panicking; they are buying.
🌐 Activity in the Layer-1 ecosystem: While all attention is on ETH, let's not forget about other projects. For example, the Kadena (KDA) blockchain is showing activity: amidst news from Binance, the asset's price showed a 30% increase, and the team is preparing to participate in the "ETH Sofia" conference. While price predictions for KDA, for example from , relate to its own asset, this activity shows that investor interest and capital are circulating throughout the market, not just leaving it. This is a sign of the health of the entire crypto industry.
Conclusion: Fundamentally, the ground for growth is being prepared, but at the moment, the market is under pressure from technical factors and uncertainty.
Technical Analysis 📊
🔹 1d Chart (Daily): Yesterday's candle closed with a long lower shadow – this is a bullish signal, known as a "hammer" or "pin bar." It indicates that buyers decisively bought back the dip. The price is trying to return above the SMA 20 (blue line). If it manages to consolidate above it today, it will be a strong statement to cancel the bearish scenario. RSI bounced off the 50 level, showing renewed buyer interest. MACD still looks weak and threatens a bearish crossover. The situation is on the edge.
🔹 4h Chart (Four-hour): Here, the key battle unfolds. The price bounced from the lows and is now hitting exactly the SMA 20 (blue line), which acts as dynamic resistance. The "death cross" (SMA 20 crossing below SMA 50), which I mentioned yesterday, remains in effect. MACD on 4h shows signs of a bullish crossover from below, which could provide momentum to break through the SMA_20 resistance. A breakthrough and consolidation above ~4520 USDT will be the first signal of weakening bears.
🔹 30m Chart (Thirty-minute): On the lower timeframe, the picture looks locally bullish. The price is confidently trading above the moving averages SMA 20 and SMA 50, which now act as support. RSI is in the bullish zone. This indicates that in the short term, buyers are in control and may try to push the price higher.
Order Book Analysis (DOM) ⚖️
Current price ~4490.0 USDT. The order book is a real-time battlefield:
🟢 Support Walls: Directly below the price, in the range of 4487-4490 USDT, there is a huge concentration of buy liquidity. Orders totaling ~110k USDT, ~102k USDT, ~73k USDT create a solid floor. Buyers clearly don't want the price to go down again.
🔴 Resistance Walls: The main enemy is right in front of us. At 4490.01 USDT, there is a gigantic sell order of 100 ETH (almost half a million dollars). This is a monolithic wall. Further, up to 4493 USDT, a series of obstacle orders are placed.
Conclusion: The order book shows a clinch. Sellers have set up a huge wall to stop the bounce. Buyers have built an echeloned defense just below. A breakthrough of the wall at 4490.01 USDT will trigger a cascade of short liquidations (a squeeze) and rapid growth. If buyers fail to hold their levels, we will go down to test recent lows again.
Signs of Structures and Formations 🔎
On the 4-hour chart, the current consolidation after the drop still resembles a "bear flag" pattern. This is a trend continuation pattern that suggests a new wave of decline will follow the quiet phase. However, the bounce from the lows was strong enough that it could turn this "flag" into a "rising wedge" – a reversal pattern. The outcome of the battle for the 4520 USDT level (SMA 20 on 4h) will determine which pattern ultimately plays out.
Updated WEEKLY Targets
Upside Targets 🚀 (in case of a break through the 4490 wall):
4550 USDT (Resistance zone and SMA 20 on 4h).
4640 USDT (Area of SMA 50 on 4h, strong resistance).
4720 USDT (Local high before the drop).
Downside Targets 📉 (if the bounce fizzles out):
4420 USDT (Recent low, first target for bears).
4350 USDT (Key support — SMA 50 on the daily chart).
4200 USDT (Powerful structural support level).
Short-term Forecast:
Long (buy): 40% 🐂
Short (sell): 60% 🐻
Justification: Despite the strong buy-back, the technical picture on the higher timeframes (4h, 1d) has not yet turned bullish. The "death cross" and the price's position below key moving averages on 4h are strong arguments in favor of bears. The giant sell wall in the order book is currently holding back growth. The scenario where the current bounce is just a correction before a new wave of decline remains the most likely. However, the strength of buyers at the lows forces caution.
Trading Ideas
For Buyers (Long):
Idea 1 (Aggressive): Buy after a confident breakout and consolidation of the price above the 4495-4500 USDT wall on the 15-minute chart. Target: 4550 USDT. Stop-loss: below 4470 USDT.
Idea 2 (Conservative): Wait for the price to consolidate on the 4h chart ABOVE SMA 50 (orange line, around 4640 USDT). This will be a powerful signal of a trend change. Target: 4720 USDT. Stop-loss: below 4580 USDT.
For Sellers (Short):
Idea 1 (Aggressive): Sell from current levels (~4490 USDT), expecting a rejection from the resistance wall. Target: 4420 USDT. Stop-loss: tight, above 4515 USDT.
Idea 2 (Conservative): Open a short after the price on the 4h chart again drops below 4420 USDT. This would mean the "bear flag" is activated. Target: 4350 USDT. Stop-loss: above 4470 USDT.
Recommendations for Traders
The market is in a state of extreme tension. Trading within the current narrow range is very risky. The best tactic is to wait for a breakout. Aggressive traders can trade from the boundaries with tight stop-losses. Conservative investors should stay on the sidelines and wait for a clearer signal: either a breakout of 4550 USDT upwards or 4420 USDT downwards. Always use stop-losses!
May your trades be cold-blooded, and your profit inevitable! Trade according to the plan, not emotions.
Liked the breakdown? Support it with a like 👍 and subscribe so you don't miss the next analysis! 🚀
For couple years we've said Crypto = StocksWant more proof Crypto = Stocks now?
CRYPTOCAP:TOTAL 3 = NO CRYPTOCAP:BTC or CRYPTOCAP:ETH
This index looks identical to TVC:RUT = Russell 2k
Sorry we don't post much. It's a lot to keep 1 social account, let alone 2 - 3!
Please see our profile for more info.

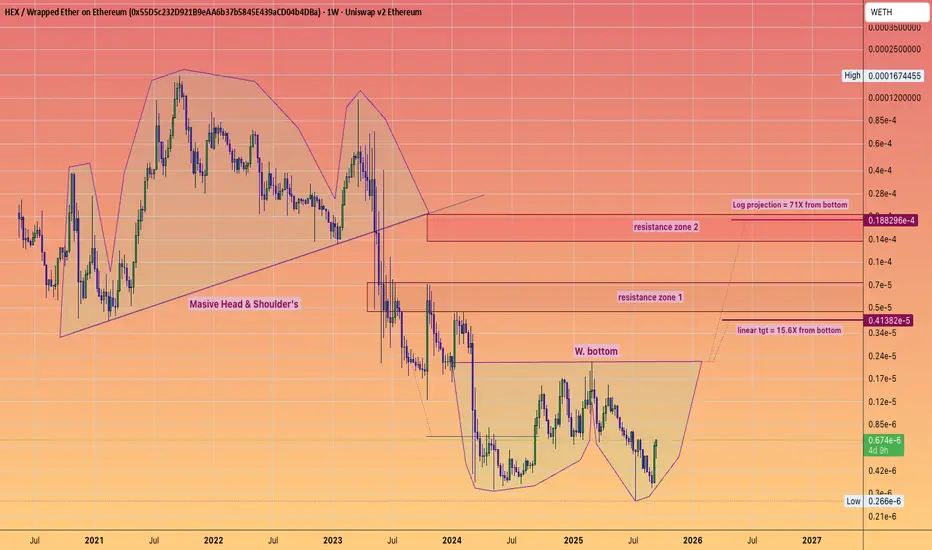
71XA 71X Multiple vs Ethereum no less!
The chart is self explanatory.
We have two Large Technical structures.
The first one, met it's Log target and overperformed.
Whilst the second has yet to trigger.
Yeah Still early!
Aren't I a caring guy in sharing this idea ;)
#HeadandShoulders
#Wpattern
#DoubleBottom
BTC/USDT | Bitcoin Rally Setup – Next Stops: $116.7K and Beyond!By analyzing the Bitcoin chart on the 4-hour timeframe, we can see that the price is currently trading around $115,500. As long as it holds above the key support zone of $113,700–$115,300, I expect Bitcoin to continue its bullish move toward higher levels.
The next possible upside targets are $116,700, $117,450, and $118,600. Longer-term targets will be shared in future updates!
Please support me with your likes and comments to motivate me to share more analysis with you and share your opinion about the possible trend of this chart with me !
Best Regards , Arman Shaban

Ethereum Trade Setup📲 NFX Trade Alert – Swing Setup
💹 Instrument: Ethereum COINBASE:ETHUSD
🛒 Trade Type: Swing – Buy at Market
📍 Entry: $4,690
⛔ Stop Loss: $4,624 (tight stop placed just below the S/R breakout level)
✅ Target Profit: $5,050
📊 Trade Setup Analysis – BINANCE:ETHUSD
MARKETSCOM:ETHEREUM Ethereum showed no weakness over the weekend, breaking decisively above the $4,650 resistance and extending toward $4,750. Price has since retested $4,650(23.6% Trend Fib), with strong rejection confirming this former resistance is now acting as solid support.
We’re applying a tight stop loss at $4,624, just below the breakout level, to minimize risk while maintaining bullish exposure.
With this breakout confirmed, there’s no major resistance until the previous ATH around $4,950. The path remains open for continuation higher.
⚖️ Risk management remains key - even strong, high-probability setups demand discipline and protection. 💚

Ethereum - What's Next?📢 NFX Market Update – COINBASE:ETHUSD
Similar to COINBASE:BTCUSD , BINANCE:ETHUSD faced strong resistance at $4,785 - no surprise, given the historical weight of that zone. Price has since retreated to retest the previous breakout level, which is now likely to act as support if rejection holds.
This zone also aligns with a block order level, previously marked by multiple rejections before the eventual breakout. While I expect support to hold, there is a chance of a deeper test toward the 200-day SMA before continuation.
Overall, the chart structure remains bullish, and fundamentals are also strongly supportive. With key news and macroeconomic data scheduled mid-week, I remain bullish on COINBASE:ETHUSD heading forward.

Don’t Buy Ethereum Yet: The Liquidity Sweep Trap You Must AvoidBefore the liquidity sweep , Ethereum’s price action can be highly unpredictable. Traders are advised to hold off on buying, stay patient, and focus on disciplined crypto risk management. Waiting for confirmation signals not only reduces exposure to volatility but also improves the effectiveness of any Ethereum trading strategy.

ETH 1H Analysis - Key Triggers Ahead | Day 20👋🏻 Hey everyone! How’s it going? Hope you’re all doing well.
❄️ Welcome to Crypto Winter.
⏰ Today, we’ll be analyzing ETHUSDT and exploring its potential opportunities.
👀 On the 1-hour timeframe for Ethereum, we observe that after exiting its box, Ethereum entered a downtrend, marked by a trendline. As much as attention was given to it, suddenly it was ignored, and buyers could not keep the price high enough. Ethereum’s triggers are completely defined — with a breakout and confirmation of these zones, Ethereum can create trading opportunities for us.
🧮 The key RSI oscillator levels are 59 and 30. If momentum passes these levels, Ethereum could start its move, although it may be ignored at times. After rejection from the $4,757 zone, red candles were significantly larger than green candles. Today, Ethereum’s volume is increasing, and we need to see what will happen with the news for Ethereum.
💸 The ETH/BTC pair, or Ethereum versus Bitcoin, is currently in a compression resembling multi-timeframe accumulation. Exiting this compression can clearly determine Ethereum’s direction. The upper and lower bounds of this compression can be considered alert zones, where you can observe price behavior when it reaches these levels.
🔴 Today’s news could have a significant effect on Ethereum. Especially if a stepwise interest rate cut occurs, Ethereum could reach targets above $6,000 and create a larger DeFi space, particularly in terms of contract and collateral infrastructure.
🧠 To enter Ethereum positions, we need to wait for a bullish move in ETH/BTC, confirmation in ETH/USDT, and a breakout of key resistances. After these breakouts occur, we can enter at each level and stay in the trades as long as the market allows.
❤️ Disclaimer : This analysis is purely based on my personal opinion and I only trade if the stated triggers are activated .

Rate Cuts, Liquidity, and BTC: Why 120K Is the Danger ZoneYesterday , while everyone was screaming about a Bitcoin dump, we caught the breakout of that resistance I showed you.
Today, I want to talk about the upcoming rate cut news , what could happen after it, and what we should do with our open positions.
Now personally, I’m still holding the breakout position we entered a week ago . I didn’t secure any profits, and honestly—I didn’t even want to. Because if the Fed cuts rates, we could kick off the next leg of this uptrend.
But keep this in mind: opening fresh positions around 120K IS NOT EASY AT ALL. Why?
Because there’s massive liquidity up there, huge volatility, and the chances of getting stopped out are very high. That’s exactly why I’d rather hold my position from earlier than be forced to open new ones in that zone.
👉 Let’s look at yesterday’s daily candle: it closed super bullish. This shows the market is leaning positive on the idea of a rate cut. But is this candle just front-running the news? Hard to say. We can’t exactly go ask every trader if they bought because of the Fed. So, better not overthink it.
I personally expect a short-term dip after the news drops. But more important than the cut itself are Powell’s words. If he signals more cuts are coming, markets could explode higher. If he says “not anytime soon,” we might get a pullback.
⚠️ My advice:
If you don’t already have a position, stay on the sidelines for a few hours. Any stop loss you put now has a big chance of getting hit.
But if, like me, you’re already in from the earlier triggers, just hold. It’s worth it.
For me, I’m also long on GBP/USD, and I didn’t secure profits there either—I’m waiting to see how it reacts.
👉 Quick look at BTC.D: dominance is rising with Bitcoin, which means it’s smarter to keep focus on BTC rather than altcoins. When dominance turns bearish again, that’s when we’ll shift back to alts.
This is why for the past few days I’ve been saying: stick with Bitcoin. Liquidity is flowing into it.
Ethereum? It gave back almost 70% of its recent move.
LONG STORY SHORT: don’t do anything stupid here. The best play, if you don’t have an open position, is to stay patient. Don’t FOMO.
Remember: the most important thing is not Bitcoin’s price itself. It’s stop-loss size, liquidity zones, and momentum. here in Skeptic Lab, that’s exactly what we dig into.
I’ll try to post another update after the Fed news drops.
Until then, stay safe. Peace ✌️

BTC Eyes 120K but 115K Support is the Last LineCRYPTOCAP:BTC is currently trading around 116K after a strong run-up. The chart shows a rising wedge pattern forming, with immediate support sitting near 115K. If this level holds, BTC could make another push toward the upper resistance zone around 120K.
On the flip side, a breakdown below 115K may trigger a short-term correction, sending price lower before bulls step back in.
Overall, BTC is in a critical zone, holding support keeps the bullish momentum alive, but a rejection at resistance could slow things down.
DYOR, NFA
Stay tuned for more update

ETH Awaits Fed Decision, High Volatility AheadCRYPTOCAP:ETH Update
Back on August 21, when news broke about a possible Fed rate cut on September 17, ETH instantly jumped nearly 14%. Fast forward to today, the actual announcement is scheduled for 2 PM ET, and the market is on edge.
There’s a strong probability of a rate cut, which could inject fresh momentum and push ETH higher. But if the Fed keeps rates unchanged, we could see a sharp downside correction as risk assets react.
Best approach right now? Stay patient. Wait for the full announcement from Powell, his tone will matter as much as the numbers. Extreme volatility is expected around that time, so caution is key.
DYOR, NFA
#PEACE

Ethereum to $15,000Ethereum to $15,000 during the completion of Wave 5. Ethereum is in a bullish triangle correction. Breakout from correction will complete pattern.

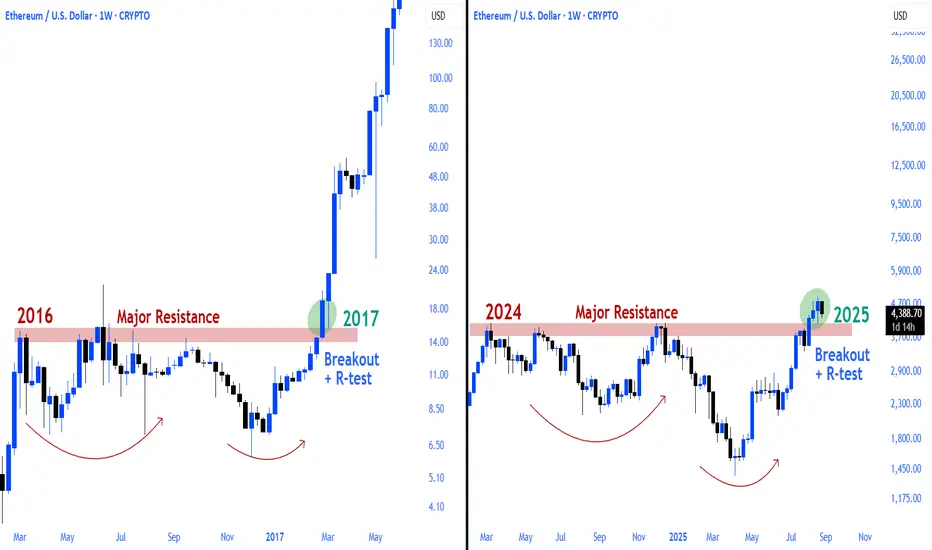
ETHEREUM Is it realistic to expect last Cycle's rally?Ethereum (ETHUSD) has been practically consolidating since the mid-August High, following an impressive rally on the April 07 Low. Technically it is coming off a 1W MA50/100 Bullish Cross.
It is the exact same pattern that confirmed ETH's massive parabolic rise (green Channel Up) during the previous Cycle in August 17 2020. The 1W RSI fractals between the two sequences are similar.
However, time-wise we are not in the same stage as last Cycle, in fact we are much closer to the end of the 4-year Cycle model. If there is still some time to repeat such a parabolic run, the price is 'limited' by the 1.618 Fibonacci extension at $13500, which again will be a wonderful and increasingly optimistic target for this Cycle Top.
Do you think it is realistic to expect such repeat at this stage?
-------------------------------------------------------------------------------
** Please LIKE 👍, FOLLOW ✅, SHARE 🙌 and COMMENT ✍ if you enjoy this idea! Also share your ideas and charts in the comments section below! This is best way to keep it relevant, support us, keep the content here free and allow the idea to reach as many people as possible. **
-------------------------------------------------------------------------------
💸💸💸💸💸💸
👇 👇 👇 👇 👇 👇

$8 Billion ETH Maturing May Push Ethereum Price to New HeightsEthereum is currently trading at $4,495, just below the $4,500 support line. If the decline extends, ETH may slip toward $4,307, but deeper losses appear less likely given the strong investor positioning.
The maturing supply and bullish long-term outlook indicate that Ethereum could soon reverse course. With fewer coins entering circulation, the altcoin has structural support for renewed upward momentum despite short-term volatility.
If Ethereum reclaims $4,500 as support, the path to $4,775 opens. A move past this level would invalidate the bearish thesis, reinforcing confidence that ETH could continue its climb toward new highs

Bitcoin, Ethereum Breakout: 401(k) funds & the next "Altseason"Bitcoin is up 10% in August, driven by strong ETF inflows and a game-changing executive order allowing 401(k) retirement funds to invest in cryptocurrencies, potentially bringing trillions of dollars into the sector.
Technically, Bitcoin and Ethereum are breaking out toward multi-year highs, with BTC leading and ETH close behind—setting the stage for a possible "altseason" if these levels hold and capital rotates into altcoins.
This content is not directed to residents of the EU or UK. Any opinions, news, research, analyses, prices or other information contained on this website is provided as general market commentary and does not constitute investment advice. ThinkMarkets will not accept liability for any loss or damage including, without limitation, to any loss of profit which may arise directly or indirectly from use of or reliance on such information.

The Fed Meeting and Its Further Play in EthereumCRYPTOCAP:ETH has returned to the trendline. Even if there another short-term drop, thats just part of the futures game - it can't happen without it.
Ahead of the Fed meeting, the market will likely move upward, so that no one can buy cheap after a positive decision on lowering the key rate.
Looking at the recent candles, enough longs have been closed to allow growth without abuse.
Funding across all exchanges has stabilized.
CRYPTOCAP:ETH outflows are starting to exceed inflows.
There nothing to look for down below - everything points to growth.
If it’s not too much trouble, support the post. Wishing you all the best!
