ETHEREUM Analysis (12H)A large amount of liquidity has been hunted at the top, which corresponds to the all-time high. After this liquidity was taken, the price entered a bearish structure with strong momentum.
For this bearish structure to reverse or slow down, sufficient liquidity needs to be collected from the lower areas of the chart.
There is a possibility of a temporary rebound from the current levels, but the main reversal should come from the lower zone that we have identified.
We still maintain this outlook on Ethereum in the daily and 12-hour timeframes
Do not enter the position without capital management and stop setting
Comment if you have any questions
thank you
Ethereum (Cryptocurrency)

Is ETH About to Drop Hard?From my perspective, ETHUSDT is showing clear weakness when combining the latest news with the current price action on the chart.
In the final days of November, the USD strengthened and risk-off sentiment spread across the crypto market , causing liquidity to stall. ETH had no positive catalysts , and multiple reports showed that price continued to remain “stuck” below the 3,000–3,100 USD zone — an environment that leans more toward downside than upside.
On the H4 chart, the 3,100 USD zone has become extremely strong resistance . ETH has been repeatedly rejected at the descending trendline — exactly the same pattern as previous reversals. Buying pressure is very weak , showing the market is not ready for a breakout.
Ichimoku also leans bearish: price is below the cloud , the future cloud is thin and sloping downward , signaling weak bullish momentum. The lower-highs, lower-lows structure further reinforces the downside bias.
If ETH continues to be rejected at 3,100, the highest-probability scenario is a pullback toward 2,950–2,980, before potentially dropping further. A very achievable target is 2,870 USD, which aligns with the support zone shown on the chart. If the market weakens further, the 2,750–2,800 zone may also be retested.

eth taps athgm,
i'll keep this post short and sweet, straight to the point.
eth came down in 3 waves from the recent highs,
we swept the all time highs to catch all the short stops
and we shook out all the bulls after.
we've been consolidating beneath last cycles high for many years now,
and i believe we are getting ready to break out finally.
my upside target is pretty fluid, not attached to any particular number,
more interested in the wave structure itself.
somewhere around 8-10k is fair value,
maybe as high as 20k if we ignite some true momentum.
---
ps. if this post gets 5 likes, i will share my macro bull case on eth.

ETHUSD - MA Support ETHUSD is showing support along the MA line in white on this indicator, I believe it is showing the Monthly chart.
I dont think it will go below this line as it has been seen to support price consistently, instead i think a new ATH will be seen.
Long term chart and a new indicator.

ETH vs BTC- Sometimes when we look at markets, we get confused by all the noise, Trump and governments news, ETFs, FED, bans, SEC, FUD, FOMO, fake stories, and more.
- As a trader, you must always step back from news, view the trend from a distance, and filter out that noise.
--------------------------------------------------------------------------------------------------------
Trading Parts (Monthly TF) :
--------------------------------------------------------------------------------------------------------
- Look at the trend and indicators, that’s what you should focus on first. ETH reached its all-time high in November 2021, and then retested that same ATH level in August 2025.
- Now look at the RSI and MACD levels at that time... In 2021, the RSI was overbought and the MACD crossed downward.
- Alright, now compare with where we are today. The RSI is only halfway to the top (even though ETH has already reached $5K again), and the MACD just crossed upward a few months earlier.
--------------------------------------------------------------------------------------------------------
In my opinion, we’re not topped yet and ETH still low. They will always try to scare you out so they can buy your bags cheaper.
Keep your attention on the opportunities others can’t see.
Happy Tr4Ding !

BTCUSD: death cross signal🛠 Technical Analysis: On the 4-hour timeframe, Bitcoin is trending downward within a descending channel, currently staging a corrective bounce toward the critical resistance zone at 92,640 which aligns with the 100 SMA. A "Global bearish signal" (Death Cross) has formed where the 50 SMA has crossed below the 200 SMA, historically indicating sustained selling pressure. The projected setup anticipates a rejection near the upper trendline and resistance block, aiming for a continuation of the decline toward the major support at 81,775.
🌍 Fundamental Analysis: Trading volume and liquidity are expected to thin out significantly due to the US Thanksgiving holiday (Nov 27), which often creates an environment prone to volatility spikes and "fake-outs." Market participants remain cautious regarding the US Dollar's strength; any continued resilience in the DXY will likely weigh heavily on risk assets like Bitcoin. Furthermore, the absence of immediate bullish catalysts suggests the path of least resistance remains to the downside in the short term.
❗️ Trade Parameters (SELL) ❗️
➡️ Entry Point: Sell on rejection near the resistance zone (approx. 92,500 – 93,000)
🎯 Take Profit: 81,775 (Major Support Zone)
🔴 Stop Loss: Above the descending trendline structure (approx. 96,500)
⚠️ Disclaimer: This is a potential trade idea based on current analysis; market conditions and price direction are subject to change based on news factors and volatility.

ETH — Using Fibonacci for High-Precision TradingUnderstanding Tools, Confluence & Today’s Setup
I’ve been getting a lot of DMs asking what the best indicator is.
The truth? There is no universal “best indicator” because indicators are tools, and every tool serves a different purpose. Trading is like carrying a toolbox: the skill isn’t in having the tools, but in knowing when and how to use them.
Educational Segment: Why Fibonacci Should Be Your Foundation
After years of studying different systems, I’ve come to a very simple conclusion:
👉 Fibonacci tools are the most powerful and reliable in my entire arsenal.
Why?
They help you spot reversal zones with precision
They work across all market conditions
They are rooted in natural ratios that markets consistently gravitate toward
They create predictable targets, retracements, extensions, and even timing when used correctly
Indicators like oscillators etc. are best used as confirmation, not as the primary signal.
If I had to pick one indicator besides Fibonacci, it would absolutely be the VWAP.
Why the Anchored VWAP Is Incredibly Underrated
It shows where true volume-weighted market support + resistance lies
It adapts dynamically
It works extremely well as a dynamic support/resistance line
It is fantastic as a trailing stop-loss tool
It helps identify institutional footprints in price structure
Fibonacci + VWAP is one of the strongest forms of confluence you can build.
ETH Technical Breakdown
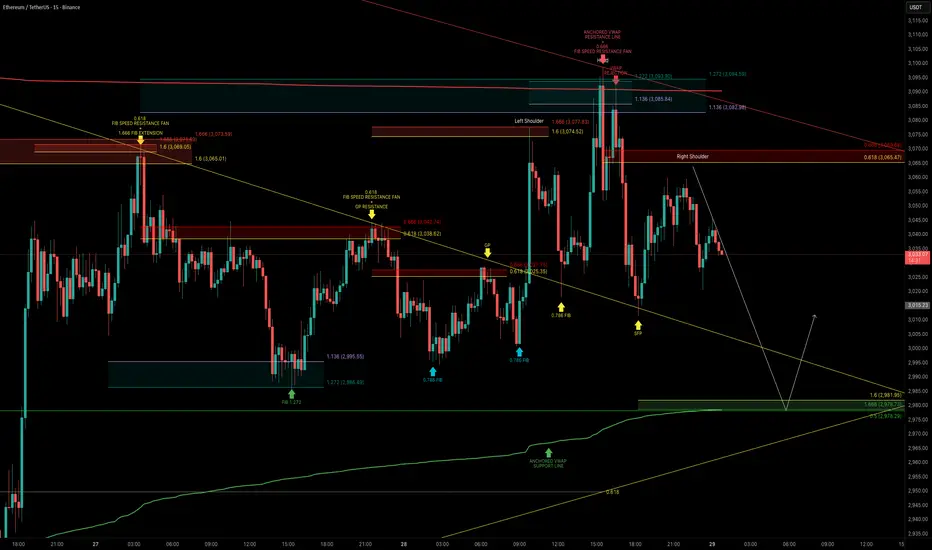
Today, ETH attempted a breakout but the move failed, and the rejection was clean.
ETH rejected at the anchored VWAP aligned with Fibonacci reversal zone:
ETH tested the anchored VWAP near $3,090 twice, coinciding with the 1.136–1.272 Fibonacci Reversal Zone.
This confluence acted as a strong resistance, leading to a swift selloff soon after.
Key Confluence Level Below:
My next major downside target lines up with a cluster of confluences:
1.6-1.666 Fibonacci extension
0.5 Fibonacci retracement
Anchored VWAP (green support line)
Liquidity zone (demand area)
0.618 Fibonacci speed fan support
Educational Takeaway → Confluence Is King
If there’s one lesson to internalize:
The more factors that align at the same level or zone, the higher the probability of a successful trade.
This ETH range has provided several high-quality setups for anyone who understands how to read price through Fibonacci.
Final Notes
ETH remains in a well-defined trading range use confluence, stay patient, and let the market come to your level.
_________________________________
💬 If you found this helpful, drop a like and comment!
ETH Chart doesn't look prettyI see Ethereum’s chart not looking pretty for long nor hold positions at these prices.
Price Action
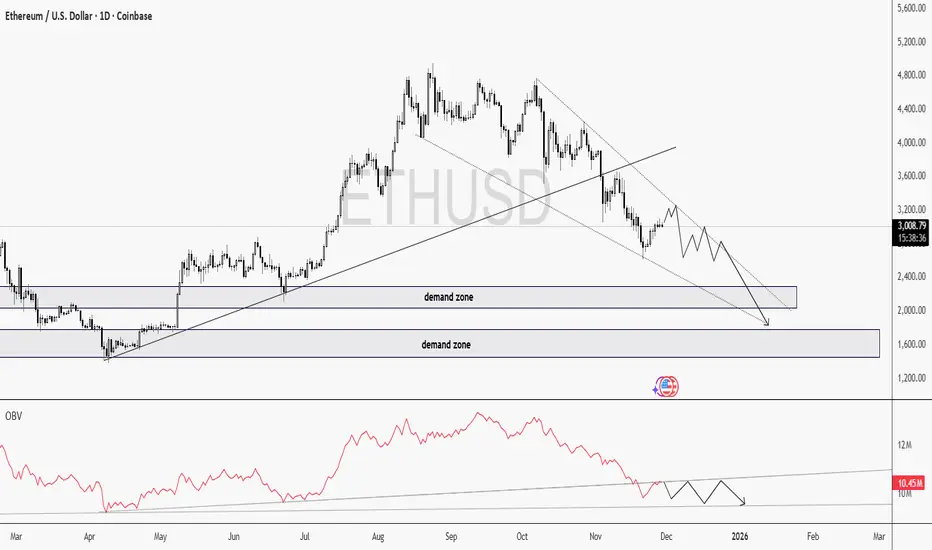
ETH continues to make lower highs and lower lows inside a descending wedge.
Price is moving toward two major demand zones, and the momentum is really weak. Just minor price hiccups.
I'm expecting some choppy or even consolidation movements before a possible test of the lower demand blocks.
OBV is such an underrated indicator!
Look at OBV, this is where the things gets interesting..
OBV is breaking its trendline downward, even while price hasn’t fully broken structure yet.
This is a classic sign of volume distribution. Smart money is exiting positions quietly.
When OBV breaks direction before price, it often predicts the next major move.
At the moment, ETHUSD is looking heavily bearish. Given the fact that BTC is also giving early signs of a bearish trend, I don't think buying ETH is a good idea here. I'll wait for a deeper correction.
Good Luck!

ETH Chart doesn't look prettyI see Ethereum’s chart not looking pretty for long nor hold positions at these prices.
Price Action
ETH continues to make lower highs and lower lows inside a descending wedge.
Price is moving toward two major demand zones, and the momentum is really weak. Just minor price hiccups.
I'm expecting some choppy or even consolidation movements before a possible test of the lower demand blocks.
OBV is such an underrated indicator!
Look at OBV, this is where the things gets interesting..
OBV is breaking its trendline downward, even while price hasn’t fully broken structure yet.
This is a classic sign of volume distribution. Smart money is exiting positions quietly.
When OBV breaks direction before price, it often predicts the next major move.
At the moment, ETHUSD is looking heavily bearish. Given the fact that BTC is also giving early signs of a bearish trend, I don't think buying ETH is a good idea here. I'll wait for a deeper correction.
Good Luck!
ETHUSDT — Bearish Flow Targeting 2,956ETH is still trading below the key intraday resistance at 3032–3045, keeping the bearish structure intact.
As long as price fails to break and hold above this zone, downside pressure is expected to continue.
The current Fibonacci sequence supports a continuation lower, with price showing repeated rejections around the 0.333 / 0.236 levels.
This keeps the market biased toward the next liquidity pocket.
📉 Main bearish target: 2,956
This level aligns with the Fib 1.0 extension, making it the next high-probability destination if bearish momentum persists.
A break above 3045 would invalidate this scenario; otherwise, ETH remains on track toward 2,956.

ETHUSD H4 | Bearish Reaction Off Key ResistanceMomentum: Bearish
Price is currently within the bearish ichimoku cloud.
Sell entry: 3,200.36
- Overlap resistance
- 50% Fib retracement
- 100% Fib projection
Stop Loss: 3,396.32
- Pullback resistance
Take Profit: 2,974.66
- Overlap support
High Risk Investment Warning
Stratos Markets Limited (tradu.com/uk ), Stratos Europe Ltd (tradu.com/eu ):
CFDs are complex instruments and come with a high risk of losing money rapidly due to leverage. 70% of retail investor accounts lose money when trading CFDs with this provider. You should consider whether you understand how CFDs work and whether you can afford to take the high risk of losing your money.
Stratos Global LLC (tradu.com/en ): Losses can exceed deposits.
Please be advised that the information presented on TradingView is provided to Tradu (‘Company’, ‘we’) by a third-party provider (‘TFA Global Pte Ltd’). Please be reminded that you are solely responsible for the trading decisions on your account. Any information and/or content is intended entirely for research, educational and informational purposes only and does not constitute investment or consultation advice or investment strategy. The information is not tailored to the investment needs of any specific person and therefore does not involve a consideration of any of the investment objectives, financial situation or needs of any viewer that may receive it. Past performance is not a reliable indicator of future results. Actual results may differ materially from those anticipated in forward-looking or past performance statements. We assume no liability as to the accuracy or completeness of any of the information and/or content provided herein and the Company cannot be held responsible for any omission, mistake nor for any loss or damage including without limitation to any loss of profit which may arise from reliance on any information supplied by TFA Global Pte Ltd.

ETHUSD oversold bounce back capped at 3,246The ETHUSD pair continues to display a bearish outlook, in line with the prevailing downward trend. Recent price action suggests a corrective pullback, potentially setting up for another move lower if resistance holds.
Key Level: 3,246
This zone, previously a consolidation area, now acts as a significant resistance level.
A failed test and rejection at 3,246 would likely resume the bearish momentum.
Downside targets include:
2,860 – Initial support
2,777 – Intermediate support
2,670 – Longer-term support level
Bullish Scenario (breakout above 3,246):
A confirmed breakout and daily close above 3,246 would invalidate the bearish setup.
In that case, potential upside resistance levels are:
3,350 – First resistance
3,460 – Further upside target
Conclusion
ETHUSD remains under bearish pressure, with the 3,246 level acting as a key inflection point. As long as price remains below this level, the bias favours further downside. Traders should watch for price confirmation around that level to assess the next move.
This communication is for informational purposes only and should not be viewed as any form of recommendation as to a particular course of action or as investment advice. It is not intended as an offer or solicitation for the purchase or sale of any financial instrument or as an official confirmation of any transaction. Opinions, estimates and assumptions expressed herein are made as of the date of this communication and are subject to change without notice. This communication has been prepared based upon information, including market prices, data and other information, believed to be reliable; however, Trade Nation does not warrant its completeness or accuracy. All market prices and market data contained in or attached to this communication are indicative and subject to change without notice.

ETHUSD - Monthly RSI ViewMy view on the Monthly RSI for ETH, expecting another extension upward on the RSI towards the green circle. This creates a huge W pattern and allows another bull run.
Vertical lines show the middle of the previous and current bull run.
Good time to enter into ETHUSD on this Monthly timeframe.

ETHBTC - Flipped from Bearish to BullishETH can be seen to have extreme resistance in the past with this 200MA
However now price has broken above it and is using it now as support on this daily timeframe.
I expect ETH to rally hard with this resistance to support flip.

ETHUSD - Inverted H&S An inverted H&S pattern forming with only the right shoulder yet to complete.
I expect following the right shoulder upward movement to come, not sure how much but it will be there.
Chart pattern analysis on this daily timeframe.
Alt season?

Ethereum OUTCOME!ETH gained strength this week. Waiting to see if it will Break the TrendLine and Cross the Moving Average.

ETH/USD 1D chart review1️⃣ Trend and general context
• ETH is trading after a sharp decline from its local high of ~4,000+.
• The price rebounded from a quite strong support zone around ~2,750–2,800.
• Current price: ~USD 3,034 → the market is testing the first local resistance.
Short-term trend: down, but a rebound and the first signs of reversal are visible.
Long-term trend: still upwards (HL/HH on large intervals).
⸻
2️⃣ Key Levels (from your chart)
🟩 Resistances
• USD 3,475 – key resistance + SMA (blue)
👉 if ETH breaks this level and closes 1D above → strong bullish signal.
• USD 4,061 – major resistance from previous highs.
🟥 Support
• USD 2,757 – the nearest strong support after breaking the trendline.
• USD 2,126 – very key macro support (bottom of consolidation).
⸻
3️⃣ Medium SMA
From your chart:
• Red SMA #1 – price is just above it → first positive signal.
• Blue SMA #5 – Acts as resistance and is currently being tested from below.
• Green SMA #2 – higher, acts as resistance at ~USD 3.475.
➡ The price must return above the blue and green SMA to confirm the return of the upward trend.
⸻
4️⃣ MACD
• The MACD at the bottom of the chart begins to curl upwards.
• The histogram decreases towards zero → the downward momentum weakens.
• Bullish cross is still missing, but it's getting closer.
Conclusion: Early signal of trend reversal, but not confirmed.
⸻
5️⃣ RSI
• RSI is in the zone around 40 → quite low, but not extremely.
• Slight divergence: the price made a lower low, the RSI made a higher one.
👉 This is a bullish signal, but only in combination with a resistance breakout.
⸻
6️⃣ Price Action
You can see:
• A long rising candle after a bounce from below.
• We are approaching the first important resistance at ~3.100–3.150.
To confirm continuation, you need:
✔ Closing of the 1D candle above ~3.150–3.200.
⸻
🎯 What might happen next?
Bull scenario (more likely if BTC also increases)
1. Breakout 3,150–3,200 → retest → move to:
• USD 3,475 (major resistance + SMA)
• then 3,800+
2. MACD makes a bullish cross → momentum is growing.
Probability: ~60%, but confirmation only after the breakout.
⸻
The Bears Scenario
1. Rejection from SMA (blue) and return below 3,000
2. Down to 2,750-2,800 again
3. If this breaks → move towards $2.126
Probability: ~40% at this point.

ETH 4H – Trendline Rejecting, But Does Price Sweep $2,629?ETH tapped into the 0.5–0.786 Fib retracement zone, directly under the macro downtrend line, creating a strong cluster of resistance. Price rejected both the 50 EMA (yellow) and 100 EMA (purple) on the retest, confirming continuation of the 4H downtrend.
The key downside target is the $2,629 liquidity level, where previous wicks, volume clusters, and demand reactions formed. With Stoch RSI fully overbought and rolling over, momentum supports a move lower unless ETH can reclaim the 50/100 EMAs with a strong impulsive candle.
A break above the trendline would invalidate the short-term bearish structure and reopen targets toward $3,140 – $3,260 (0.5 and 0.618 retraces).
Until then, the path of least resistance remains toward liquidity below.

BTC/USDT | Bitcoin Going Towards $94K or Will It Fall From Here?By analyzing the CRYPTOCAP:BTC chart on the daily timeframe, we can see that CRYPTOCAP:BTC followed our previous plan perfectly and after holding above the 81K demand zone it climbed back into the 91K area. The bullish structure remains fully intact and momentum is still on the buyers’ side. As long as BTC stays above the 81K to 85K support range I expect the next upside wave to target 94K first and then 97K and 102K in continuation.
Please support me with your likes and comments to motivate me to share more analysis with you and share your opinion about the possible trend of this chart with me !
Best Regards , Arman Shaban

ETH/USDT | Ethereum Breaks 3000 and Momentum Still Points HigherCRYPTOCAP:ETH pushed all the way to 3000 and the bullish view is still fully intact. From the 2600 rebound to here the move has delivered more than 17 percent already and the structure still supports continuation. As long as ETH holds above the 2500 to 2700 demand zone the upside targets remain 3200, 3500, and 4000 in the next major leg. On the supply side the important zones sit at 3200 to 3300 and then 3500 to 3600 where price may slow down before the next breakout. For now momentum belongs to buyers.
Please support me with your likes and comments to motivate me to share more analysis with you and share your opinion about the possible trend of this chart with me !
Best Regards , Arman Shaban

ETH hit my downside target now what?Wave 1 appears to have completed a leading diagonal with a poke above all-time high- what we expect from wave 1. Wave 2 is underway, testing the weekly 200EMA so far, and an expected reversal point- also the 0.382 Fibonacci retracement.
The retracement has been shallow, but ETH was beaten down and undervalued, making a shallow pullback expected. The 0.5 Fibonacci retracement is the next downside target at the S1 pivot.
🎯 Terminal target for the business cycle could see prices as high as $9000
📈 Weekly RSI was oversold with bearish divergence and has now reset below the channel EQ.
👉 Analysis is invalidated only if we get below the wave (4) bottom $1365
Safe trading

ETHUSD H4 | Bearish Reversal Off Pullback ResistanceMomentum: Bearish
Price is rising toward the sell entry, which sits slightly above the 50% Fibonacci retracement and remains below the Ichimoku Cloud — maintaining a bearish bias.
Sell Entry: 3,208.29
Pullback resistance
Slightly above the 50% Fibonacci retracement
Stop Loss: 3,402.89
Pullback resistance
Aligning with the 50% Fibonacci retracement
Take Profit: 2,786.67
Pullback support
High Risk Investment Warning
Stratos Markets Limited (tradu.com), Stratos Europe Ltd (tradu.com ):
CFDs are complex instruments and come with a high risk of losing money rapidly due to leverage. 70% of retail investor accounts lose money when trading CFDs with this provider. You should consider whether you understand how CFDs work and whether you can afford to take the high risk of losing your money.
Stratos Global LLC (tradu.com): Losses can exceed deposits.
Please be advised that the information presented on TradingView is provided to Tradu (‘Company’, ‘we’) by a third-party provider (‘TFA Global Pte Ltd’). Please be reminded that you are solely responsible for the trading decisions on your account. Any information and/or content is intended entirely for research, educational and informational purposes only and does not constitute investment or consultation advice or investment strategy. The information is not tailored to the investment needs of any specific person and therefore does not involve a consideration of any of the investment objectives, financial situation or needs of any viewer that may receive it. Past performance is not a reliable indicator of future results. Actual results may differ materially from those anticipated in forward-looking or past performance statements. We assume no liability as to the accuracy or completeness of any of the information and/or content provided herein and the Company cannot be held responsible for any omission, mistake nor for any loss or damage including without limitation to any loss of profit which may arise from reliance on any information supplied by TFA Global Pte Ltd.

Bullish bounce?Ethereum (ETH/USD) is falling towards the pivot and could bounce to the 1st resistance, which aligns with the 61.8% Fibonacci retracement.
Pivot: 2,994.49
1st Support: 2,878.88
1st Resistance: 3,233.25
Disclaimer:
The opinions given above constitute general market commentary and do not constitute the opinion or advice of IC Markets or any form of personal or investment advice.
Any opinions, news, research, analyses, prices, other information, or links to third-party sites contained on this website are provided on an "as-is" basis, are intended to be informative only, and are not advice, a recommendation, research, a record of our trading prices, an offer of, or solicitation for, a transaction in any financial instrument and thus should not be treated as such. The information provided does not involve any specific investment objectives, financial situation, or needs of any specific person who may receive it. Please be aware that past performance is not a reliable indicator of future performance and/or results. Past performance or forward-looking scenarios based upon the reasonable beliefs of the third-party provider are not a guarantee of future performance. Actual results may differ materially from those anticipated in forward-looking or past performance statements. IC Markets makes no representation or warranty and assumes no liability as to the accuracy or completeness of the information provided, nor any loss arising from any investment based on a recommendation, forecast, or any information supplied by any third party.
