EthereumETHUSD
- Bullish Channel as an corrective pattern in Short Time Frame
- Break of Structure
- RSI - Divergence
- Order Block
- S / R Level
Ethereum (Cryptocurrency)

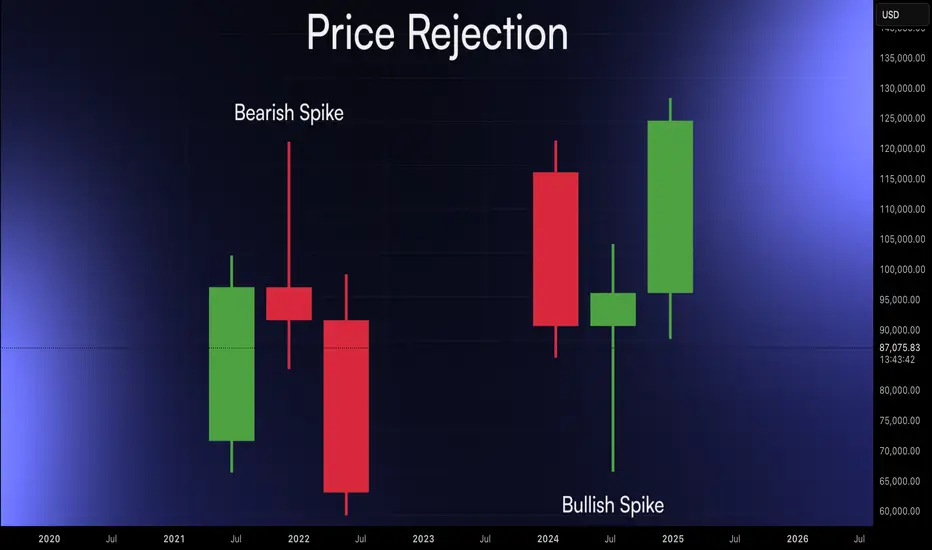
Candlestick Patterns That Actually MatterTraders often approach candlestick patterns by memorizing long lists instead of understanding the behaviour behind them. Crypto moves aggressively, hunts liquidity, and punishes textbook interpretations unless they occur at meaningful locations. The goal is not pattern collection. The goal is to recognize the few formations that consistently reveal intention when aligned with structure, liquidity, and context.
Engulfing Candles, Displacement and Control
What it shows: a clear shift where one side fully absorbs the other. This is participation, not random volatility.
When it matters: after impulses, at support or resistance, during liquidity sweeps, or when confirming a trend shift.
Why it’s valuable: engulfing candles often provide the first structural evidence that control has changed hands.
Rejection Wicks, Liquidity Taken, Pressure Reverses
What it shows: price tapped a high or low, triggered stops, and immediately met stronger opposing orders. This is how sweeps appear on a single candle.
When it matters: at equal highs/lows, session extremes, failed breakouts, and major swing points.
Why it’s valuable: wicks expose trapped traders and reveal where true supply or demand sits. They are early indicators of shifting intent.
Inside and Outside Bars, Compression and Expansion
Inside Bar: compression, tighter ranges, and reduced volatility ahead of expansion.
Outside Bar: immediate expansion where one side overwhelms both directions.
When they matter: at key levels before breakouts, during corrective legs, at consolidation boundaries, and after liquidity events.
Why they’re valuable: inside bars show preparation; outside bars show decision.
Treat these signals as behavioural information. Their value increases when combined with higher timeframe structure, liquidity mapping, momentum, volume, and session context.
Bearish reversal off key resistance?Ethereum (ETH/USD) is rising towards the pivot and could reverse to the 1st support, which has been identified as a pullback support.
Pivot: 3,057.32
1st Support: 2,818.56
1st Resistance: 3,230.74
Disclaimer:
The opinions given above constitute general market commentary and do not constitute the opinion or advice of IC Markets or any form of personal or investment advice.
Any opinions, news, research, analyses, prices, other information, or links to third-party sites contained on this website are provided on an "as-is" basis, are intended to be informative only, and are not advice, a recommendation, research, a record of our trading prices, an offer of, or solicitation for, a transaction in any financial instrument and thus should not be treated as such. The information provided does not involve any specific investment objectives, financial situation, or needs of any specific person who may receive it. Please be aware that past performance is not a reliable indicator of future performance and/or results. Past performance or forward-looking scenarios based upon the reasonable beliefs of the third-party provider are not a guarantee of future performance. Actual results may differ materially from those anticipated in forward-looking or past performance statements. IC Markets makes no representation or warranty and assumes no liability as to the accuracy or completeness of the information provided, nor any loss arising from any investment based on a recommendation, forecast, or any information supplied by any third party.

Ethereum - A -40% crash comes first!🪄Ethereum ( CRYPTO:ETHUSD ) will soon reverse:
🔎Analysis summary:
Over the course of the past couple of months, Ethereum failed to create a new all time high. So eventually, we will see a bearish reversal and a major move lower in the future. The bullish triangle remains valid though, so it will be a major buying opportunity then.
📝Levels to watch:
$2,000 and $4,500
SwingTraderPhil
SwingTrading.Simplified. | Investing.Simplified. | #LONGTERMVISION

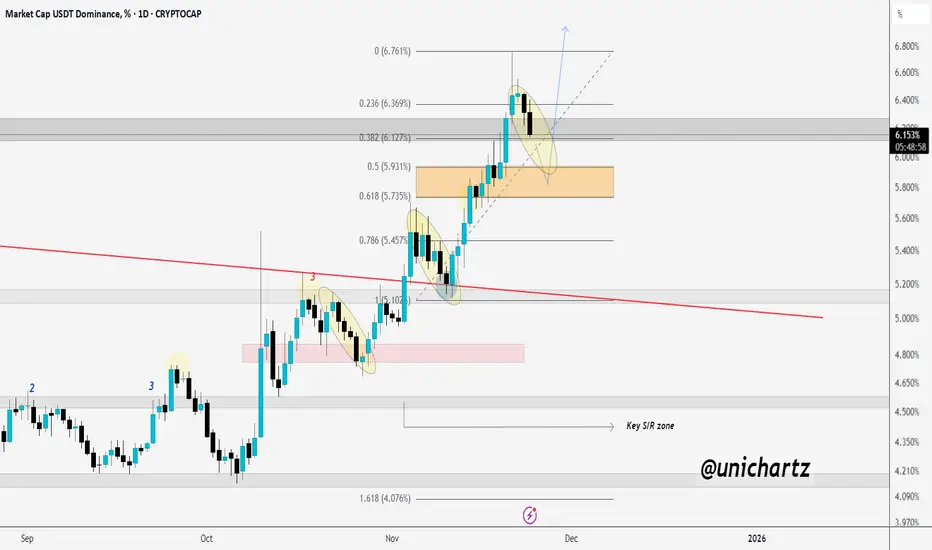
Golden Zone Test: Will USDT.D Extend Higher?USDT.D appears to be retesting the zone after breaking out, and it could push higher since this structure has repeated many times in the past.
The marked golden zone is crucial and will play a key role in determining the next major direction of the market.
DYOR, NFA
ETH downside target hit, bottom soon?Wave 2 is taking the form of a complex WXYXZ correction broadening wedge. Ugly, hard to trade or find any entries. This will cause a lot of stress. This is also potentially a wave 4, but my preferred count is 2 for now.
Wave 2 appears complete with a swing below the boundary at the High Volume Node. Price is below the saily 200EMA. The trend is down, so we should expect more down. Wave X printed a triangle, hinting at this move down being the final move before reversal.
📈 Daily RSI has reached oversold with unconfirmed bullish divergences.
👉 Continued downside has a target of the High Volume Node $2080, where I will be adding.
Safe trading

ETH Approaching Lower Key Zone If Support FailsCRYPTOCAP:ETH is holding the current support zone after a sharp decline, showing its first signs of slowing down. As long as this zone holds, we could see a short-term bounce or consolidation.
But if this support breaks, price may head toward the lower key zone highlighted on the chart.
For now, this support acts as the main level to watch.
DYOR, NFA

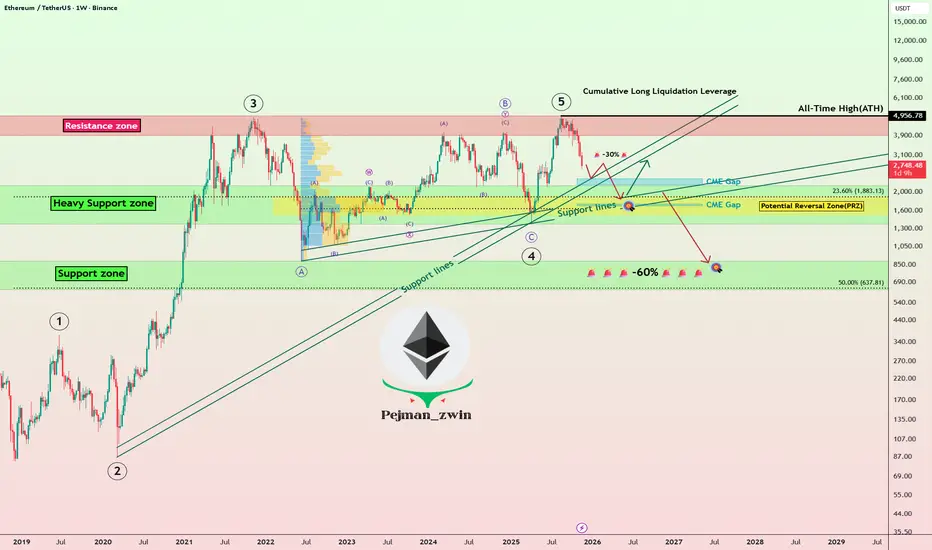
Ethereum Roadmap: Will ETH Bounce or Begin a Deeper Correction!?Today, I’d like to dive into an analysis of Ethereum ( BINANCE:ETHUSDT ). Given that over 80% of tokens in the crypto market are built on the Ethereum blockchain, Ethereum’s performance can serve as a roadmap for other tokens on the network.
So, stay tuned!
In recent times, Ethereum hasn’t been able to keep pace with Bitcoin’s growth and struggled to set a new All-Time High(ATH=$4,956). After Bitcoin’s decline, Ethereum also started to drop and is currently moving near the Heavy Support zone($2,160-$1,370), Support lines, Cumulative Long Liquidation Leverage($1,745-$1,629), and Potential Reversal Zone(PRZ) .
From an Elliott Wave perspective, it seems that Ethereum has completed its main five-wave impulsive. This suggests that we might now be entering a corrective phase. The extent of this correction will depend on multiple factors, and technical analysis alone won’t predict the exact magnitude of Ethereum’s decline in the coming days or weeks. Nonetheless, I’ll keep you updated step-by-step.
Looking at the USDT.D%( CRYPTOCAP:USDT.D ), it’s currently on an upward trend. This rising dominance can lead to further declines in Ethereum, reinforcing the bearish outlook.
Another important index is the US 10-Year Government Bond Yield ( TVC:US10 ). If the US 10-Year Government Bond Yield continues its upward movement, it can put additional pressure on risk assets like Bitcoin( BINANCE:BTCUSDT ) and Ethereum, leading to further declines.
Now, the question is: where might we see Ethereum resume its upward trajectory?
It’s likely that Ethereum will continue its downward movement(-30%), potentially filling the CME Gap($2,344-$2,186), CME Gap($1,745-$1,629) near the $2,000(Round Number). Once it stabilizes around that zone, we could look for signs of a recovery.
However, if Ethereum breaks below its Heavy Support zone($2,160-$1,370), we might face even more significant declines, potentially exceeding -60%.
Where do you think Ethereum will start to rise again? Or are more red days ahead?
💡 Please respect each other's opinions and express agreement or disagreement politely.
📌Ethereum Analyze (ETHUSDT), Weekly time frame.
🛑 Always set a Stop Loss(SL) for every position you open.
✅ This is just my idea; I’d love to see your thoughts too!
🔥 If you find it helpful, please BOOST this post and share it with your friends.
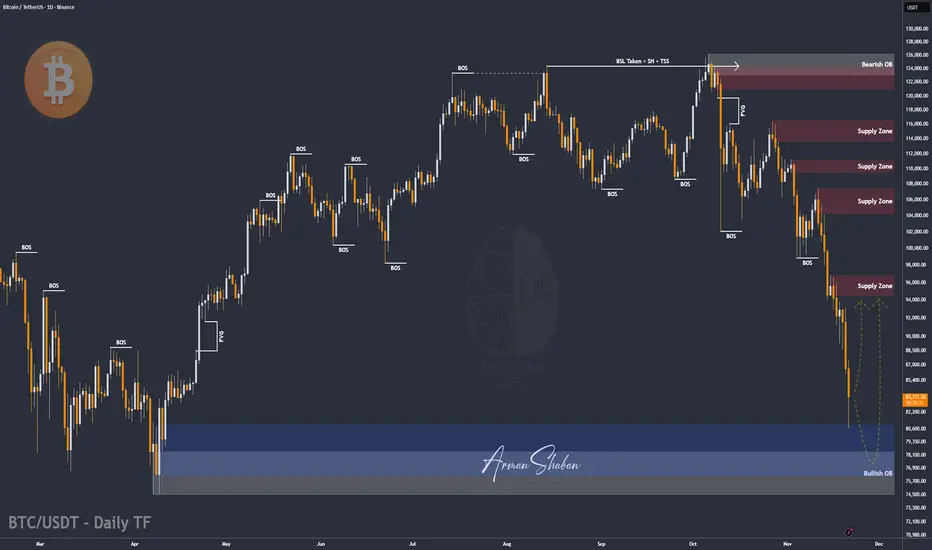
BTC/USDT | Bitcoin Hit Major Demand, What’s Next?By analyzing the #Bitcoin chart on the daily timeframe, we can see that the price dropped exactly as expected and fell sharply to $80,500. Once it reached this major demand zone, buyers stepped in and Bitcoin bounced back to around $83,900.
As long as BTC can hold above the large demand zone between $74,000 and $81,000, we can expect the next bullish wave to start.
From my perspective, the trend is not bearish! this is still a healthy correction.
From the ATH at $126,200, Bitcoin has corrected 36%, which is completely normal in strong uptrends. Now it’s time to watch for decreasing selling pressure and the beginning of a stronger upside move. This analysis will be updated soon.
Please support me with your likes and comments to motivate me to share more analysis with you and share your opinion about the possible trend of this chart with me !
Best Regards , Arman Shaban
Ethereum Builds Strength: Day Trading Blueprint🔥 ETH/USD — Ethereum Day-Trade Breakout Blueprint 🚀 | Bullish Momentum Setup 🔍
📌 Asset: ETH/USD — Ethereum vs U.S. Dollar
📈 Market Type: Crypto | DAY TRADE Blueprint
📖 Trade Plan — Bullish Breakout Structure
ETH is building strong upward momentum with clean higher-lows and tightening price compression. Buyers are stepping in across major crypto pairs, signaling strength in the broader market cycle.
🎯 Entry
Any price-level breakout entry depending on your execution style.
🛑 Stop Loss (Risk Management First)
This is Thief SL → @ 2760
Dear Ladies & Gentlemen (Thief OG’s), adjust your SL based on your OWN strategy and risk.
⚠️ I'm NOT recommending to use ONLY my SL — your money, your rules, your risk tolerance.
🏆 Target
Moving Average is acting as strong resistance + market is entering overbought zones + potential trap formation for late buyers.
Our TP Zone → @ 3000
⚠️ Dear Ladies & Gentlemen (Thief OG’s), TP is your personal choice.
You can take profits the way YOU manage risk.
🔗 Related Pairs to Watch (Correlation Radar)
Watching correlated pairs gives confirmation + early signals of ETH strength or weakness.
1️⃣ BTC/USD (Bitcoin) — King Maker
ETH usually follows BTC’s momentum.
If BTC shows bullish continuation + strong volume → ETH breakout becomes HIGHER probability.
If BTC stalls or rejects → ETH breakouts often fail or become fakeouts.
2️⃣ ETH/BTC — Relative Strength Pair
A rising ETH/BTC = Ethereum outperforming Bitcoin.
A falling ETH/BTC = ETH lagging → Breakouts weaken.
Key Significance: Shows where smart money is rotating.
3️⃣ NASDAQ 100 / US Tech Index ( NASDAQ:NDX / NASDAQ:QQQ )
ETH has high correlation with risk-on tech sentiment.
If US tech rallies → Crypto liquidity flows → ETH bullish pressure increases.
If tech sells off → Crypto often follows.
4️⃣ DXY — U.S. Dollar Index ( TVC:DXY )
Weak USD → Crypto strengthens (inverse correlation).
Strong USD → Crypto cooling or correcting.
Watching DXY helps understand global risk appetite.
5️⃣ SOL/USD, AVAX/USD, MATIC/USD — Layer-1 Competitive Coins
High performance in these alt L1s often triggers rotation flows into ETH.
When these pump together → ETH usually follows with momentum.
📊 Why These Correlations Matter
Crypto → Highly interconnected; no asset moves alone.
BTC controls trend direction.
TradFi indices & USD influence liquidity conditions.
ETH/BTC shows smart-money rotation.
Alt-L1s show risk appetite in the broader ecosystem.
Tracking these pairs = fewer fake breakouts + stronger conviction.

ETHUSDT: Pullback to 2,900 Before the Next DropLooking at the current price action, ETH is showing the classic signs of a weak market : shallow pullbacks, weak buying pressure , and repeated rejections at key resistance zones. Everything suggests ETH is simply taking a short pause before the next leg down.
On the H4 timeframe, price remains firmly inside the descending channel drawn on the chart. Every time ETH touches the upper boundary of the channel, it gets sold off aggressively — a pattern that has repeated consistently. The 2,900 USDT area above now acts as a confluence resistance zone: it aligns with the channel’s upper boundary and a corrective structure — the perfect place for sellers to step in.
At the moment, ETH is making a minor pullback to retest the 2,900 region, but buying momentum is fading and candles are being pushed down repeatedly. This indicates that a bearish reversal is likely forming. Once rejection confirms, the nearest target is the 2,650 support zone. If bearish momentum accelerates, ETH could slide further toward 2,550.
Reference Scenario
Main Trend: Bearish
Strategy: Wait for ETH to retest 2,900 and SELL
Targets: 2,650 – 2,780 → deeper target: 2,550

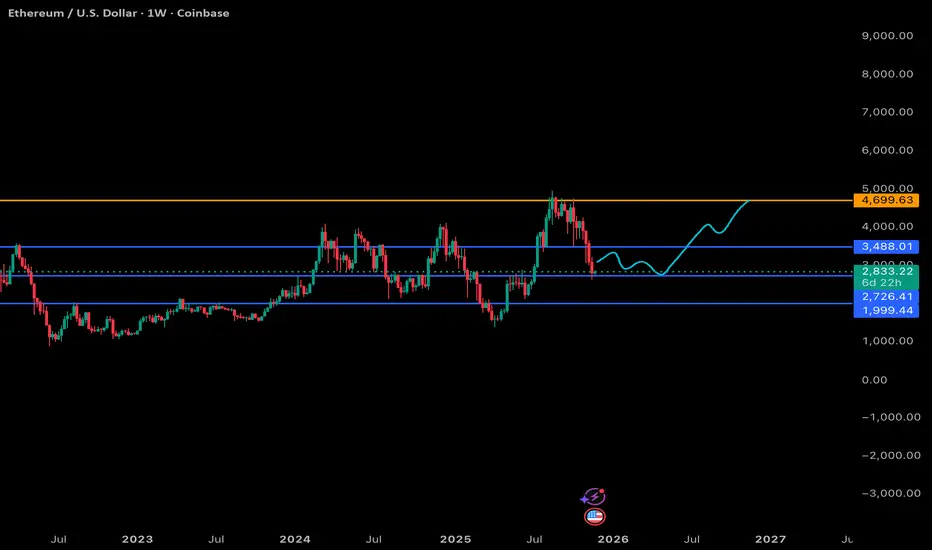
ETH 1W Breakdown: My Levels & What to Expect Next - Nov 23 2025Here’s my current high-timeframe view on Ethereum. Same structure as the BTC chart:
Blue = support, orange = major resistance, and the teal line = where I think price is headed into next year.
Support Levels (Blue)
$3,488: This is the upper support zone. ETH already lost it on the weekly, so I’m treating it as a potential reclaim level later rather than an area to rely on for an immediate bounce.
$2,726: This is the real weekly support I’m watching short-term. Price is sitting just above it, and this level has acted as both resistance and support multiple times across 2024–2025. If ETH is going to stabilize, it’ll probably start here.
$1,999: Deep, cycle-reset support. I’m not calling for this, but it’s absolutely in play if the broader market gets another leg down or BTC drags everything into a deeper correction phase.
Resistance (Orange)
$4,699–$5,000: This is the macro ceiling for ETH. Major weekly resistance from the last cycle’s highs. ETH hasn’t convincingly broken above this since 2021, so this is the level that needs to be taken out to start a real expansion phase.
My Expected Path (Teal)
The teal line is basically my roadmap going into late 2025/2026:
ETH chops around between $2.7K and $3.4K while the market tries to find weekly direction.
Eventually we get a reclaim of that mid-zone, slow, sideways, frustrating price action.
Then a grind back into the $4–4.5K region as momentum rebuilds.
Break above the orange zone later next year, which finally opens the door for a move into price discovery (I’m thinking $6K+ if things really align with the broader cycle).
This mirrors the BTC idea: a mid-cycle reset, sideways accumulation, then the breakout once the market has properly flushed leverage and sentiment has cooled off.
Overall View
ETH looks like it’s in the same boat as BTC right now, not bearish on the macro, just in that annoying “let’s reset everything” phase that tends to drag on longer than most people want. If it plays out like this, I think ETH offers multiple opportunities to accumulate before we get any push toward its all-time-high region.
Slow grind now, bigger moves later.
ETHUSD W1 - Swing PositionETHUSD W1
We might be starting the bullish continuation here in the Crypto space after such an aggressive correction. We have marked on a 618 correction from previous swing low to swing high price.
Swing low price of $1400, to a swing high price of $5000, a huge extension seen from April 2025 through to end of Aug 2025. We have indicated various prices of interest, working out every $500.
Falling just shy of $2500, this may have been the lowest price we expect to. Lets see what this week brings.

The Bitcoin Cycle: A guide to time the next major entryBitcoin could be approaching a cycle low in the next 3-9 months.
Zooming in on the weekly chart, you'll see that price tends to develop a horizontally defined resistance *after* hitting a cycle low and consolidating. Once price breaks out from that resistance, it triggers a buy signal. This is the type of action I want to see to get long with size.
On the topic of cycles, I'll use a paragraph from the first book I read that got me interested in financial markets.
From CYCLES: The Mysterious Forces That Trigger Events
How can one tell, in any given instance, whether or not a
regular rhythm that one discovers is caused by a real underlying
force or merely by chance? Let's begin with some common sense
and simple logic. If a cycle has repeated enough times, with
enough regularity and with enough strength, the chances are that
it is significant. Such regularity cannot reasonably be mere accident.
Bottom line: A cycle's reliability is based on how well it repeated that cycle in the past. I will assume the cycle in this post remains in play, and will use it as my guide to help time the next major entry. The key thing is to enter based on a signal rather than buy just because price is in the cycle low range. The cycle just adds to the weight of evidence and helps with timing - it is NOT the signal.

ARK 3549% from ATH ! what are you waiting for ?Whatsup Guys , i hope you doing well.
Another one for you , keep in mind that nothing what i post on Tradingview is an Financial Advise.
Dont go crazy , Don't go 100x 200x , don't gamble , only invest.
Stay Safe , wash your hands , keep distance and keep investing in your own future
TradingEagle38 //

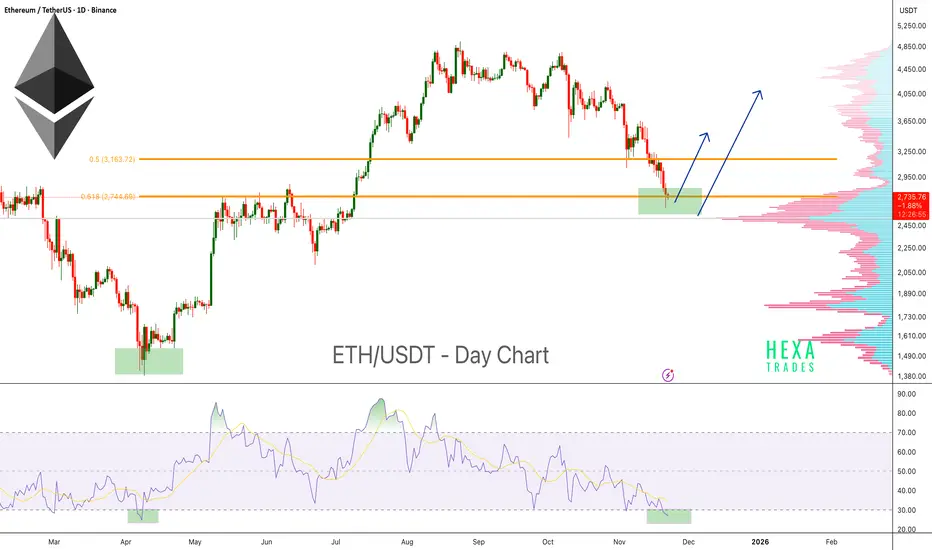
Ethereum Approaching Reversal Zone!Ethereum is currently trading at a major support zone, an area where price has historically shown strong reactions and multiple bounces. This demand zone has acted as a key reversal region several times, and ETH is once again testing it.
Price is also sitting near the 0.618 Fibonacci retracement (Golden Zone), which is commonly used to identify potential reversal points during market corrections.
The Volume Profile shows a high-volume node exactly at the current support area, indicating strong interest and previous accumulation. This increases the probability that this zone will act as a strong support.
On the momentum side, the RSI has entered oversold territory once again. Historically, whenever ETH’s daily RSI dipped below 30, it marked strong bottom areas followed by significant bounces.
Key Highlights
- ETH retesting a major historical support zone.
- Trading inside the 0.618 Fibonacci Golden Zone.
- Daily RSI oversold (<30) — historically a strong bounce region.
- Volume Profile high-volume node aligns with support, increasing the strength of the zone.
- Potential for a short-term reversal if the support continues to hold.
Cheers
Hexa
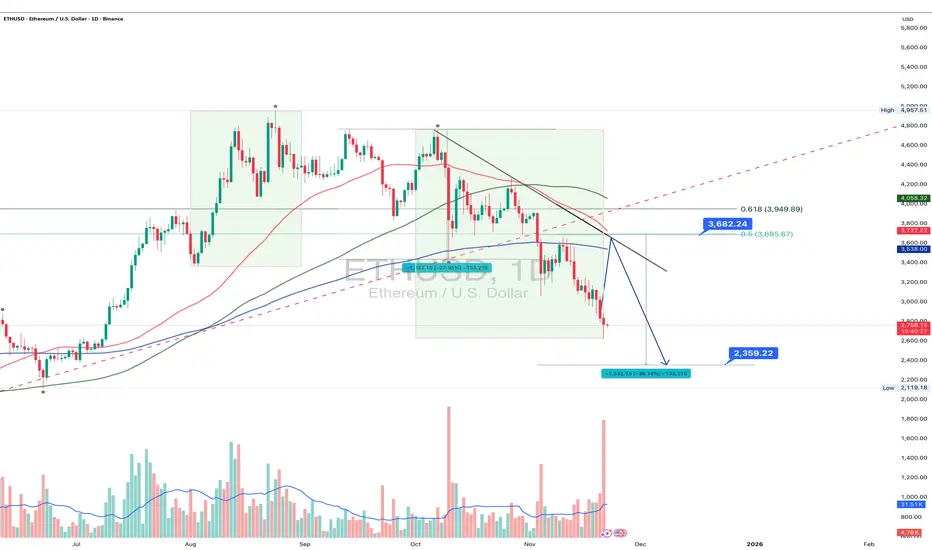
ETH 1D: correction unfolding or just a warm-up?Ethereum continues to trade within a clear bearish structure: after breaking below key daily moving averages, the decline accelerated, pushing the price into the 2720–2800 zone an area that previously acted as a short-term reversal cluster. The trendline from the recent top is broken, and a retest of the 3600–3700 resistance (0.5–0.618 Fib) remains the key scenario before any continuation of the downtrend. Only a confirmed breakout above 3700 would shift the structure back to bullish.
A deeper correction target sits around 2360–2400, where symmetry projections and previous accumulation zones converge.
Fundamental snapshot (Nov 22): network activity is stable, but downward pressure persists due to lower transaction fees and reduced validator revenue. Capital inflows remain weak, and ETH’s dominance continues to erode against L2 networks and alternative L1s. The market is waiting for strong catalysts such as real-world asset tokenization and institutional adoption. In the short term, sentiment leans neutral-to-bearish, supporting the probability of a move toward 2360–2400.
As long as ETH remains below 3600–3700, the bearish scenario holds priority. A breakout above 3700 would flip the structure, but current price action still favors continuation of the correction.
Ethereum is full of surprises - yet price levels tend to be much more disciplined than traders.
ETHUSD : TRADE IDEAAnother short opportunity is on ETH/USD. On the daily timeframe, price has successfully broken below the support level at 3353.41. The recent upward movement appears to be a temporary pullback before continuing its decline toward the 2747.46 level.
Ensure strong confirmation before acting, and keep an eye on shifts in market structure.
Thanks a lot for your support & best of luck
**My trading strategy is not intended to be a signal. It's a process of learning about market structure and sharpening my trading my skills also for my trade journal**

ETH Is Testing the 0.786 Level With DeM at ExhaustionETH is pressing into a major support cluster built from the July 2025 swing low and the readings on the RB DeM indicator are finally reaching exhaustion territory.
The DeM value sitting near 0.18 lines up with the 0.786 retracement of the entire July push which creates a high probability reaction zone.
✓ RB DeM showing deep exhaustion
✓ Price tapping the 0.786 fib from the July 2025 cycle
✓ Structure approaching a level where bigger players usually reload
If buyers defend this zone the next rotation upward could build quickly. I am watching for my RB Swing Setups algo to trigger once momentum shifts.
Full multi timeframe analysis and weekly setups are inside my newsletter.
Link in profile.

Ethereum Slides Deeper as Price Moves Toward 2,750 SupportHello everyone, Ethereum is facing a rather uncomfortable decline after its attempt to recover from the 3,000 USD region failed completely. The price is now hovering around 2,790 USD — the lowest level in over 10 days — and is trading firmly below the Ichimoku cloud, a familiar signal that sellers are still dominating the market.
Observing the price structure on the 4H chart, I see ETH repeatedly leaving red FVGs above, stretching from the 3,000 to 3,200 USD zone. This clearly shows one thing: every recent bounce has been quickly sold off. The market is showing a clear “sell the rally” sentiment, making the short-term downtrend smooth and consistent.
Ethereum is now sliding toward the 2,750 USD zone — a key support area that held price quite well in early November. This is also where liquidity thickens, a region where the market often reacts. But if this level is broken cleanly, the decline could extend toward 2,700–2,650 USD, right at the high-liquidity region and strong support on the D1 timeframe.
News flow also isn’t helping crypto at the moment. The USD is strengthening after September’s jobs report came in far above expectations, raising concerns that the Fed may not cut rates anytime soon. When the dollar becomes more attractive, capital tends to move away from risk assets — and crypto feels the pressure directly. Meanwhile, US equities are recovering strongly thanks to Big Tech and AI stocks, drawing speculative flows away from major coins like ETH.
From my perspective, the highest-probability scenario is that Ethereum continues dropping toward 2,750 USD to test demand. If this area fails to generate a strong enough reaction, price could easily extend lower toward 2,700 USD — a zone where technical buyers may become more active.
What do you think — will Ethereum defend 2,750 USD successfully, or will it need to drop further before recovering?

ETH selling climax!ETH is approaching its final stages of selling. I will watch how price behaves in the marked fib levels.

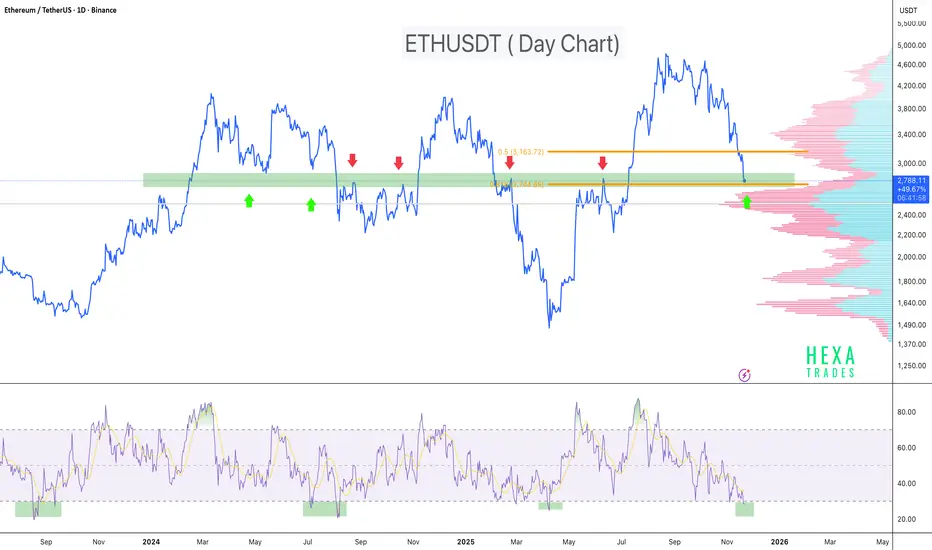
ETH : Oversold RSI + Fib Golden Zone = High-Probability ReversalETH is currently trading inside a major historical support zone, an area where price has repeatedly been rejected and bounced in the past. This level has acted as a strong demand zone multiple times, and the price is once again testing it.
On the momentum side, the RSI has dipped below 30 on the daily chart. Historically, every time ETH’s RSI dropped into the oversold region, it marked a strong bottom formation followed by a notable bounce.
Price is also sitting inside the Fibonacci golden zone, adding further confluence that this area could act as a potential reversal point.
Key Points:
- Strong multi-tested support zone
- Price reacting inside the Fib golden pocket
- Daily RSI oversold (<30) - historically reliable bottom signal for ETH
- High probability bounce zone if the support holds
- This is a critical level to watch for bullish reactions or early reversal signals.
Cheers
Hex
ETHUSDT.P - November 22, 2025Ethereum is trading in a clear short-term downtrend, defined by consistent lower highs and a descending trendline resistance overhead. Momentum remains bearish and, unless price can reclaim the 2,825–2,875 resistance bands, the next support zone to watch sits around 2,625; failure there could see an extension lower toward the 2,525 region.
