ETHUSD 45-Min Chart — Counter-Trend Long From Demand After Major
Chart Analysis:
Market Structure:
Ethereum broke decisively below the 2,855 resistance zone, confirming a bearish structure shift. The move down was impulsive, followed by weak consolidation — classic distribution → continuation behavior.
Support / Demand Zone:
Price is reacting around 2,485–2,520, a highlighted demand area. This zone aligns with the first strong base formed after the sell-off, making it a high-interest reaction level.
Current Price Action:
ETH is printing long lower wicks into support, suggesting seller exhaustion and early dip-buying. However, structure is still bearish until a reclaim occurs.
Entry Logic:
The marked entry near ~2,490–2,510 assumes:
Support holds
A short-term higher low forms
Momentum flips on lower timeframes
Upside Targets:
TP1: ~2,690 (range equilibrium / liquidity grab)
TP2: ~2,740 (previous consolidation + minor resistance)
Final Target: ~2,855 major resistance (breakdown origin)
Invalidation:
A clean breakdown and close below 2,480 invalidates the long bias and opens continuation toward lower liquidity.
Bias Summary:
Trade Type: Counter-trend bounce
Risk Profile: Higher risk, higher R:R
Trend Context: Bearish until 2,855 is reclaimed
Ethereumanalysis

Ethereum (ETH/USDT): Descending Triangle Breakdown ScenarioHI
Ethereum is currently trading within a descending triangle formation, developing after a strong bearish impulse.
Following the sharp sell-off, ETH attempted several recoveries but consistently failed to reclaim higher levels. Price is now compressed between:
A descending internal trendline, acting as dynamic resistance and clearly respected by multiple rejections.
A horizontal support base, forming the lower boundary of the triangle.
This combination reflects a market where sellers remain in control, while buyers are only managing to slow the decline rather than reverse it.
Trade Thesis (Main Idea)
The key setup here is a breakdown of the triangle’s lower boundary:
Trigger: A confirmed break and close below the bottom support of the triangle
Bias: Short position on breakdown confirmation
Target: $2,806, aligned with a high-probability demand zone and prior liquidity
Invalidation: A strong reclaim above the descending trendline would invalidate the bearish continuation scenario

Price Returning to Equilibrium After Fast RallyHello everyone,
On the H4 timeframe, ETHUSDT previously experienced a very sharp and aggressive rally, with little time spent consolidating. Price was pushed almost vertically from the 3,10x area up toward 3,35x–3,40x, stretching far away from the EMA cluster in a short period. This created a strong impulsive move, but with a relatively thin price base underneath.
The issue emerged right at the top. ETH failed to maintain acceptance around the 3,35x–3,40x zone, consolidating only briefly before being clearly rejected. On the chart, this reflects a lack of acceptance — the market was not ready to value ETH at those higher levels, forcing price to rotate back toward areas with greater prior trading activity and liquidity.
Once the pullback began, EMA 34 was the first level to give way, signaling that short-term bullish momentum had ended. Price then continued sliding toward EMA 89, which represents the medium-term equilibrium of the trend. ETH stabilizing around the 3,11x–3,12x region suggests the market is mainly correcting the earlier overextended rally, rather than entering a full breakdown phase.
At this point, the key focus is the price reaction around EMA 89. If ETH can hold this zone and avoid a clear H4 close below it, the most reasonable scenario is a period of consolidation to rebuild structure, before potentially attempting a rebound to retest EMA 34.
Wishing you all a great trading session!

Ethereum Builds Strength: Day Trading Blueprint🔥 ETH/USD — Ethereum Day-Trade Breakout Blueprint 🚀 | Bullish Momentum Setup 🔍
📌 Asset: ETH/USD — Ethereum vs U.S. Dollar
📈 Market Type: Crypto | DAY TRADE Blueprint
📖 Trade Plan — Bullish Breakout Structure
ETH is building strong upward momentum with clean higher-lows and tightening price compression. Buyers are stepping in across major crypto pairs, signaling strength in the broader market cycle.
🎯 Entry
Any price-level breakout entry depending on your execution style.
🛑 Stop Loss (Risk Management First)
This is Thief SL → @ 2760
Dear Ladies & Gentlemen (Thief OG’s), adjust your SL based on your OWN strategy and risk.
⚠️ I'm NOT recommending to use ONLY my SL — your money, your rules, your risk tolerance.
🏆 Target
Moving Average is acting as strong resistance + market is entering overbought zones + potential trap formation for late buyers.
Our TP Zone → @ 3000
⚠️ Dear Ladies & Gentlemen (Thief OG’s), TP is your personal choice.
You can take profits the way YOU manage risk.
🔗 Related Pairs to Watch (Correlation Radar)
Watching correlated pairs gives confirmation + early signals of ETH strength or weakness.
1️⃣ BTC/USD (Bitcoin) — King Maker
ETH usually follows BTC’s momentum.
If BTC shows bullish continuation + strong volume → ETH breakout becomes HIGHER probability.
If BTC stalls or rejects → ETH breakouts often fail or become fakeouts.
2️⃣ ETH/BTC — Relative Strength Pair
A rising ETH/BTC = Ethereum outperforming Bitcoin.
A falling ETH/BTC = ETH lagging → Breakouts weaken.
Key Significance: Shows where smart money is rotating.
3️⃣ NASDAQ 100 / US Tech Index ( NASDAQ:NDX / NASDAQ:QQQ )
ETH has high correlation with risk-on tech sentiment.
If US tech rallies → Crypto liquidity flows → ETH bullish pressure increases.
If tech sells off → Crypto often follows.
4️⃣ DXY — U.S. Dollar Index ( TVC:DXY )
Weak USD → Crypto strengthens (inverse correlation).
Strong USD → Crypto cooling or correcting.
Watching DXY helps understand global risk appetite.
5️⃣ SOL/USD, AVAX/USD, MATIC/USD — Layer-1 Competitive Coins
High performance in these alt L1s often triggers rotation flows into ETH.
When these pump together → ETH usually follows with momentum.
📊 Why These Correlations Matter
Crypto → Highly interconnected; no asset moves alone.
BTC controls trend direction.
TradFi indices & USD influence liquidity conditions.
ETH/BTC shows smart-money rotation.
Alt-L1s show risk appetite in the broader ecosystem.
Tracking these pairs = fewer fake breakouts + stronger conviction.

Ethereum - The bearmarket is not over yet!🪚Ethereum ( CRYPTO:ETHUSD ) can still drop about -30%:
🔎Analysis summary:
Over the past four years, Ethereum has been creating a major bullish triangle. With the recent all time high retest, we are now seeing an expected reversal. But considering the bullish nature of this triangle, Ethereum will head higher after a retest of the next support.
📝Levels to watch:
$2,000
SwingTraderPhil
SwingTrading.Simplified. | Investing.Simplified. | #LONGTERMVISION

Ethereum $ETH weekly demand level at $2,879 is holdingEthereum CRYPTOCAP:ETH weekly demand level at $2,879 is holding as expected for now. There are signs of new bullish impulses in the smaller timeframes. Let's see if ETH cryptocurrency wants to rally higher from this demand level.

ETH: Trying to go long.We both took and captured liquidity. The picture looks good.
The RSI for 1, 2, 3, and 4 hours is in the oversold zone. There is a high chance of a rebound.
Our first goal is to correct the short imbalance at approximately $3,100 and move the stop to break even. If we stand on the short imbalance and go down, the price will most likely go down to the lows again.
Good luck, everyone! Use competent risk management.
BINANCE:ETHUSDT.P

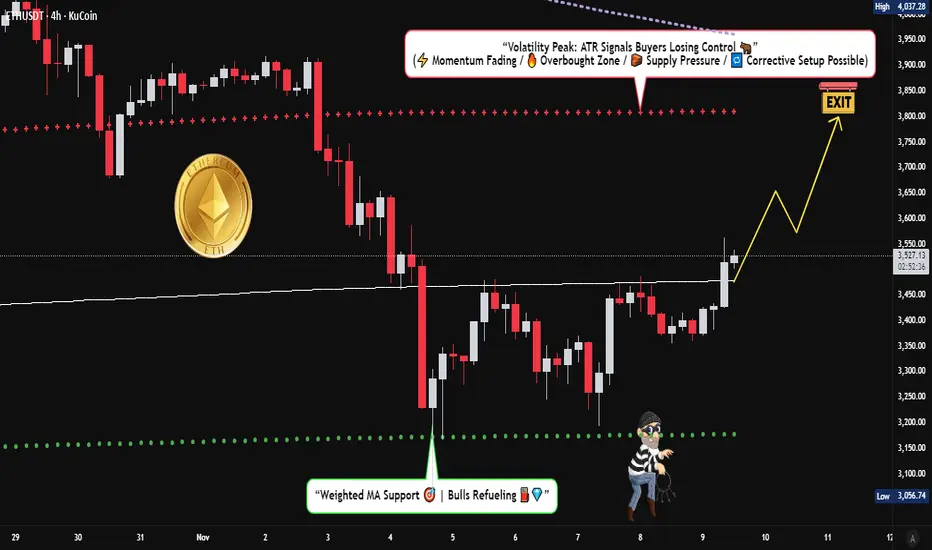
ETH/USDT Outlook – Bullish Bias Strengthens Above Key Support💎 ETHEREUM VS TETHER - Crypto Market Opportunity Blueprint (Swing Trade)
📊 CURRENT MARKET STATUS
Current Price: $3,380 - $3,427 USDT
Market Structure: Bullish consolidation at dynamic resistance
Setup Type: Weighted Moving Average Pullback + Breakout Confirmation
🎯 TRADE PLAN
📍 BIAS: BULLISH ✅
The bullish plan is CONFIRMED following:
✅ Weighted MA pullback completion
✅ Breakout at dynamic resistance line
✅ Price holding above key support zones
🔥 ENTRY STRATEGY - "THIEF LAYERING METHOD"
Entry Type: Multiple Limit Orders (Layer Strategy)
💰 THIEF ENTRY LAYERS:
Layer 1: $3,300 USDT
Layer 2: $3,400 USDT
Layer 3: $3,500 USDT
📌 Note: You can enter at ANY PRICE LEVEL or increase limit layers based on your own risk appetite and capital allocation. The layering strategy allows you to average your entry and reduce risk.
💡 Strategy Benefit: Multiple limit orders help capture price fluctuations and build position gradually instead of all-in at one price.
🛡️ STOP LOSS MANAGEMENT
Thief SL: $3,200 USDT
⚠️ IMPORTANT - Dear Ladies & Gentlemen (Thief OG's):
DO NOT blindly follow my SL level
PLACE YOUR SL AFTER BREAKOUT CONFIRMATION ONLY
Adjust your SL based on YOUR OWN strategy and risk tolerance
This is YOUR money, YOUR risk - trade responsibly
🎯 TAKE PROFIT TARGET
Target Zone: $3,800 USDT
⚠️ Exit Strategy Factors:
📉 Moving Average acting as strong resistance
⚠️ Overbought conditions expected
Potential bull trap zone
💰 Escape with profits at target levels
🔔 CRITICAL - Dear Ladies & Gentlemen (Thief OG's):
This is NOT financial advice
I'm NOT recommending you set ONLY my TP
Take profits at YOUR OWN price targets
Make money, THEN take money at your own risk level
No one knows your financial situation better than YOU
📊 CORRELATED PAIRS TO WATCH
Monitor these pairs for confirmation and correlation analysis:
Major Crypto Pairs 💹:
BINANCE:BTCUSDT - Bitcoin dominance and market leader direction
BINANCE:ETHBTC - Ethereum's strength vs Bitcoin (alt season indicator)
BINANCE:SOLUSDT - Layer-1 competitor correlation
BINANCE:BNBUSDT - Exchange token & ecosystem correlation
DeFi Ecosystem 🔗:
BINANCE:LINKUSDT - Oracle network (DeFi infrastructure)
BINANCE:UNIUSDT - DEX token (Ethereum ecosystem strength)
BINANCE:AAVEUSDT - Lending protocol (DeFi sentiment)
Layer-2s ⚡:
BITTREX:MATICUSDT (Polygon) - L2 scaling solution
BINANCE:ARBUSDT (Arbitrum) - L2 rollup correlation
BINANCE:OPUSDT (Optimism) - L2 ecosystem health
🔍 KEY CORRELATION POINTS
1️⃣ BTC Dominance: If BTC pumps independently, ETH might lag initially
2️⃣ ETH/BTC Ratio: Rising = Alt season favorable / Falling = BTC dominance
3️⃣ L2 Tokens: Strong performance = Ethereum ecosystem bullish
4️⃣ DeFi Tokens: Strength indicates institutional rotation into ETH ecosystem
5️⃣ Gas Prices: Rising on-chain activity supports bullish ETH narrative
⚡ TECHNICAL SETUP SUMMARY
✅ Weighted MA pullback completed
✅ Dynamic resistance breakout confirmed
✅ Support holding at lower levels
✅ Volume confirmation on breakout
⚠️ Watch for overbought RSI at target zone
⚠️ Be cautious of bull traps near MA resistance
🎓 RISK MANAGEMENT REMINDER
💼 Never risk more than 1-3% of portfolio per trade
📊 Position size according to YOUR stop loss distance
🎯 Have clear exit strategy BEFORE entering
💰 Take partial profits at psychological levels
🔄 Trail your stop loss as trade moves in profit
🔔 Like this idea? Drop a 👍 and follow for more setups!
💬 Comment your thoughts and TP levels below!
📊 Share with fellow traders who need to see this!
#ETHUSDT #Ethereum #CryptoTrading #SwingTrade #TechnicalAnalysis #TradingView #CryptoAnalysis #AltSeason #DeFi #Layer1
ETHEREUM Analysis (12H)From the point where we marked the green arrow on the chart, the Ethereum triangle has begun, and at the point where we placed the red arrow, this triangle has completed and the price has entered a bearish phase.
It seems that we are currently in the late stages of wave C of this phase. Just note that this is the 12-hour timeframe, and this phase has not finished yet; its completion requires more time. We expect wave C to finish within the green zone, which is a supportive flip area.
From the green zone, wave C is expected to complete and the price should enter wave D, for which we have marked the targets on the chart.
Let’s see how it will unfold.
For risk management, please don't forget stop loss and capital management
When we reach the first target, save some profit and then change the stop to entry
Comment if you have any questions
Thank You

ETH/USDT Bearish Roadmap: Structure + MA Break AligningAsset: ETH/USDT — “Ethereum vs Tether”
Market Context: Crypto Market | Swing Trade | Bearish Profit Pathway Setup
📉 Market Outlook: Bearish Plan Confirmed
Ethereum is displaying a bearish continuation structure, with price breaking below the Triangular Moving Average zone, signaling shifting momentum from buyers to sellers. Market structure is weakening, liquidity is building above the recent highs, and major supports remain untested below.
This creates a clean swing-trade opportunity for disciplined traders.
🎯 Trade Plan: Thief Layered Entry Strategy
The plan uses a layered sell-limit approach to capture premium retracement entries.
🧩 Sell-Limit Layers (Short Entry Zones):
1st Layer: 3200
2nd Layer: 3100
3rd Layer: 3000
(Traders may add additional layers depending on preference, liquidity, and volatility.)
Layering helps reduce emotional entry pressure and allows scaling into premium short zones rather than rushing into the move.
🛑 Stop-Loss: Structural SL @ 3300
This is the Thief SL reference level at 3300, positioned above structural liquidity.
Ladies & Gentlemen (Thief OG’s): adjust SL according to your own risk tolerance, capital, and strategy framework.
Risk is personal — protect your account.
🏆 Target Zone: 2700
The downside objective aligns with:
Strong support retest
Oversold region confluence
Trap-pattern breakdown
Correlation pressures across major crypto pairs
Ladies & Gentlemen (Thief OG’s): this is a community target reference — take profit based on your own comfort and risk appetite. Profit is profit.
🔍 Related Pairs to Watch (Correlation Insights)
1️⃣ BTC/USDT ( CRYPTOCAP:BTC )
Bitcoin leads crypto directional momentum.
ETH generally mirrors BTC swings with slightly slower volatility.
If BTC struggles to reclaim resistance zones, ETH downside probability strengthens.
2️⃣ ETH/BTC ( BINANCE:ETHBTC )
Key ratio indicating Ethereum’s strength vs Bitcoin.
ETHBTC downtrend continues → ETHUSD bearish continuation becomes more reliable.
3️⃣ SOL/USDT ( CRYPTOCAP:SOL )
Strong competitor in Layer-1 ecosystem.
SOL weakness often reflects broader market appetite decreasing → ETH follows.
4️⃣ TOTAL2 (Altcoin Market Cap)
Tracks overall strength of altcoins excluding BTC.
Breakdown in TOTAL2 = bearish environment = supports ETH downside targets.
Monitoring these pairs provides confirmation of:
Trend alignment
Market-wide weakness
Strength of bearish momentum
Liquidity flows across majors
✅ Final Notes
This setup is built for traders who prefer structured entries, disciplined layers, clear SL zones, and realistic targets.
Trade smart, manage risk, and follow your own strategy refinement.

Ethereum Outlook: Divergence + MA Breakout = Bearish Swing Bias🔍 ETH/USD – “Ethereum vs U.S. Dollar” Market-Capital-Flow Blueprint (Swing Trade) 💼💥
🧭 Overview
Hey Thief Tribe 👋, here’s the game plan for Ethereum (ETH/USD) in the crypto arena!
We’ve spotted a confirmed bearish breakout, with momentum fading on the downside.
This setup blends technical precision with layered stealth entries, built the Thief way 🕶️
Let’s stay sharp, swing smart, and rob those pips — professionally, of course! 😎
⚙️ Plan (Bearish Blueprint)
Two strong confirmations back the downside setup:
🔻 Moving Average Breakout – price sliced below key dynamic support (MA line).
🔻 MACD Divergence – momentum fading with lower highs on MACD.
📉 This combo confirms a short bias, preparing us for controlled, layered entries.
💰 Entry (Thief Style – Layering Strategy Explained)
This isn’t a one-shot entry — it’s a strategic ambush plan 😏
We’ll use multiple sell limit orders, spacing them for precision & flexibility:
🧩 Example Layer Setup:
1️⃣ Sell Limit – $3 900.0 → Top layer, catching early weakness near resistance.
2️⃣ Sell Limit – $3 800.0 → Second layer, adding position as momentum confirms.
3️⃣ Sell Limit – $3 700.0 → Sweet zone: aligns with MA retest area.
4️⃣ Sell Limit – $3 600.0 → Deep layer for confirmation or fake-out retrace.
💡 You can expand or tighten your layers based on volatility or personal risk tolerance.
This “scaling-in method” helps manage risk while improving average entry.
🧨 Stop Loss (Defensive Shield)
🛑 Thief’s SL: $4 000.0 — aligned with the previous Higher-High structure.
🔸 This level invalidates the bearish setup if broken with strong volume.
⚠️ Note to all Thief OG’s:
I’m not recommending you use only my SL — trade smart, adapt your protection.
Your capital, your call, your responsibility. 💼
🎯 Target (Profit Escape Zone)
💎 Target: $3 200.0 — key support confluence zone where:
Moving average = police barricade 🧱
RSI likely hits oversold region 📊
Smart money may reverse from here 🔄
So once price nears that trap-reversal area, it’s time to secure profits & vanish gracefully 🏃♂️💨
⚠️ Note to all Thief OG’s:
You’re free to adjust your take profit. When you see green, take your gain! 💰
🔗 Correlated Pairs & Market Flow Watchlist
Stay alert with cross-checks 👇
🔹 BINANCE:ETHBTC → if ETH weakens vs BTC, bearish setup strengthens.
🔹 BITSTAMP:BTCUSD → if BTC falls too, it amplifies crypto market pressure.
🔹 TOTAL / TOTAL2 (Crypto Market Cap Charts) → confirm capital flow rotation.
📊 Correlations help validate or cancel our bias. Always zoom out before striking.
✨ If you find value in my analysis, a 👍 and 🚀 boost is much appreciated — it helps me share more setups with the community!
#ETHUSD #Ethereum #CryptoSwing #BearSetup #LayeringStrategy #ThiefTrader #LimitOrders #MACDDivergence #MovingAverageBreakout #CryptoFlow #SwingTrading #CryptoMarket

Can ETHUSDT Sustain Momentum After LSMA Breakout?🔥 ETHUSDT BULLISH BLUEPRINT: LSMA Confirmed, Awaiting WMA Breakout for Range Escape! 🚀
Description:
👑 ATTENTION, LADIES & GENTLEMEN – THE THIEF OGs! 👑
Welcome to a clear, actionable blueprint for $ETHUSDT. This isn't just a signal; it's an educational opportunity to understand confluence and manage your own risk like a pro.
📈 THE BIG PICTURE (Market Context):
Ethereum is showing strength within a defined range. A critical LSMA breakout has already confirmed the underlying bullish bias. We are now waiting for the final confirmation to trigger a potential swing move UP.
⚙️ TRADE PLAN (Bullish Confluence):
Direction: Bullish 🐂
Style: Day Trade / Swing Trade
Phase: Range-Bound, awaiting bullish breakout confirmation.
Key Levels: Range resistance is the key hurdle.
🎯 KEY LEVELS & LOGIC:
🟢 TRIGGER ZONE (Entry): $3,200.00
Wait for a decisive candle close ABOVE the Weighted Moving Average (WMA) at this zone.
This WMA breakout is our awaited confirmation to join the LSMA's bullish bias.
"YOU CAN ENTRY AT ANY PRICE LEVEL AFTER THE WMA BREAKOUT" – but the $3,200 zone is optimal for confirmation.
🔴 RISK DEFINITION (Stop Loss): $2,900.00
This is MY "Thief SL" – a level that invalidates the setup.
CRITICAL NOTE: 📢 I am NOT recommending you use only my SL. ADJUST based on YOUR strategy & risk tolerance. Place your SL AFTER the MA breakout confirmation. Protect your capital first!
🟡 PROFIT TARGET (Take Profit): $3,500.00
This target aligns with a historical resistance zone where moving averages may converge.
WARNING: Be aware of potential overbought traps and resistance. "Escape with profits."
CRITICAL NOTE: 📢 I am NOT recommending you use only my TP. Manage your trade actively. "Take money at your own risk." Scale out partials or trail your stop!
💎 THE THIEF OG's GOLDEN RULES:
This is a BLUEPRINT, not financial advice.
YOU are responsible for your own trades, risk, and money management.
Confirmation > Impulse. Wait for the WMA breakout.
Always use a stop-loss. No excuses.
🔍 RELATED PAIRS TO WATCH (Correlation & Key Insights)
Monitoring correlated assets strengthens confirmation and trend accuracy.
Here are the most relevant ETH-linked market movers:
1️⃣ BINANCE:BTCUSDT – Bitcoin vs Tether
Correlation: High
Why it matters:
Bitcoin leads overall crypto sentiment.
ETH breakouts are stronger when BTC breaks key resistance zones.
If BTC rejects from MA levels, ETH often loses momentum too.
What to track:
BTC Daily MA structure
BTC dominance (BTC.D)
Volatility cycles
2️⃣ BINANCE:ETHBTC – Ethereum vs Bitcoin
Correlation: Medium–High (Relative Strength Pair)
Why it matters:
Shows whether ETH is outperforming or lagging against BTC.
A breakout in ETH/BTC gives early confirmation of strong ETH upside.
If ETH/BTC drops, ETHUSDT upside can slow even if USDT charts look bullish.
Key levels:
ETH/BTC horizontal range
MA crossovers
Relative strength slope
3️⃣ BINANCE:SOLUSDT – Solana vs Tether
Correlation: Moderate
Why it matters:
Competes with Ethereum in Layer-1 dominance.
Solana pumps often trigger temporary liquidity rotation away from ETH.
If SOL rallies aggressively, ETH may consolidate longer.
Watch for:
Layer-1 sentiment shifts
Capital rotation between SOL & ETH
4️⃣ BITTREX:MATICUSDT – Polygon vs Tether
Correlation: Medium
Why it matters:
Ethereum Layer-2 ecosystems influence ETH network usage & fees.
MATIC strong moves can signal increased demand for ETH’s ecosystem indirectly.
5️⃣ COINBASE:XTZUSD (or) BINANCE:AVAXUSDT (or) BINANCE:BNBUSDT
Correlation: Low–Moderate
Why it matters:
Any strong L1 competitor rally can pull temporary liquidity from ETH.
Helps judge broader altcoin sector strength.
🧭 KEY CORRELATION SUMMARY
BTCUSDT → Drives crypto trend direction
ETH/BTC → Determines whether ETH has relative strength
SOL, MATIC, BNB, AVAX → Track liquidity rotation
Stronger confirmations = safer ETH entry after WMA breakout

Ethereum - Another -30% correction!🥊Ethereum ( CRYPTO:ETHUSD ) continues the bearmarket:
🔎Analysis summary:
Just over the past couple of weeks, Ethereum has already been correcting about -40%. This happened due to another failed all time high breakout sending prices lower. And Ethereum can drop another -30% before it will then retest a major confluence of support.
📝Levels to watch:
$2,500 and $ 2,000
SwingTraderPhil
SwingTrading.Simplified. | Investing.Simplified. | #LONGTERMVISION

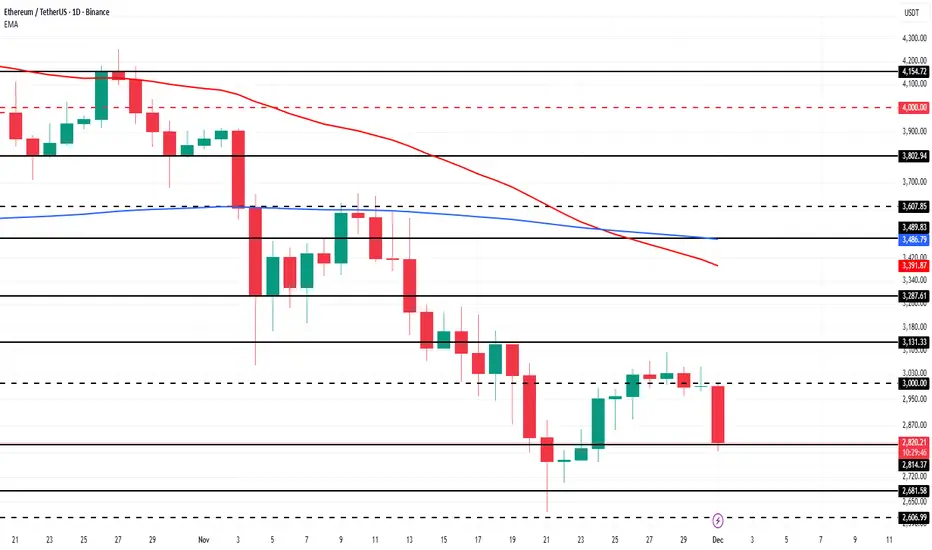
3 Altcoins To Watch In The First Week Of December 2025Ethereum is a key altcoin to monitor this week as it approaches the Fusaka upgrade, scheduled to go live on December 3. This marks its second major upgrade of the year following Pectra and aims to strengthen the network’s long-term scalability.
Fusaka is designed to help Ethereum support high transaction throughput from layer-2 chains by implementing 12 Ethereum Improvement Proposals. The upgrade could lift ETH from its $2,814 support level toward $3,000. Reclaiming that level is essential for a push toward $3,131 and a broader recovery.
If bearish momentum continues and Ethereum reacts negatively to the ongoing Death Cross indicated by its EMAs, ETH may lose support. A fall below $2,814 could send the price toward $2,681, invalidating the bullish thesis and signaling deeper downside risk.
ETHUSD | Short ideaLooking for the next move down on ETHUSD here.
ETHUSD has been trending up for the last few days but I don't think the downtrend is over for now.
Could be right or could be wrong, I would like to hear what you are thinking.
Stay safe out there and do your own due diligence, this is not investment advise!

EthereumETHUSD
- Bullish Channel as an corrective pattern in Short Time Frame
- Break of Structure
- RSI - Divergence
- Order Block
- S / R Level

Ethereum - A -40% crash comes first!🪄Ethereum ( CRYPTO:ETHUSD ) will soon reverse:
🔎Analysis summary:
Over the course of the past couple of months, Ethereum failed to create a new all time high. So eventually, we will see a bearish reversal and a major move lower in the future. The bullish triangle remains valid though, so it will be a major buying opportunity then.
📝Levels to watch:
$2,000 and $4,500
SwingTraderPhil
SwingTrading.Simplified. | Investing.Simplified. | #LONGTERMVISION

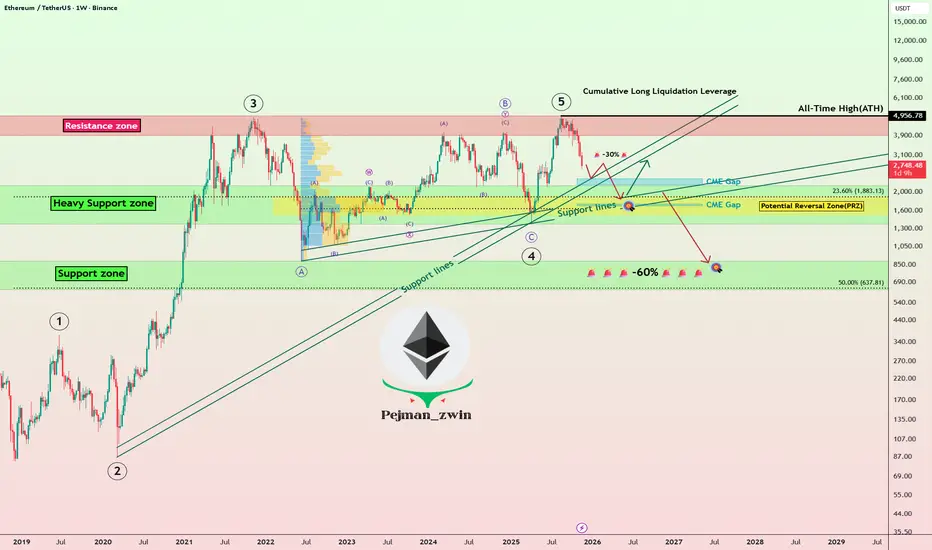
Ethereum Roadmap: Will ETH Bounce or Begin a Deeper Correction!?Today, I’d like to dive into an analysis of Ethereum ( BINANCE:ETHUSDT ). Given that over 80% of tokens in the crypto market are built on the Ethereum blockchain, Ethereum’s performance can serve as a roadmap for other tokens on the network.
So, stay tuned!
In recent times, Ethereum hasn’t been able to keep pace with Bitcoin’s growth and struggled to set a new All-Time High(ATH=$4,956). After Bitcoin’s decline, Ethereum also started to drop and is currently moving near the Heavy Support zone($2,160-$1,370), Support lines, Cumulative Long Liquidation Leverage($1,745-$1,629), and Potential Reversal Zone(PRZ) .
From an Elliott Wave perspective, it seems that Ethereum has completed its main five-wave impulsive. This suggests that we might now be entering a corrective phase. The extent of this correction will depend on multiple factors, and technical analysis alone won’t predict the exact magnitude of Ethereum’s decline in the coming days or weeks. Nonetheless, I’ll keep you updated step-by-step.
Looking at the USDT.D%( CRYPTOCAP:USDT.D ), it’s currently on an upward trend. This rising dominance can lead to further declines in Ethereum, reinforcing the bearish outlook.
Another important index is the US 10-Year Government Bond Yield ( TVC:US10 ). If the US 10-Year Government Bond Yield continues its upward movement, it can put additional pressure on risk assets like Bitcoin( BINANCE:BTCUSDT ) and Ethereum, leading to further declines.
Now, the question is: where might we see Ethereum resume its upward trajectory?
It’s likely that Ethereum will continue its downward movement(-30%), potentially filling the CME Gap($2,344-$2,186), CME Gap($1,745-$1,629) near the $2,000(Round Number). Once it stabilizes around that zone, we could look for signs of a recovery.
However, if Ethereum breaks below its Heavy Support zone($2,160-$1,370), we might face even more significant declines, potentially exceeding -60%.
Where do you think Ethereum will start to rise again? Or are more red days ahead?
💡 Please respect each other's opinions and express agreement or disagreement politely.
📌Ethereum Analyze (ETHUSDT), Weekly time frame.
🛑 Always set a Stop Loss(SL) for every position you open.
✅ This is just my idea; I’d love to see your thoughts too!
🔥 If you find it helpful, please BOOST this post and share it with your friends.
Ethereum Accumulates Below Key ResistanceFenzoFx—Ethereum remains bearish, trading near $3,078.00. Price is below $3,170.00, with a bearish fair value gap overhead and resistance at $3,371.00. Technical indicators show an oversold market with bullish divergence, and candlestick patterns suggest accumulation around this zone.
Despite the bearish setup, a short-term rise may occur to grab liquidity before the downtrend resumes. In this case, Ethereum could target the bearish gap and resistance at $3,371.00.

Ethereum - The realistic $15,000 target!🔥Ethereum ( CRYPTO:ETHUSD ) can still break out:
🔎Analysis summary:
Over the past four years, Ethereum has been trading in a massive bullish triangle pattern. And despite the recent all time high rejection, Ethereum can still follow its underlying bullrun. It just has to create the bullish triangle breakout in the foreseeable future.
📝Levels to watch:
$4,000
SwingTraderPhil
SwingTrading.Simplified. | Investing.Simplified. | #LONGTERMVISION

Ethereum Bulls Defending $3,500 Zone – Time to Rise?Today, I want to walk you through a quick 15-minute timeframe analysis of Ethereum ( BINANCE:ETHUSDT ), so stick around.
Right now, Ethereum is hovering near a Support zone($3,520-$3,348) and a Cumulative Long Liquidation Leverage($3,507-$3,460) .
From an Elliott Wave standpoint, it seems like Ethereum is wrapping up a microwave Y of the main wave 4.
Also, looking at the ETHBTC ( BINANCE:ETHBTC ) chart, Ethereum is in a favorable position there as well, which suggests that if Bitcoin ’s( BINANCE:BTCUSDT ) price increases, Ethereum might see an even stronger upward move.
My expectation is that in the coming hours, Ethereum can resume its bullish trend , push up toward the Resistance lines , and then aim for the next Resistance zone($3,726-$3,649) .
First Target: $3,631
Second Target: $3,665
Third Target: $3,707
Stop Loss(SL): $3,449
CME Gap: $3,513-$3,483
Cumulative Short Liquidation Leverage: $3,715-$3,671
Please respect each other's ideas and express them politely if you agree or disagree.
Ethereum Analyze (ETHUSDT), 15-time frame.
Be sure to follow the updated ideas.
Do not forget to put a Stop loss for your positions (For every position you want to open).
Please follow your strategy and updates; this is just my Idea, and I will gladly see your ideas in this post.
Please do not forget the ✅' like '✅ button 🙏😊 & Share it with your friends; thanks, and Trade safe.

Ethereum Accumulates Near $3,170 SupportFenzoFx—Ethereum is down 0.66% today, trading near $3,540.00 inside the liquidity void from October 10. Immediate support lies at $3,170.00, a level respected for 4 days on the daily chart. This accumulation may signal a potential move higher.
In this scenario, ETH/USD could rise toward $3,836.00 before resuming its downtrend. A break below $3,170.00 would likely trigger a decline toward $2,880.00. The bearish outlook remains valid as long as the daily chart fails to print new higher highs.

ETHEREUM Roadmap (3D)This is a broader outlook on Ethereum in the higher timeframe.
From the point marked as "Start" on the chart, it seems that Ethereum's correction has begun, forming an ABC pattern. Wave B appears to have completed as a symmetrical structure, and we are likely in wave X of B or wave C.
We expect a price rebound from the green zone.
So, keep a close eye on the chart and monitor it carefully.
For risk management, please don't forget stop loss and capital management
When we reach the first target, save some profit and then change the stop to entry
Comment if you have any questions
Thank You
