Ethereum Analysis (2H)In the lower timeframes, after the major dump forming wave A, it seems that wave B has developed as a diametric pattern, with one remaining leg wave g. Wave g is bullish and could target the levels marked on the chart:
targets : 3920$ - 4038$ _ 4142$
The green zone represents the entry area, which is likely to be retested.
For risk management, please don't forget stop loss and capital management
When we reach the first target, save some profit and then change the stop to entry
Comment if you have any questions
Thank You
Ethereumanalysis

EthereumETHUSD
- Bearish Channel as an corrective pattern in Short Time Frame
- Sell Side Liquidity
- Change of Characteristics
- Completed " 1234 " Impulsive Waves
- Order Block

Ethereum $ETH still has weekly demand in control. Will it rally?Ethereum CRYPTOCAP:ETH still has weekly demand in control. Will it rally higher? Waiting for some more bullish price action or a pullback to the weekly demand lower at $2,600.

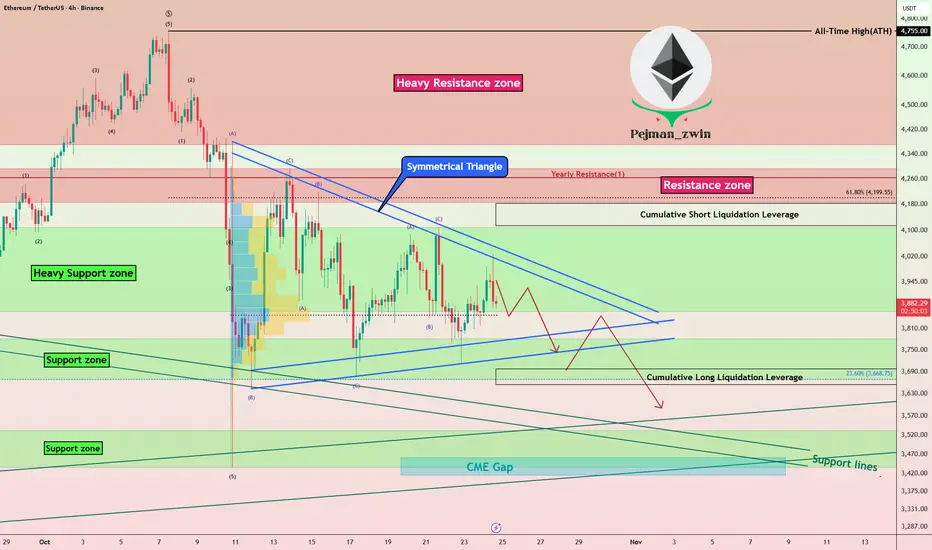
Ethereum in Symmetrical Triangle – Next Big Move Coming?Let’s take a look at Ethereum ( BINANCE:ETHUSDT ) on the 4-hour timeframe . Recently, Ethereum dropped by over -20% during the latest crypto market sell-off but has since started to recover. Right now, it appears to be in a corrective pattern, moving inside a Symmetrical Triangle Pattern .
Currently, Ethereum is testing a Heavy Support zone($4,107-$3,860) , and a break below that zone, confirmed by breaking the lower lines of the symmetrical triangle , could signal further downside.
Note: In general, a Symmetrical Triangle is a continuation pattern, and since the prior trend was downward, we might expect more downside if the broader crypto market continues to decline.
Before concluding, let’s also glance at the ETHBTC ( BINANCE:ETHBTC ) pair on the daily timeframe . It looks like ETHBTC has been in a downtrend and might revisit its support zone once more. That suggests if Bitcoin declines, Ethereum could see even more pressure .
In conclusion, I expect Ethereum to drop at least to its Support lines and Support zone($3,532-$3,436) after breaking the lower lines of the symmetrical triangle. There's also a CME Gap($3,461-$3,417) that might get filled.
Note: Keep in mind that weekend trading volumes are often lower, so the breakdown might not happen immediately. However, if tensions between the US and Venezuela escalate, we could see a sharper reaction even over the weekend.
First Target: $3,764
Second Target: $3,597
Stop Loss(SL): $4,044
Cumulative Short Liquidation Leverage: $4,182-$4,114
Cumulative Long Liquidation Leverage: $3,697-$3,3654
Please respect each other's ideas and express them politely if you agree or disagree.
Ethereum Analyze (ETHUSDT), 4-hour time frame.
Be sure to follow the updated ideas.
Do not forget to put a Stop loss for your positions (For every position you want to open).
Please follow your strategy and updates; this is just my Idea, and I will gladly see your ideas in this post.
Please do not forget the ✅' like '✅ button 🙏😊 & Share it with your friends; thanks, and Trade safe.
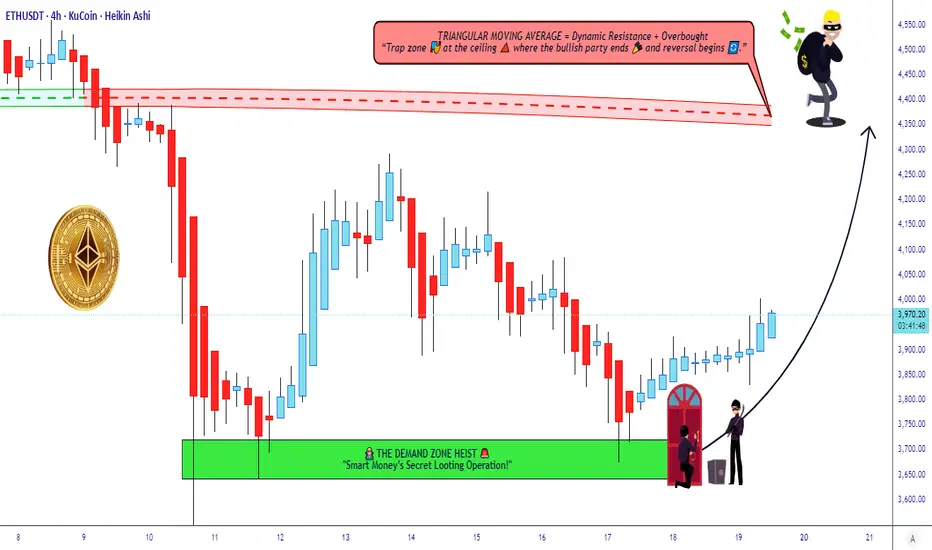
Ethereum Technical Map – Bulls Leading the Charge!🎯 ETH/USDT: The Gentleman Thief's Swing Play | 3600→4350 Target 🚀
📊 MARKET OVERVIEW
Asset: ETHEREUM/TETHER (ETH/USDT)
Timeframe: Swing/Day Trade
Bias: 🐂 BULLISH
Strategy Type: Wealth Accumulation Map
🎭 THE SETUP (A.K.A. "THE HEIST PLAN")
🟢 ENTRY ZONE
Flexible Entry: Any current price level accepted
Translation: We're not picky—grab your ticket to the moon wherever you are!
🛑 STOP LOSS (THE "THIEF'S INSURANCE")
SL: $3,600
⚠️ Important Note for OG Thieves:
Listen up, Ladies & Gentlemen! This is MY stop loss level, not a divine commandment. You've got your own vault to protect—set YOUR stop loss based on YOUR risk appetite. Your money, your rules, your responsibility. Don't blame me if you ignore risk management! 💼
🎯 TAKE PROFIT TARGET
TP: $4,350
📍 Technical Confluence:
Triangular Moving Average acting as strong resistance
Overbought conditions developing
Potential bull trap zone forming
⚠️ Another Friendly Reminder:
Dear OG Thieves, this is MY target—not financial advice carved in stone! Scale out, take profits along the way, or let it ride. YOU decide when to count your loot. Exit strategy is YOUR masterpiece! 🎨
🔍 KEY TECHNICAL LEVELS
Resistance Zones:
Primary: $4,350 (TMA + Overbought)
Watch for rejection wicks at this level
Support Foundation:
$3,600 (Our safety net)
Strategy:
Classic "buy the dip, sell the rip" with proper risk management. We're riding the wave, not fighting the tide! 🌊
👀 RELATED PAIRS TO WATCH
Correlated Assets:
BTC/USDT ( CRYPTOCAP:BTC ) - King leads, ETH follows (usually)
SOL/USDT ( CRYPTOCAP:SOL ) - Alt season companion
MATIC/USDT ( SEED_DONKEYDAN_MARKET_CAP:MATIC ) - Ethereum ecosystem play
BNB/USDT ( CRYPTOCAP:BNB ) - Exchange token correlation
AVAX/USDT ( CRYPTOCAP:AVAX ) - Smart contract platform peer
💡 Correlation Notes:
When BTC pumps, ETH typically follows with stronger percentage moves. Watch Bitcoin dominance—if it drops while BTC rises, expect explosive alt season momentum. SOL and AVAX often move in tandem with ETH as the "Layer 1 trio."
⚙️ RISK MANAGEMENT (THE GENTLEMAN'S CODE)
✅ Never risk more than 1-2% of portfolio per trade
✅ Consider partial profit-taking at resistance levels
✅ Trail your stop loss as price advances
✅ Don't marry your position—take the money and run when it's time! 💰
🎩 FINAL WORDS FROM YOUR FRIENDLY NEIGHBORHOOD CHART THIEF
This analysis combines technical indicators, market structure, and a healthy dose of swagger. Remember: The market doesn't care about your feelings, your bills, or your dreams. Protect your capital like it's the Crown Jewels! 👑
Trade smart, stay humble, and may the pips be ever in your favor! 🎲
✨ If you find value in my analysis, a 👍 and 🚀 boost is much appreciated — it helps me share more setups with the community!
#ETHUSDT #Ethereum #CryptoTrading #SwingTrading #DayTrading #TechnicalAnalysis #CryptoTA #ETHUSD #AltcoinTrading #CryptoStrategy #TradingIdeas #CryptoSignals #BullishSetup #RiskManagement #TradingView #ETH #Cryptocurrency #DigitalAssets #CryptoMarket #TradingCommunity
📈 Chart Analysis | 🎯 Swing Trading | 💎 Crypto Markets | 🚀 To The Moon

Ethereum - The clear $20.000 target!🚀Ethereum ( CRYPTO:ETHUSD ) is breaking out:
🔎Analysis summary:
Despite the recent back and forth, Ethereum clearly remains bullish. We are still able to see the underlying triangle pattern, which Ethereum is attempting to break again. After a successful breakout, Ethereum will immediately start the next potential +350% rally.
📝Levels to watch:
$4,500 and $20,000
SwingTraderPhil
SwingTrading.Simplified. | Investing.Simplified. | #LONGTERMVISION

Volatility Rises as ETH Tests SupportFenzoFx—Ethereum rejected resistance at $4,233.00, aligned with the bearish fair value gap. Friday’s selloff widened the trading range, increasing risk for ETH traders.
The trend remains bearish while price stays below $4,233.0. Critical support lies at $3,825.0. If ETH closes below this level again, the downtrend may escalate toward $3,368.0. Traders should approach cautiously, as the market is in an uncertain phase with potential for volatile price swings.

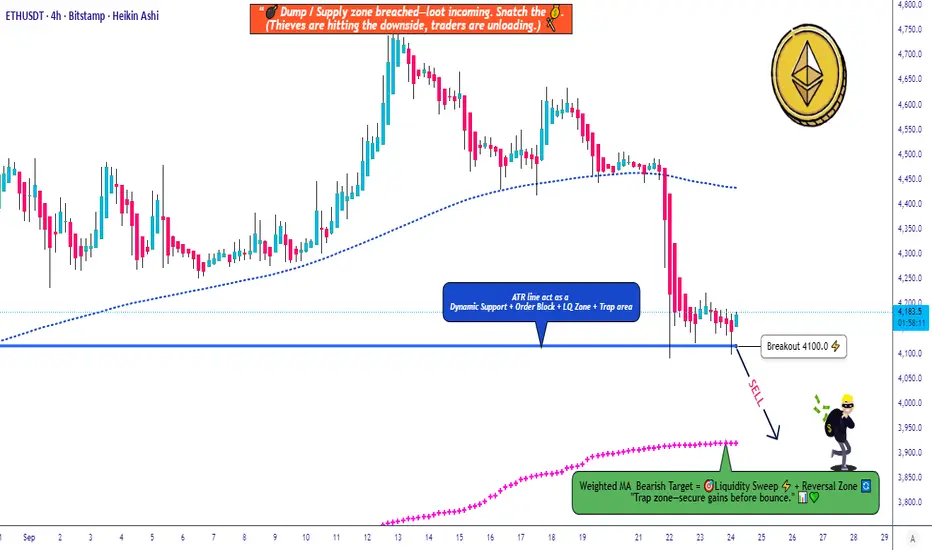
ETH/USDT Drop Plan Layered Entries + Smart EscapeETH/USDT 🚀 Market Wealth Strategy Map (Swing/Day Trade)
Market Outlook:
🔻 Bearish Confirmation: Watch for candle breakouts below the ATR Line @ 4100. This signals sellers gaining control — perfect for short entries.
Entry Plan (Thief Style 🕵️♂️):
💡 Multiple layered entries using limit orders (Thief layering strategy):
Sell layers: 4250 | 4200 | 4150 (adjust layers as per your own preference)
⚠️ Important: Set layer limit orders only after breakout confirmation. Do not enter blindly.
Stop Loss (SL):
⛔ Thief SL: 4300
Note: Dear Ladies & Gentlemen (Thief OG’s), SL is your choice — manage your risk and profits at your own discretion.
Target (TP):
🎯 Target: Weighted Moving Average Line (~3900) — strong support, oversold signals, and trap potential. Escape with profits before market catches you.
Note: TP is also your choice, manage money at your own discretion.
Related Pairs to Watch 🔗:
BINANCE:BTCUSDT : Correlated short setups, watch BTC for confirmation.
BINANCE:ETHBTC : Relative weakness/strength check vs Bitcoin.
BINANCE:BNBUSDT : Can provide additional trend confirmation in altcoin moves.
Key Points / Correlations:
ETH closely follows BTC sentiment; if BTC tanks, ETH likely follows.
Layering strategy allows flexible entries, reducing risk exposure.
Oversold + WMA support often signals profit escape zones for smart exits.
✨ “If you find value in my analysis, a 👍 and 🚀 boost is much appreciated — it helps me share more setups with the community!”
Disclaimer: This is Thief style trading strategy, just for fun.
#ETHUSDT #Ethereum #CryptoTrading #SwingTrade #DayTrade #ThiefStrategy #CryptoAnalysis #CryptoLayering #TradingViewIdeas #CryptoSetup
ETH 1D AnalysisCRYPTOCAP:ETH is at crucial zone. Still supporting long term daily trend line.
Rejection from here can lead to the levels down as shown on the chart.
Stay Cautious.

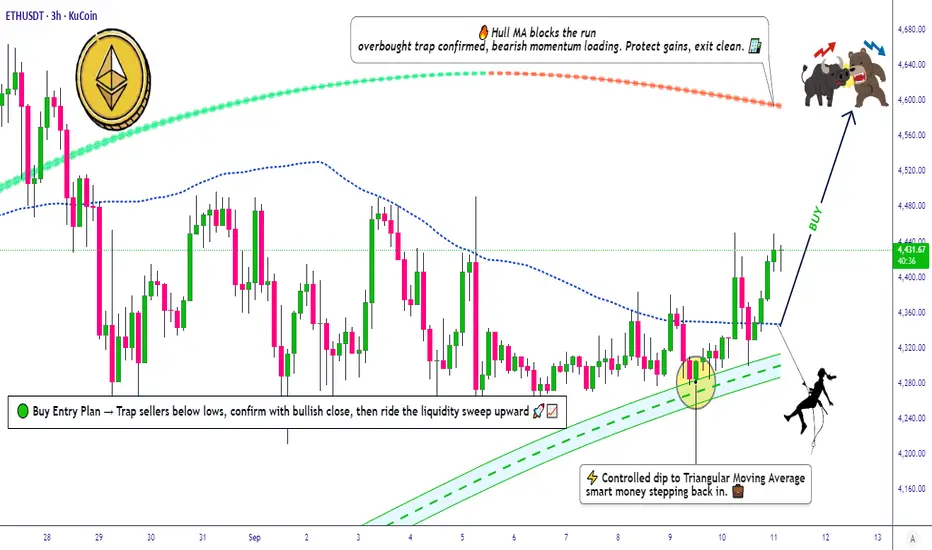
ETH/USDT Technical Roadmap | Bullish Swing & Day Trade Levels📌 ETH/USDT "Ethereum vs Tether" Crypto Market Plan (Swing/Day Trade)
🔹 Plan: Bullish (Pending Order Breakout Plan)
We are preparing for a breakout setup around 10.000⚡ TRIANGULAR MOVING AVERAGE BUY PLAN.
Price action shows strong buyer strength with signs of institutional accumulation on dips.
🛠️ Thief Strategy (Layered Entry Style)
This strategy uses multiple limit orders (layering method) after breakout confirmation.
✅ Example buy limit layers (can be adjusted to your own risk):
4350
4370
4390
4420
👉 Please set a TradingView alert near the breakout level so you don’t miss confirmation.
🛑 Stop Loss (Risk Management)
📍 Suggested risk level: 4300 (after breakout confirmation)
This is the Thief SL reference point, but remember:
Adjust your SL based on your personal risk tolerance & strategy.
🎯 Target (Profit Zone)
Price may face resistance near moving averages with possible overbought traps.
📍 Planned exit zone: 4600
Manage your own TP — use targets that fit your risk/reward ratio.
🔗 Related Pairs to Watch
BINANCE:BTCUSDT – Bitcoin breakout strength often leads ETH moves.
BINANCE:ETHBTC – Key ratio showing ETH’s relative strength vs BTC.
BINANCE:SOLUSDT – High-beta crypto that often correlates with ETH sentiment.
BINANCE:BNBUSDT – Another major altcoin for cross-market momentum comparison.
✨ “If you find value in my analysis, a 👍 and 🚀 boost is much appreciated — it helps me share more setups with the community!”
#ETH #ETHUSDT #Ethereum #Crypto #SwingTrade #DayTrade #BreakoutStrategy #LayeredEntries #CryptoTrading #TradingPlan
ETH/USDT Bearish Continuation from Supply Zonea bearish continuation setup on Ethereum (ETH/USDT) in the 4-hour timeframe. After a strong downward impulse, the price retraced into a highlighted supply zone, suggesting a potential rejection from this resistance area. The projection shows a likely continuation of the downtrend, targeting the 3,797.51 level, with a Stop Loss positioned above the recent swing high around 4,303.62.

ETHUSD Bullish Trend Potential | Break and Retest Trade Plan📹 In this video, we take a closer look at Ethereum (ETH), which has been in a strong bullish trend on the higher time frames 🔥. Recently, ETH has seen a deep pullback, offering potential opportunities if price action confirms a bullish break of market structure on the 30-minute timeframe ⏱️.
💡 I’m watching for a break and retest of the existing range low support, which could signal a continuation of the broader uptrend.
📊 In the video, we cover price action, market structure, trend analysis, and share a trade idea based on these factors 🎯.
⚠️ Disclaimer: This content is for educational purposes only and not financial advice.

Ethereum Pulls Back After Liquidity TapFenzoFx—Ethereum tapped liquidity above the equal highs at $4,233.00 and now trades around $4,190.0, down 0.60% today. Despite the move, the volume profile didn’t form a new high, signaling bearish bias.
Immediate support lies at $4,130.0. A close below this level may trigger further downside toward $4,034.0. If selling pressure continues, ETH could decline to the recent lows at $3,825.0. The bearish outlook remains valid below $4,250.0, which must be breached and held to invalidate it.

Ethereum - The $15.000 price target!🚀Ethereum ( CRYPTO:ETHUSD ) will break out now:
🔎Analysis summary:
Looking at the higher timeframe, it is obvious that Ethereum has been consolidating for the past four years. But now, Ethereum is starting to break above the previous all time high. If Ethereum actually confirms the breakout, we are talking about an expected move of another decent +250%.
📝Levels to watch:
$15.000, $4.000
SwingTraderPhil
SwingTrading.Simplified. | Investing.Simplified. | #LONGTERMVISION

ETH/USD: The Levels Nobody’s Talking AboutETH looks quiet… but the chart is coiling around decision zones.
A) A break of $4,606 clears the path to $5,500.
B) A slip below $3,800 opens the door to $3,669, with a deeper risk toward $2,200.
What most traders miss: it’s not about predicting which level hits first… it’s about understanding what those breaks mean for positioning.
I won’t post a full strategy here, but I’ll say this: the difference between smart money and retail is that smart money prepares before these levels break.
Curious to hear; how are you positioning if ETH chooses either path?

Ethereum at Weekly Supply Zone – Possible Drop AheadHello everybody,
Price is currently at the weekly supply zone.
It has broken an upward trendline and pulled back to retest it.
A decline from this area is expected.
The most likely target is the nearest demand zone, around 3800.
Manage your risk and trade safe!

Ethereum Tests Key Support at $4,535FenzoFx—Ethereum’s downtrend eased after hitting the bullish breaker at $4,425.00. It currently trades near $4,540.00, down 1.00% today. Immediate support lies at $4,535.00. A close below this level could extend the decline toward the equal lows at $4,425.00 and possibly $4,240.00.
The bearish outlook remains unless Ethereum exceeds $4,700.00 and closes above the bearish fair value gap.

$8 Billion ETH Maturing May Push Ethereum Price to New HeightsEthereum is currently trading at $4,495, just below the $4,500 support line. If the decline extends, ETH may slip toward $4,307, but deeper losses appear less likely given the strong investor positioning.
The maturing supply and bullish long-term outlook indicate that Ethereum could soon reverse course. With fewer coins entering circulation, the altcoin has structural support for renewed upward momentum despite short-term volatility.
If Ethereum reclaims $4,500 as support, the path to $4,775 opens. A move past this level would invalidate the bearish thesis, reinforcing confidence that ETH could continue its climb toward new highs

The Fed Meeting and Its Further Play in EthereumCRYPTOCAP:ETH has returned to the trendline. Even if there another short-term drop, thats just part of the futures game - it can't happen without it.
Ahead of the Fed meeting, the market will likely move upward, so that no one can buy cheap after a positive decision on lowering the key rate.
Looking at the recent candles, enough longs have been closed to allow growth without abuse.
Funding across all exchanges has stabilized.
CRYPTOCAP:ETH outflows are starting to exceed inflows.
There nothing to look for down below - everything points to growth.
If it’s not too much trouble, support the post. Wishing you all the best!

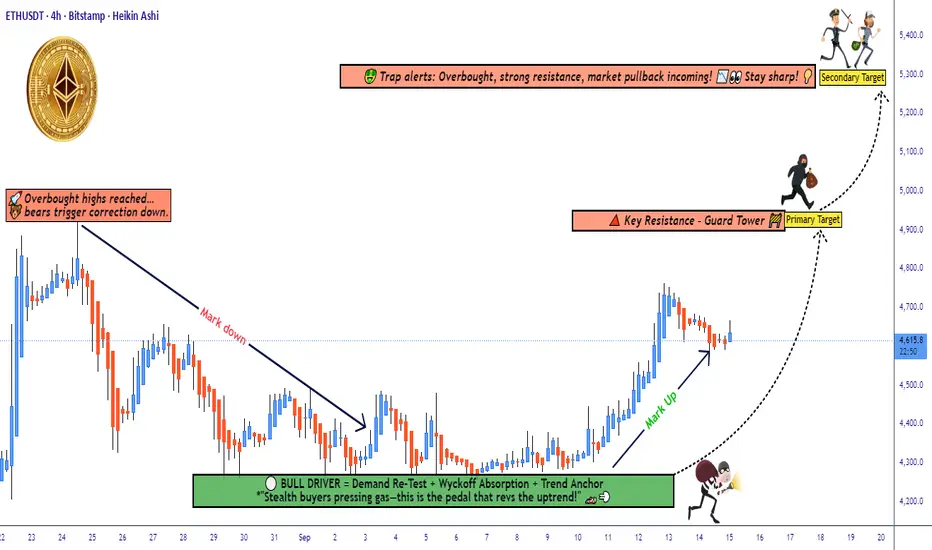
ETH/USDT Technical Outlook: Demand Layer Entries vs Trap Risk🚀 ETH/USDT | Ethereum vs Tether 💎
Crypto Market Money Looting Plan (Swing/Day Trade)
📌 Trade Plan (Bullish Outlook)
Setup: Demand Re-Test ✅ + Wyckoff Absorption 🔑 + Trend Anchor ⚓ (buyers confirmed presence)
Entry Style (Thief Layers 🪙): Using layered limit entries — examples: 4500, 4550, 4600, 4650 (you can add more layers as per your own method).
Stop-Loss (Protect the Vault 🔒): Example zone near 4400 after breakout. Adjust SL to fit your own risk appetite & personal strategy.
Target 🎯:
🎯 Primary: 4900 (local resistance)
🎯 Secondary: 5300 (major resistance / overbought zone)
🧾 Notes for Thief OG’s
This plan is not financial advice, only an idea. Always manage your own entries, SL, and TP.
Think of it as a vault strategy: take money, then protect money.
🔗 Related Pairs to Watch
BINANCE:BTCUSDT → ETH often follows BTC’s momentum. A BTC breakout/false move can affect ETH.
BINANCE:ETHBTC → Good pair to confirm ETH’s relative strength vs BTC.
BINANCE:SOLUSDT & BINANCE:BNBUSDT → Correlated majors; watch for rotation of capital in altcoins.
✨ “If you find value in my analysis, a 👍 and 🚀 boost is much appreciated — it helps me share more setups with the community!”
#ETH #Ethereum #Crypto #USDT #Altcoins #SwingTrade #DayTrading #LayerStrategy #Wyckoff #ThiefPlan #TradingView #CryptoTrading
Ethereum ETH Trade Setup: Resistance, Liquidity, and BoS Idea🟣 Ethereum (ETH) Update (further to my previous idea) 🟣
ETH is currently bullish 🟢📈 and pressing into a key resistance level ⚖️ where we see multiple relative equal highs 📍📍 forming consecutively. This is a major level 🔑.
Here’s what I’m watching:
1: The current pullback may give us a bullish BoS for an entry.
2: If price trades above this resistance 🚀, it will likely trigger buy stops 🎯, providing the liquidity 💧 needed for a potential pullback 🔽.
3: If price then breaks through decisively 💥, I’ll be looking for a retest + hold 🔄, followed by a bullish break of market structure (BOS) 🔓 as confirmation to get long 🟢.
⚠️ This is educational only, not financial advice. 📚

Ethereum ETH at Key Resistance: Equal Highs and Liquidity Play🟣 Ethereum (ETH) Update 🟣
ETH is currently bullish 🟢📈 and pressing into a key resistance level ⚖️ where we see multiple relative equal highs 📍📍 forming consecutively. This is a major level 🔑.
Here’s what I’m watching:
If price trades above this resistance 🚀, it will likely trigger buy stops 🎯, providing the liquidity 💧 needed for a potential pullback 🔽.
If price then breaks through decisively 💥, I’ll be looking for a retest + hold 🔄, followed by a bullish break of market structure (BOS) 🔓 as confirmation to get long 🟢.
⚠️ This is educational only, not financial advice. 📚
