Ethereum Accumulation and Bullish SetupEthereum is currently trading sideways, indicating an accumulation phase. On Monday, price swept equal lows and formed a long-wick bullish candlestick. The 4-hour chart shows two engulfing candles that cleared liquidity on both sides.
Technically, the market remains bullish and is consolidating. If momentum continues, ETH/USD may target the equal highs near $4,500. A confirmed close above the immediate support at $4,384 would validate this bullish outlook.
Ethereumanalysis

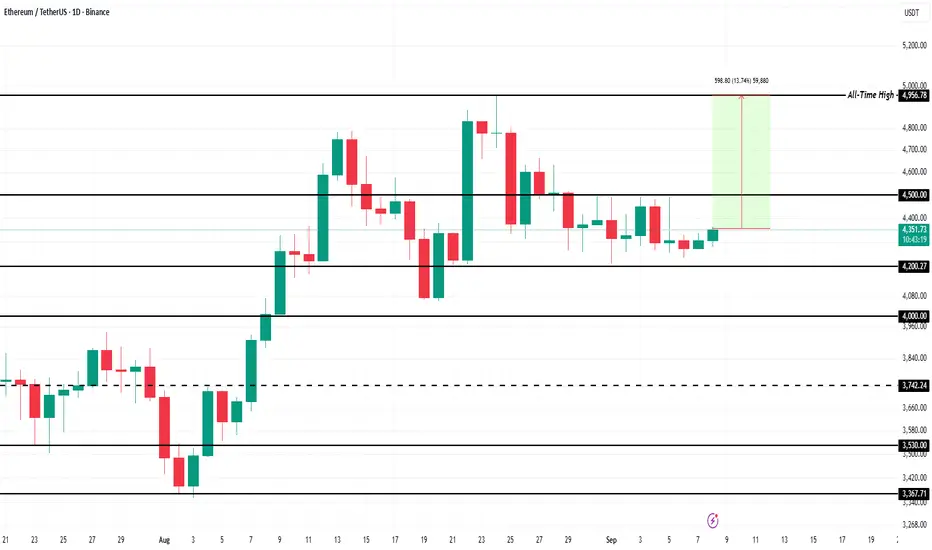
Ethereum Could Hit All-Time High in The First Week Of SeptemberEthereum’s price is currently at $4,315, showing limited movement after days of stagnation. The altcoin king continues to hover around the $4,331 support level, attempting to secure it as a foundation for a potential upward breakout in the near term.
The Chaikin Money Flow (CMF) indicates rising inflows, a positive signal for Ethereum’s momentum. If the indicator crosses above the zero line, it will confirm stronger inflows. This could push ETH past $4,331 and toward $4,500, reducing the gap to its $4,956 all-time high.
However, risks remain if investor sentiment weakens. Should selling pressure increase, Ethereum could struggle to maintain upward momentum. In this scenario, ETH might either consolidate sideways above $4,222 or fall through it, retesting $4,007 as support and invalidating the bullish thesis for the short term.
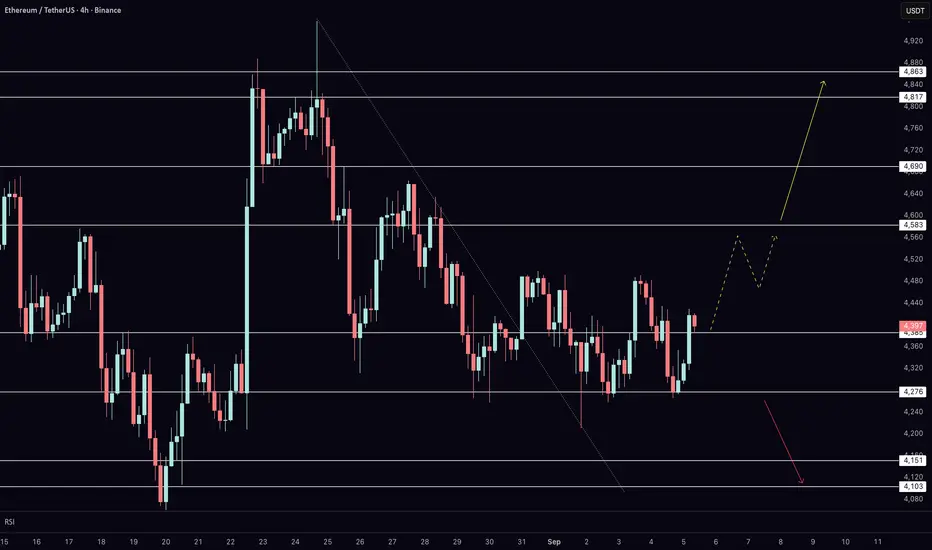
Key Levels to Watch on Ethereum Today After NFP & Bitcoin RallyEthereum is trading right at key resistance on the 4-hour chart, and today’s price action could set the tone for the next major move. After defending support at $4,276, ETH has bounced back into the $4,383 level, where buyers and sellers are now battling for control. In this video, I break down the short-term roadmap, explain the critical support and resistance levels, and outline the scenarios that could unfold depending on today’s reaction.
With the U.S. NFP release adding volatility across markets and Bitcoin showing fresh bullish momentum, Ethereum is at a decisive moment. A confirmed breakout above resistance would open the path toward $4,582, $4,689, and $4,862, while failure to hold support shifts focus back to $4,148 and $4,103. Watch closely — the coming sessions are likely to provide clarity on whether ETH is ready to extend higher.
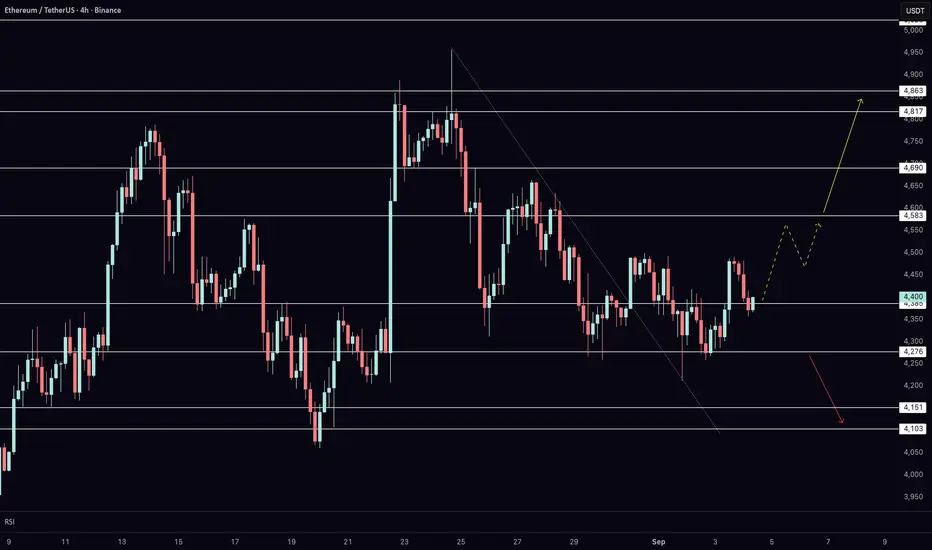
Ethereum at $4,382 – Upside or Another Retest of $4,276?My main bias remains more upside. On the 4-hour chart, Ethereum is defending $4,280 support and testing $4,380 resistance. A break and hold above $4,380 opens the path toward $4,580, $4,690, and $4,860. Failure to hold $4,280 would shift focus to $4,150 and $4,100.
Do you also want me to round the prices in the full transcript I wrote earlier, so it matches this simplified style?
Ethereum Whales Scoop Up 260K ETH, Fueling $5K Recovery Hopes
The cryptocurrency market is witnessing a significant shift as Ethereum whales accumulate massive positions, with recent data showing an unprecedented 260,000 ETH purchased in just 24 hours. This substantial whale activity is generating considerable optimism among investors and analysts, who are now eyeing a potential recovery toward the psychologically important $5,000 price level.
Massive Whale Accumulation Signals Market Confidence
Large-scale Ethereum holders, commonly referred to as "whales" in the cryptocurrency community, have demonstrated remarkable confidence in ETH's future prospects through their recent buying behavior. The acquisition of 260,000 ETH in a single day represents approximately $650 million worth of Ethereum at current market prices, indicating that institutional and high-net-worth investors are positioning themselves for what they perceive as an imminent price rally.
This whale accumulation pattern is particularly significant given the broader market context. While many retail investors remain cautious following recent market volatility, sophisticated investors with substantial capital reserves are taking advantage of current price levels to build sizeable positions. The concentrated nature of these purchases suggests coordinated confidence among major market participants rather than isolated buying decisions.
The timing of this accumulation is noteworthy as well. Ethereum has been trading in a consolidation phase following its previous rally, and whale activity often serves as a leading indicator of upcoming price movements. Historical data shows that significant whale accumulation periods frequently precede major price breakouts, lending credence to the bullish sentiment surrounding ETH's near-term prospects.
Bitcoin Profit Rotation Driving Ethereum Demand
A particularly interesting aspect of the current market dynamics is the apparent rotation of capital from Bitcoin into Ethereum. As Bitcoin approaches resistance levels and shows signs of consolidation, savvy investors are taking profits from their BTC positions and reallocating these funds into ETH. This rotation strategy reflects a sophisticated understanding of market cycles and the relative value proposition between the two leading cryptocurrencies.
Bitcoin's recent performance has been strong, but many analysts believe that Ethereum may offer superior upside potential in the coming months. The rotation from BTC to ETH is not merely a short-term trading strategy but reflects fundamental beliefs about Ethereum's technological advantages and ecosystem growth potential. This capital rotation is providing additional buying pressure for ETH while simultaneously reducing selling pressure from profit-taking activities.
The scale of this rotation is substantial enough to impact market dynamics significantly. When large holders move capital between cryptocurrencies, it often creates momentum that smaller investors follow, potentially amplifying the initial movement. This phenomenon could be contributing to the sustained buying pressure we're observing in Ethereum markets.
Technical Analysis Points to $5K Target
From a technical analysis perspective, the current whale accumulation is occurring at what many chartists consider optimal entry levels. Ethereum's price action has formed what appears to be a strong support base, and the addition of substantial whale buying is providing the foundation for a potential breakout to higher levels.
The $5,000 price target that has emerged in analyst discussions is not arbitrary. This level represents a significant technical milestone that would place Ethereum at new all-time highs, surpassing its previous peak reached during the 2021 bull market. Achieving this target would require approximately a 50-60% rally from current levels, which, while substantial, is not unprecedented for Ethereum during strong market phases.
Several technical indicators are aligning to support this bullish thesis. The accumulation by whales is reducing the available supply on exchanges, creating conditions for price appreciation when demand increases. Additionally, on-chain metrics show declining ETH reserves on major exchanges, suggesting that holders are moving their assets to cold storage with long-term holding intentions.
Fundamental Drivers Supporting Price Recovery
Beyond technical factors, several fundamental developments are supporting the case for Ethereum's price recovery. The network's transition to proof-of-stake consensus has fundamentally altered ETH's economic model, introducing deflationary mechanisms that reduce supply over time. This structural change creates long-term upward pressure on prices, particularly when combined with sustained demand.
The growth of decentralized finance (DeFi) continues to drive demand for ETH as the primary collateral and gas token for the Ethereum ecosystem. Recent developments, including major DeFi protocols expanding their offerings and new innovations in yield generation, are attracting both institutional and retail capital to the Ethereum network. This increased activity translates directly into increased demand for ETH.
Layer 2 scaling solutions are also contributing to Ethereum's value proposition by making the network more accessible and cost-effective for users. While some initially worried that Layer 2 solutions might reduce demand for mainnet ETH, the opposite has proven true. These scaling solutions are enabling new use cases and bringing more users to the Ethereum ecosystem, ultimately increasing overall network value and ETH demand.
Institutional Adoption Accelerating
The whale accumulation we're observing is likely driven, at least in part, by increasing institutional adoption of Ethereum. Major corporations, investment funds, and financial institutions are recognizing Ethereum's potential as both a store of value and a platform for innovation. This institutional interest is providing a stable foundation of demand that supports higher price levels.
Recent regulatory clarity in various jurisdictions has made it easier for institutions to hold and trade Ethereum. The approval of Ethereum ETFs in multiple markets has provided traditional investors with regulated exposure to ETH, broading the potential investor base significantly. This institutional infrastructure is creating new channels for capital to flow into Ethereum, supporting the whale accumulation trend.
The institutional adoption story extends beyond simple investment holdings. Many institutions are building applications and services on Ethereum, creating operational demand for ETH that goes beyond speculative investment. This utility-driven demand provides a more stable foundation for price appreciation than speculation alone.
Market Sentiment and Risk Factors
While the whale accumulation and associated price targets are generating significant optimism, it's important to consider potential risk factors that could impact Ethereum's trajectory. Macroeconomic conditions continue to influence cryptocurrency markets, and changes in monetary policy or economic outlook could affect investor appetite for risk assets like ETH.
Regulatory developments remain a key consideration for Ethereum's future. While recent regulatory clarity has been generally positive, ongoing discussions about cryptocurrency regulation in major markets could introduce volatility. However, Ethereum's established position and broad ecosystem make it less vulnerable to regulatory challenges than smaller, less established cryptocurrencies.
Competition from other blockchain platforms also represents a consideration, though Ethereum's first-mover advantage and network effects provide substantial competitive moats. The ongoing development of Ethereum 2.0 and associated scaling solutions are addressing many of the performance concerns that competitors have attempted to exploit.
Looking Ahead: October Catalyst Potential
Many analysts are pointing to October as a potential catalyst month for Ethereum's price recovery. This timing aligns with historical patterns showing that the fourth quarter often brings increased cryptocurrency market activity. The combination of whale accumulation, institutional adoption, and seasonal patterns could create a perfect storm for price appreciation.
The prediction of a potential "bear trap" in September, where prices might temporarily decline to the mid-$3,000 range before surging in October, reflects sophisticated market timing strategies. Such scenarios often catch retail traders off-guard while providing additional accumulation opportunities for sophisticated investors who understand market cycles.
Conclusion
The recent whale accumulation of 260,000 ETH represents a significant vote of confidence in Ethereum's future prospects. Combined with capital rotation from Bitcoin, technical breakout potential, and strong fundamental drivers, conditions appear favorable for a substantial price recovery toward the $5,000 target level.
While short-term volatility remains possible, the sustained whale buying suggests that sophisticated investors are positioning for longer-term appreciation. The combination of reduced supply through staking and burning mechanisms, increased institutional adoption, and ongoing ecosystem development creates a compelling investment thesis for Ethereum.
Investors should remain aware of potential risks and market volatility, but the current accumulation pattern by whales provides strong evidence that major market participants expect significant appreciation in Ethereum's value. As the cryptocurrency market continues to mature and institutional adoption accelerates, Ethereum appears well-positioned to benefit from these broader trends, potentially making the $5,000 price target achievable in the coming months.
The convergence of technical, fundamental, and sentiment factors creates an unusually positive outlook for Ethereum. While past performance doesn't guarantee future results, the current whale accumulation pattern mirrors successful accumulation phases that have preceded major rallies in Ethereum's history, suggesting that similar outcomes may be possible in the current market cycle.

Ethereum Eyes Resistance Amid Bearish OutlookFenzoFx—Ethereum is consolidating after forming a triple bottom at equal lows of $4,207.0. It recently tapped the mean threshold of the inverted fair value gap near $4,400.0. Momentum picked up after ETH swept liquidity below $4,257.0, suggesting a potential move toward equal highs at $4,516.0.
However, this uptick doesn’t signal a market structure shift. The broader outlook remains bearish until Ethereum revisits the equal lows at $4,207.0, where significant stop orders have accumulated, especially since Monday.

Ethereum Analysis (4H)It seems the price is not yet ready for a strong rejection to the downside, and buyers still hold strength. It is expected that, with the interaction or liquidity hunt that previously triggered a strong upward move, we may see another bullish wave. This move would both reinforce a bullish sentiment in the market and allow major players’ orders to be filled.
For a rejection to occur, it will either happen from the premium zone of the previous wave, or a new all-time high might form.
Let’s see how the market reacts to the highlighted red zone.
For risk management, please don't forget stop loss and capital management
When we reach the first target, save some profit and then change the stop to entry
Comment if you have any questions
Thank You

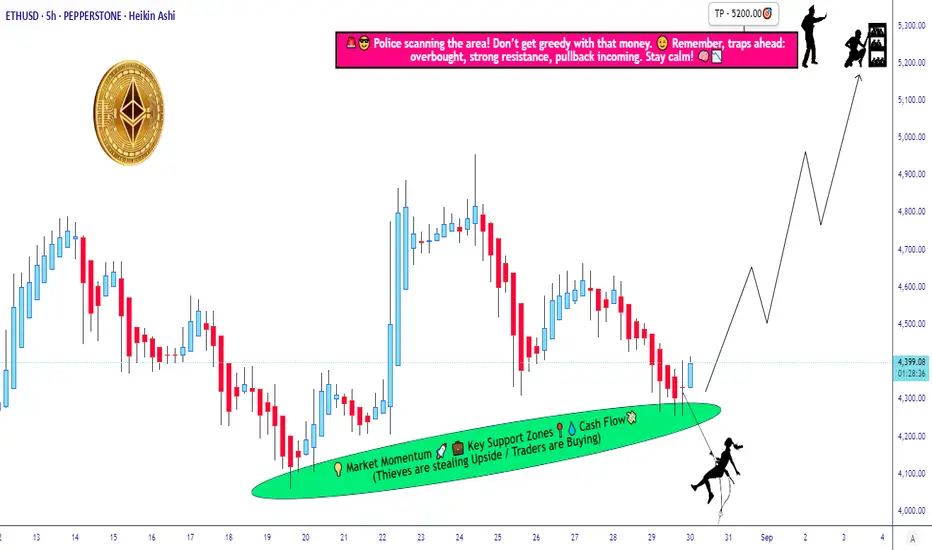
Stealing Profits from ETH! Bullish Layer Strategy Activated🔓💰 ETH/USD "Ethereum vs. Dollar" Money Heist Plan 💰🔓
🎯 Plan: Bullish Robbery | Swing/Day Trade
💎 Layered Entries | Precision Loot | Multi-Bag Grab
🚀 Target: 5200.00 | 🛑 Stop Loss: 4060.00
🚨👀 Attention Traders, Crypto Bandits & Market Looters! 👀🚨
The Ethereum vault is wide open – and Thief Trader is here with the LAYERED ENTRY STRATEGY. Stack those buy limits like gold bars in a secret vault. 🏦💎
💥 ENTRY: Any Price is a Good Price 💥
Thief style means we don’t chase – we LAYER.
⚔️ Multiple limit entries:
4400.00
4300.00
4200.00
(Add more layers if you’re savage enough.)
Every dip is a robbery opportunity – we’re not here to beg, we’re here to loot.
🔐 STOP LOSS: 4060.00 🔐
This is Thief’s SL Zone – where the cops show up.
OG Thieves know: adjust your SL to your own heist plan & risk appetite.
💸 TARGET: 5200.00 💸
That’s the police barricade – take the cash and escape before the sirens.
Secure the bag, don’t get greedy.
🧠 Thief Trader Secrets:
📊 Layered entries = survival + sniper precision.
⚡ Swing traders ride it, day traders loot it, investors just chill & count.
🔔 Trail your SL – don’t let profits get hijacked.
⚠️ HEIST PROTOCOL:
✅ No panic entries.
✅ Risk small, layer smart.
✅ Remember: patience = payday.
❤️🔥 Smash that 💥 BOOST BUTTON 💥 if you’re rolling with the Thief Squad.
Follow for the next Market Heist Plan – we rob, we layer, we escape with bags full. 💼💰
“Markets pay the disciplined thieves, not the desperate gamblers.” – Thief Trader
🤑📈🐂 #ETHUSD #CryptoHeist #ThiefTrader #EthereumHeist #LayeredEntries #CryptoTrading #RobTheMarket #MoneyHeistETH
Ethereum ETH Analysis: 1D Bullish Trend with Order Block Support🔎 I’m currently looking at Ethereum (ETH), which is showing a strong bullish trend on the daily timeframe 📈. Price has pulled back significantly into a daily bullish order block 🟢 — a previous accumulation range that I expect to act as a key support level.
On the 30-minute timeframe ⏱, I’m watching closely for a bullish break of structure 🔑 as confirmation for a potential long entry 🎯.
⚠️ Not financial advice.

Ethereum - Here comes the final breakout!🚀Ethereum ( CRYPTO:ETHUSD ) breaks the all time high:
🔎Analysis summary:
Finally, after a consolidation of about four years, Ethereum is back at the previous all time high. With the recent rally of more than +200%, bulls are flexing their muscles, preparing the breakout. So far, everything is playing out according to plan with new all time highs soon.
📝Levels to watch:
$5.000
SwingTraderPhil
SwingTrading.Simplified. | Investing.Simplified. | #LONGTERMVISION

Ethereum Eyes $5K Breakout — Is a New ATH Coming?Ethereum is approaching its major resistance zone near $5,000, showing strong bullish momentum after bouncing off the supportive trendline. The recent candle confirms a macro bullish reversal.
If CRYPTOCAP:ETH breaks and closes above the resistance zone, it could open the path toward new all-time highs. As long as it holds above $2,900–$3,000, the structure remains bullish.
DYOR, NFA

Day trading with Ethereum using 15min TF (short and long)By examining the live price action movement, I try to analyse and forecast the market maker actions using the 15min TF chart. If the conditions fulfilled, we will see Ethereum challenging 3320 and 3330 again. I use 15min TF for day trading and cross check with 1 hour TF.
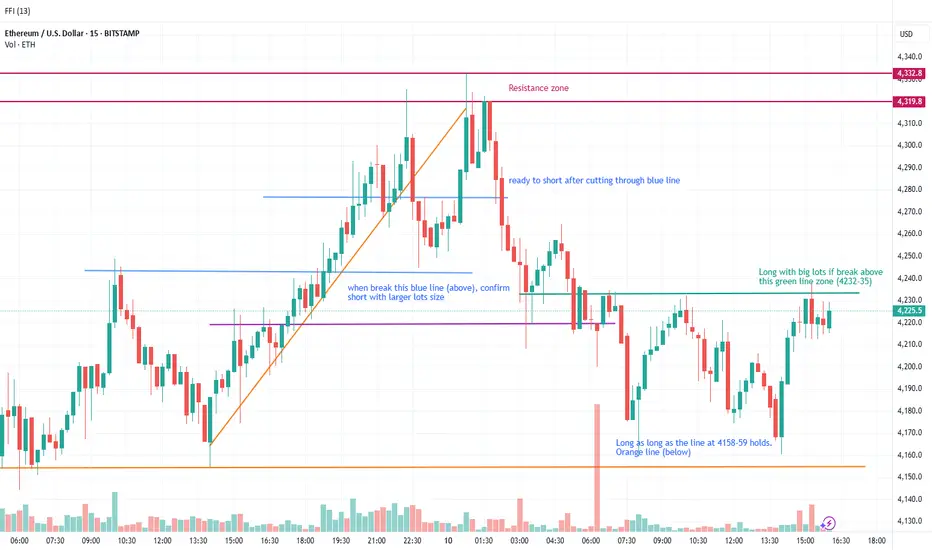
Day trading Ethereum (for both Long and Short)My analysis is based on the price action movement using liquidity pool to identify turnaround or fake manipulation move. Use FVG and iFVG to identify clear confirmation for trend movement. Price action allows me to shed light on the psychology and manipulated movement driven by market maker.
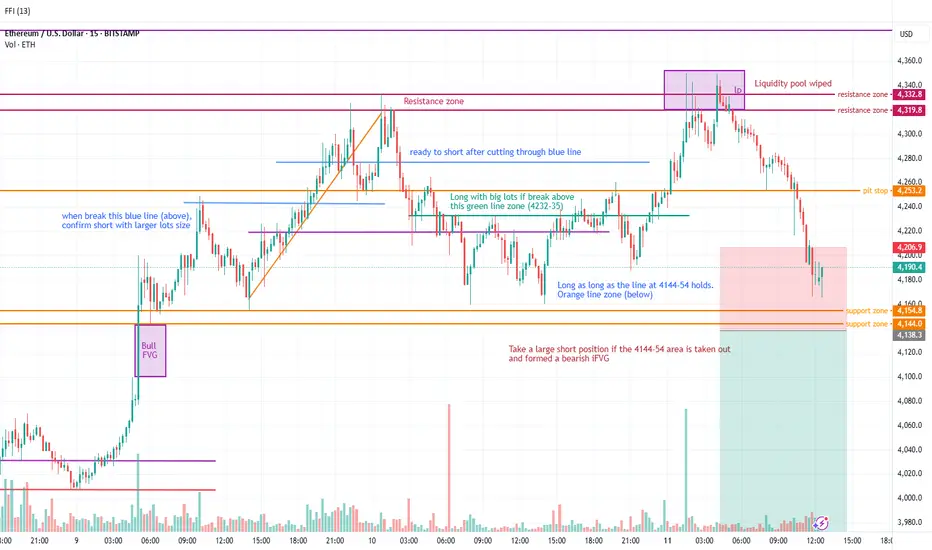
ETH short using 15-min TFI analyse the price action movement to shed light on the manipulation play and using FVG, iFVG, auction zone, support and resistance to reveal the directional bias to achieve the high win rate in leveraged and spot trading.

Ethereum New Analaysis (4H)Now, Ethereum may face a serious correction after making one more high. So pay close attention to the $4900–$5000 zone.
For this bearish scenario to play out, the SWAP zone on the 12H or daily timeframe must be broken and price must hold below it.
A daily candle closing above the invalidation level would nullify this analysis.
For risk management, please don't forget stop loss and capital management
When we reach the first target, save some profit and then change the stop to entry
Comment if you have any questions
Thank You

Ethereum Correction Ending? Next Bullish Wave Loading!In the previous idea , I was able to find the Ethereum price top at $4,788 . The question is, has the Ethereum correction begun, or is there still hope for the creation of a new All-Time High(ATH)?
Ethereum ( BINANCE:ETHUSDT ) is currently trading near the Support zone($4,240-$4,186) , Cumulative Long Liquidation Leverage($4,205-$4,158) , and important Support lines .
In terms of Elliott Wave theory , it seems that Ethereum has completed a corrective wave . The corrective wave has a Double Three Correction structure(WXY) . If the Resistance zone($4,410-$4,324) and Cumulative Short Liquidation Leverage($4,416-$4,375) are broken, we can confirm the end of the corrective wave .
I expect Ethereum to start rising from important support lines and rise to at least $4,373 .
Second Target: $4,484
Third Target: $4,607
Stop Loss: $4,097
Note: Today's Fed Chair Powell Speaks can create excitement in financial markets, especially crypto.
Please respect each other's ideas and express them politely if you agree or disagree.
Ethereum Analyze (ETHUSDT), 1-hour time frame.
Be sure to follow the updated ideas.
Do not forget to put a Stop loss for your positions (For every position you want to open).
Please follow your strategy and updates; this is just my Idea, and I will gladly see your ideas in this post.
Please do not forget the ✅' like '✅ button 🙏😊 & Share it with your friends; thanks, and Trade safe.
Ethereum - The moment of truth!🔬Ethereum ( CRYPTO:ETHUSD ) trades at a key breakout level:
🔎Analysis summary:
Ethereum - after consolidating for the past four years - is once again retesting the previous all time high. And before we will witness another bearish rejection, Ethereum has the chance to finally break out of the long term triangle pattern. It's time for us to start praying.
📝Levels to watch:
$4.000
SwingTraderPhil
SwingTrading.Simplified. | Investing.Simplified. | #LONGTERMVISION

Ethereum Price Aims at $5,000 As Exchange Balance Falls To 9-YeaBINANCE:ETHUSDT is currently priced at $4,531 , positioned just above the $4,500 resistance. The broader indicators, suggest a favorable environment for a breakout. On-chain data highlights a key trend supporting Ethereum’s macro outlook.
Exchange balances have dropped to a nine-year low of 14.88 million BINANCE:ETHUSDT , signaling that investors are moving their holdings into long-term storage.
If BINANCE:ETHUSDT manages to reclaim $4,500 as support , the uptrend could accelerate. This move would help the cryptocurrency push through the next resistance at $4,749, paving the way for a test of the $5,000 mark.
However, risks remain if investor sentiment shifts suddenly. Should holders decide to secure profits, BINANCE:ETHUSDT could slide toward $4,200 or even $4,000 . Such a decline would weaken the bullish thesis, opening the door to consolidation instead of continuation of the current uptrend.

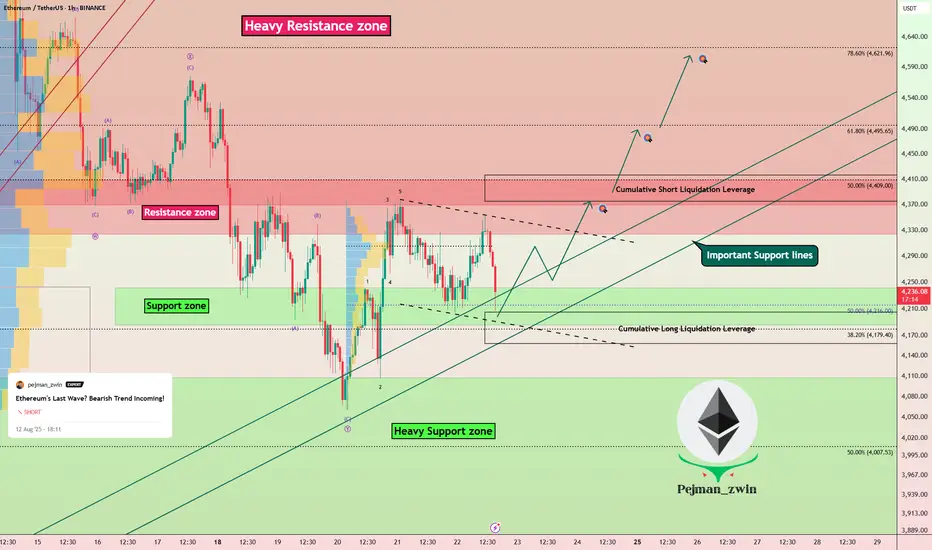
Ethereum's Last Wave? Bearish Trend Incoming!Ethereum ( BINANCE:ETHUSDT ) started to rise and pump as I expected in the previous idea .
Ethereum is currently trading in a Heavy Resistance zone($4,868(ATH)-$3,977) near the Potential Reversal Zone(PRZ) , Cumulative Short Liquidation Leverage($4,527-$4,452) , and the upper line of the ascending channel(potential) .
In terms of Elliott Wave theory , Ethereum appears to be completing microwave 5 of main wave 5 . Main wave 5 could complete at the Potential Reversal Zone(PRZ) .
Also, we can see the Regular Divergence(RD-) between Consecutive Peaks .
Before any conclusions, let's take a look at the ETHBTC ( BINANCE:ETHBTC ) chart.
ETHBTC also indicates the end of the uptrend, and if the market falls , we can expect ETH and the tokens on the Ethereum blockchain to undergo a correction this time.
I expect Ethereum to bearish trend in the coming days and at least close the CME Gap($4,185-$4,080) .
One of the tokens that we can use for short positions alongside Ethereum is the ENS token ( BINANCE:ENSUSDT ). ENS is the decentralized naming system built directly on the Ethereum blockchain, simplifying crypto addresses into human-readable names .
Cumulative Long Liquidation Leverage: $4,145-$4,094
CME Gap: $3,461-$3,417
Note: Stop Loss: $4,780
Do you think Ethereum will create a new All-Time High(ATH) soon, or should we wait for a correction?
Please respect each other's ideas and express them politely if you agree or disagree.
Ethereum Analyze (ETHUSDT), 4-hour time frame.
Be sure to follow the updated ideas.
Do not forget to put a Stop loss for your positions (For every position you want to open).
Please follow your strategy and updates; this is just my Idea, and I will gladly see your ideas in this post.
Please do not forget the ✅' like '✅ button 🙏😊 & Share it with your friends; thanks, and Trade safe.

Ethereum inches toward $5K as Standard Chartered sees $7,500Ethereum inches toward $5K as Standard Chartered sees $7,500 in 2025
Apparently Standard Chartered has sharply raised its year-end 2025 price forecast for Ethereum to $7,500, according to reports from crypto news outlets including CryptoRank and BlockNews.
ETH recently broke above $4,000 and is now just 5% away from the $5,000 mark, which would set a new all-time high.
On the 30-minute chart, price is holding in a tight range near recent highs, showing that buyers are potentially still in control but lacking immediate momentum. Short-term support might sits around $4,650, with stronger support near $4,580.
Looking beyond 2025, Standard Chartered reportedly expects Ethereum to continue climbing, projecting $12,000 in 2026, $18,000 in 2027, and $25,000 by 2028.

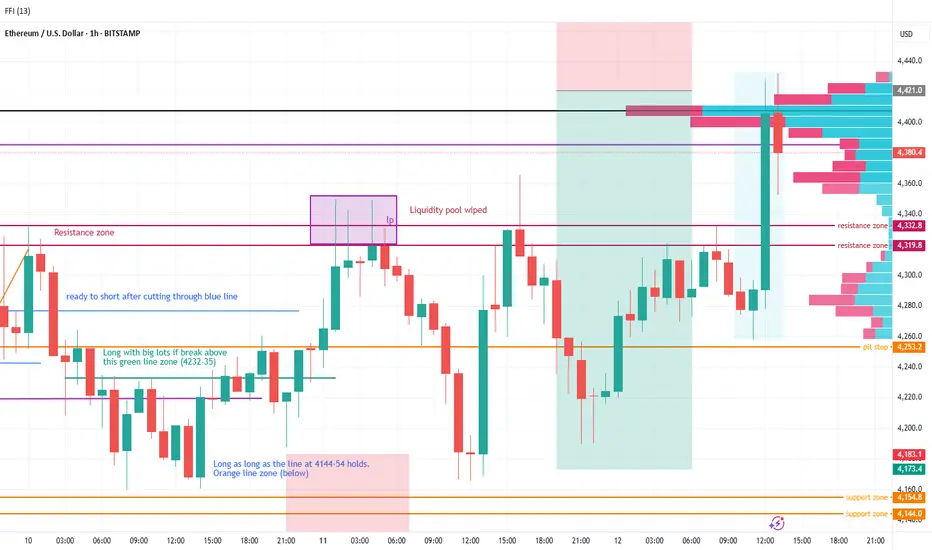
Using 1-hour TF with Volume to identify the Short entryI used the volume analysis to identify the entry for my shorts in this economic events manipulated price action movement. I trade based on my analysis on market maker price action and psychology. I do employ FVG and iFVG in my trading confirmation, thus empowering me with greater confidence in my trade setup.
Ethereum (ETH) Price Hits 3.5 Year High; Nears ATH Of $4,891BINANCE:ETHUSDT is approaching a significant milestone in August, trading at $4,182, a 3.5-year high . The altcoin breached the $4,000 mark over the weekend, setting its sights on the next target of $4,891. This strong upward momentum suggests Ethereum could make history if it sustains its growth.
At $4,303, BINANCE:ETHUSDT is 17% away from its all-time high (ATH) of $4,891 . To reach this ATH, ETH must first secure $4,500 as a stable support level. A successful consolidation above this threshold could set the stage for ETH to continue its bullish ascent towards the ATH.
However, if investor sentiment shifts and selling pressure increases, BINANCE:ETHUSDT could struggle to maintain its position above $4,000 . A decline below this level would invalidate the bullish outlook, potentially reversing the recent gains and sending ETH lower.

$ETH Breaks Confluence Barrier — Next Stop ATH? CRYPTOCAP:ETH has broken above a major confluence zone, where long-term resistance and trendline pressure have been holding price back. This breakout signals renewed bullish momentum and opens the door for a potential push toward the previous all-time highs.
The strong demand zone below continues to act as a solid foundation, and RSI momentum suggests buyers are still in control. As long as ETH holds above this breakout level, the bullish outlook remains intact.
