Micro Bull Flag inside of a Macro Ascending Triangle?It appears as though Ethereum is reaching a point of no return, only time will tell.
Bullish flag formations are found in stocks with strong uptrends. They are called bull flags because the pattern resembles a flag on a pole. The pole is the result of a vertical rise in a stock and the flag results from a period of consolidation. The flag can be a horizontal rectangle, but is also often angled down away from the prevailing trend. Another variant is called a bullish pennant, in which the consolidation takes the form of a symmetrical triangle. The shape of the flag is not as important as the underlying psychology behind the pattern. Basically, despite a strong vertical rally, the stock refuses to drop appreciably, as bulls snap up any shares they can get. The breakout from a flag often results in a powerful move higher, measuring the length of the prior flag pole. It is important to note that these patterns work the same in reverse and are known as bear flags and pennants.
An ascending triangle is a chart pattern used in technical analysis. It is created by price moves that allow for a horizontal line to be drawn along the swing highs, and a rising trendline to be drawn along the swing lows. The two lines form a triangle. Traders often watch for breakouts from triangle patterns. The breakout can occur to the upside or downside. Ascending triangles are often called continuation patterns since the price will typically breakout in the same direction as the trend that was in place just prior to the triangle forming.
Notice a divergence on the RSI?
Ethereumdollar

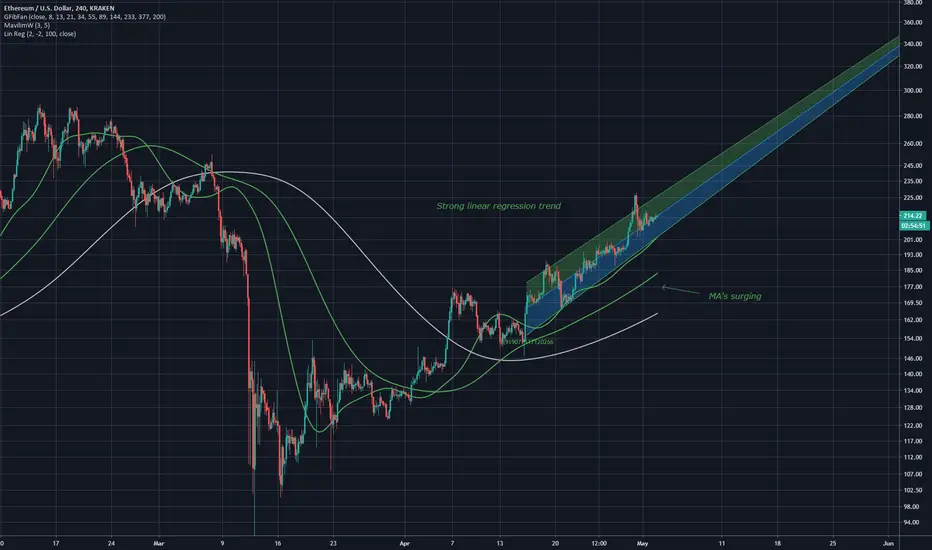
ETH big move - Linear chartBull flag right below long term trend line
Looks good
Using linear instead of log

Ethereum🍰Hello, my friends, I wanna share with you the idea of Ethereum.💡 So many asked me to show my vision.🧐
It seems to me, that we're in the distribution zone, is that true? Only time will tell us.⏳
In the meantime, who does not know, what distribution is or has forgotten a little, here’s my training post👇🏻
☝🏻That's the example of Bitcoin's chart, so the price movement is very arbitrary.
Thank you for staying with me.💓
PS. friends, eat a piece of cake for me, today I have Birthday and I'll be very happy if you think of me 🍰
Stay with me💋
Your Rocket Bomb 🚀💣

ETH similaritiesSimilarities to previous take off point
Bored sketch
Labelled in (1)
The bars pattern is of course highly speculative.

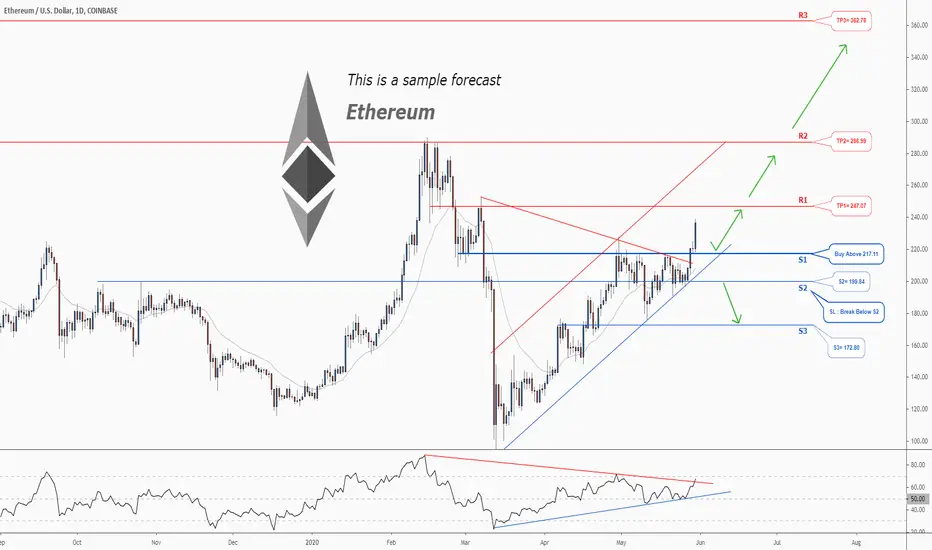
There is a possibility for the beginning of an uptrend in ETHUSDTrading suggestion:
. There is a possibility of temporary retracement to suggested support line (217.11). if so, traders can set orders based on Price Action and expect to reach short-term targets.
Technical analysis:
. ETHUSD is in a range bound and the beginning of uptrend is expected.
.The price is above the 21-Day WEMA which acts as a dynamic support.
. The RSI is at 68.
Take Profits:
TP1= @ 247.07
TP2= @ 286.99
TP3= @ 362.78
SL= Break below S2

Ethereum Swing TradeAnalysing Ethereum on a daily time frame for a swing trade
ETH has finished its impluse Wave 1 at 221 levels. Wave 2 should correct at 130 levels which should a a good buy zone to enjoy the rally of Wave 3.
Wave 3 can be expected to be at Fib ext 161.8% which will be somewhere around 330 price levels.
To summarise:
1. Buy zone: 130
2. Target: 330
3. Return: 2.5x / 154%
4. Stop loss at 80
5. RR= 4x

Don't miss the great buy opportunity in ETHUSDTrading suggestion:
. There is a possibility of temporary retracement to suggested support line (202.17). if so, traders can set orders based on Price Action and expect to reach short-term targets.
Technical analysis:
. ETHUSD is in a range bound and the beginning of uptrend is expected.
.The price is above the 21-Day WEMA which acts as a dynamic support.
. The RSI is at 50.
Take Profits:
TP1= @ 224.50
TP2= @ 245.00
TP3= @ 286.80
SL= Break below S2


#ETHUSD ANALYSIS.. BEARS ARE READY.. I think investors should pay attention to death cross that took place in Ethereum a while ago, in this context, the possibility that the trend might reverse for Ethereum should not be ignored..
Death cross can have an effect like a short upward movement firstly and a deep correction phase for a long time.. In the technical indicators, the T3 curve may return to negative in the near future, and the coppock curve has turned its direction downward.. There is no clear sell signal yet, but in my opinion there are some leading indicators that the bears will take control the market.. I expect a price movement in #ETHUSD as I mentioned in the chart..
Disclaimer: What I wrote is not investment advice.. Please do your own due diligence when it comes to crypto-investing.. Never put in money that you cannot afford to lose.. Invest at your own risk..
I wish you all the best..

Is Ethereum Going To Hit $10K Within Next Year???Descending triangle:
In my previous article we have already discussed that the price line of Ethereum is moivng in descending triangle. The support of this triangle is at $90. The priceline entered in this triangle in December 2018 and after hitting the support turned strong bullish and rallied more than 355%. And after June 2019 the Ethereum dropped down again. But this time the priceline did not hit at the support of this triangle. Because the the lower bands of the bollinger bands was above the support of the triangle therefore it played the role as a strong hurdle for the price action and stopped the priceline to reach the support of triangle. And this time in March 2020 we can again see that bollinger bands was moving with the support of the triangle therefore the price line had the capacity to reach up to the support and on the candlestick of 9th March 2020 we have seen that the priceline has reached the support at $90 and now is has turned strong bullish. Sofar the price line has rallied more than 152%
Here I have also placed the volume profile on the complete price action moving within this triangle and as result we can see that the trader’s interest is very low below $107 Its mean that the traders are less interested in trading close to the support of the triangle therefore we can when the priceline moved below this level it turned bullish and moving up.
Ethereum is bounced from the support that is not broken down since more than a year:
If we switch to the daily chart that we can observe that after that after strong bearish move of the month of March finally the price action has hit the support of $122. This is very strong support that is not broken down since more than a year therefore the priceline is not able to break down this support. From this support level the Ethereum took a powerful divergence and broke out the first resistance level at $149. And after breaking out this resistance level the priceline has re-tested this resistance as a support and moved up. At this time we can see that the price action is attempting to breakout the next resistance level of $224. If this resistance will be broken out then the priceline may re-test this resistance level as a support then it will move up to make an attempt to break out the next resistance level of $310.
Big bullish Gartley has started its job:
Here I would like to recall the big bullish Gartley pattern that we have discussed in previous article, that the Ethereum has form very big bullish Gartley pattern on the monthly chart same as like the Bitcoin has formed. The strong bearish move of the month of March has helped the price action of Ethereum to complete the final leg of the bullish Gartley pattern. Even the priceline has hit the spike beyond the potential reversal zone but on the same candlestick the priceline retraced back and re-entered in the potential reversal zone again. The buying zone of this pattern starts from $188 and ends up to $141 and as per Fibonacci sequence of harmonic Gartley pattern the price line should move up in the Fibonacci projection of A to D leg that starts from $245 and ends up to $315. The maximum extent of this sell zone or Fibonacci projection area $315 is almost at the same level where we have third resistance level. And that is on $310. Therefore this time there are strong chances that the priceline will hit $315 level to breakout this resistance.
This bullish indication is going to appear second time in the history of Ethereum:
Now I would like to discuss with you the most strongest indication that can lead the priceline of Ethereum to hit the $10,000. And that is the ichimoku cloud on the weekly chart if we see back in 2016 when the price action crossed up the ichimoku cloud then it Ethereum produced more than 12933% bullish rally. And after hitting the highest price the Ethereum turned bearish and on June 2018 the priceline crossed down the cloud. Since then Ethereum is not able to cross up this cloud again. And at this time we can see that the price action of a Ethereum is making third attempt to cross up this ichimoku cloud. Once the priceline will be able to cross up this cloud then this ichimokum bearish cloud will be turned bullish and it will become most strongest support for the price action of Ethereum. That can lead the priceline to hit higher than the previous highest price. Therefore there can be a possibility that it will hit $10,000 within next 2 years. The lagging span has already crossed up the candle sticks that is another bullish indication this will be helpful for price action to cross the candles.
Conclusion:
There are strong chances that the Ethereum will make an attempt to breakout $310 resistance. Incase of breaking out $310 resistance level the Ethereum can easily cross up the ichimoku cloud after that the price line can turn bullish and incline on long term.

Ethereum Spiral ResistanceSpiral resistance
Could be smashed through im long so i want that to happen but it is an important level.
Wedges can also be seen. The rising wedge can be seen to be breaking down, this may be the result of another falling wedge present.

#ETHUSD ANALYSIS.. NEGATIVE SIGNALS.. I think there are some details in ETHUSD that should be paid attention to for a short term..
First, we see a rising wedge pattern in hourly chart, sales may harden if the formation works.. Also, there is a negative divergence in RSI, this is bearish.. There are some important signals that sales may come in the near future, we will wait and see..
Disclaimer: What I wrote is not investment advice.. Please do your own due diligence when it comes to crypto-investing.. Never put in money that you cannot afford to lose.. Invest at your own risk..
I wish you all the best..

ETH POSSIBLE FAKEOUT ! SHORT ITETH and BTC are pushing up and didn't make any correction in this up trend
This kind of uptrend ends with wilds movements
I expect a last push up to take all the stop loss + the liquidity above $200 and then a big drop

The Dominace Of Ethereum. (ETH)Nice wedge pattern developed.
We are testing the top of range.
Monthly is showing a potential turn for a big push up.
Bitcoin dominance continues to drop as ethereum dominance seems to show different signs.
We are getting some nice price movement on the weekly and 2 week on bitcoin but we are not out of the gate yet.
Monthly turns are the signs we want when looking for a long term entry.
Good luck.

#ETHUSD ANALYSIS.. DUMP INCOMING.. Bears will dominate the whole market for a while, but I firmly believe that these are the last zig-zags before a new market cycle..
We see wedge pattern on #ETHUSD weekly chart and I think, as I mentioned in the graphic, we will find the bottom we have been looking for for a long time.. I think the reference value of rsi 50 is very important, in this context, we can see a fractal as the leading indicator that sales will get harder soon, we will wait and see.. Also, the value of 0.95 for vortex has worked quite meaningfully from the past to the present, as it can be seen in the weekly chart of Ethereum , the value in question produces important clues for us and should be watched carefully in the future..
All these arguments point to a negative process in the medium term, my personal opinion is that Ethereum will drop up to $ 47 and gives a serious buying opportinuty before a new market cycle..
Sometimes you need to break your knees a bit more to jump higher..
Disclaimer: I am not a financial advisor.. Please do your own due diligence when it comes to crypto-investing.. Never put in money that you cannot afford to lose.. Invest at your own risk..
I wish you all the best..

Ethereum Rising WedgeRising Wedge formation
Bearish move expected as per chart pattern
However price is currently hovering over .382 so trade wisely
Chart for possible future bottoms (long term), ultra bullish of course


ETH Rising WedgePrice has broken out into a rising wedge, one of the gann band resistances has been broken in doing this. This new rising wedge can act as support for price, as can the fibonacci spiral.

ETHUSD: it's going to test $200Ethereum sneaks up to $200 and as long as bitcoin will continue to be bullish - it has every chance to hold higher.
My idea is a simple scalp short from $200, ''coz I'm not sure it'll crash resistance from the first try.
Hit the "LIKE" button and follow to support, thank you.
Information is just for educational purposes, never financial advice. Always do your own research.
