Fib waves?Bullish and bearish fib waves
it can be seen that .236 is a bearish fib wave for ETHBTC pair
While 1.618 can be seen to overall be a bullish Fibonacci wave
These Fibonacci waves are movements within a Fibonacci circle
Very bullish pair
Ethereumdollar

My Investment Plan Scratch the Trading PlanAs I write I will include quotations from my part one idea.
For those that don't have an investment plan I recommend you do this
(1) Buy a ledger, put your favourite cryptocurrency on it
(2) Wait
(3) Pass on to your loved ones
In doing this replacing 'margin trading' "As I believe this is a huge growth industry, currently I use a Ledger, which are readily available and a great way to store your currency."
Sadly i am convinced that there is no 'fast way' to make money. 90% of Trades are likely to fail and will fail, and favoring the more stable 'growth over time' method is a lot more logical.
From my own perspective I have tried margin trading and I have won and lost, but overall lost, its non-profitable. (I don't know about all y'all but either you're a king walking earth or lying). Let me know if you think you're a king.
Replacing this popular margin trading with the ledger in turn won't have you checking your phone every two minutes, checking prices.. And is incredibly less psychologically straining. I 'put the most emphasis on this' as you have possibly noticed the psychological strain yourself.
Currently i (and you should) simply 'ride the ups and downs' of the market with joy, knowing that the long-term uptrend is still intact. Which is very satisfying.
'For reference currently I plan on holding my cryptocurrency for 20+ years' That is the current plan, however i may put it in my Will.
Many of these coins are very young and have much growth to experience.
Good luck and stay safe friends
My first idea if anyone would like to see it, a repost really but i thought now i have a larger following I would let more people know
Cheers,
Bixley

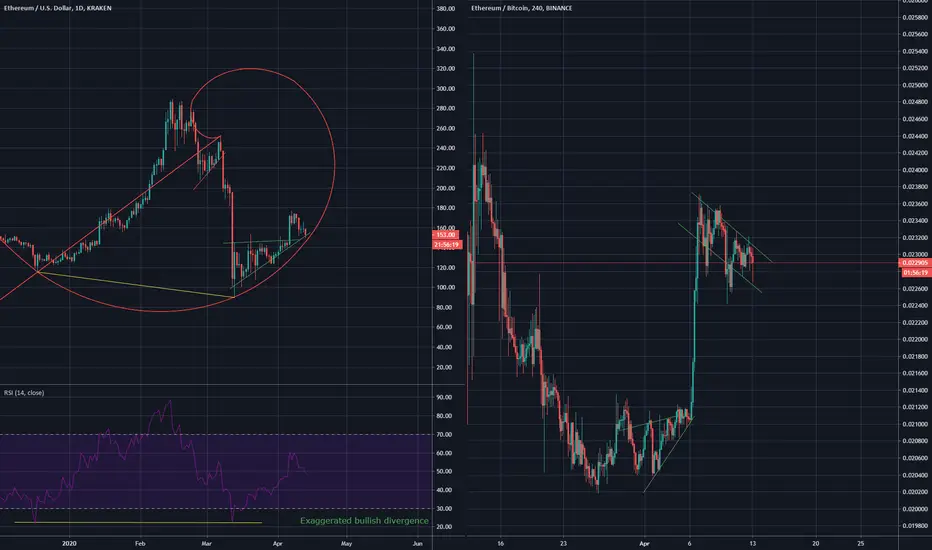
Ethereum BuyFibonacci spiral suggesting a buy for Ethereum
Im long ETH so i thought i better be making more ETH charts :'P
ETHUSD | Rejected by the Mid Line Please support this idea with LIKE if you find it useful.
Price was rejected by the Mid Line of the Descending Channel. So we can initiate a short position, with stop-loss above the Mid Line. Or better in the Ichi Cloud zone, because the Ichi Cloud resistance can be tested
Thank you for reading this idea! Hope it's been useful to you and some of us will turn it into profitable.
Remember this analysis is not 100% accurate. No single analysis is. To make a decision follow your own thoughts.
The information given is not a Financial Advice.

ETHUSD forming bullish Shark | A good buying opportunity aheadIn my previous idea we have seen that on 1 hour chart the Ethereum with Bitcoin pair was forming bullish Shark then finally as per prediction the priceline entered in buying zone and after hitting the sell zone dropped down.
Formation of new Shark pattern:
This time again on short term hourly chart the price action of Ethereum with US dollar pair is forming another bullish harmonic Shark pattern and soon it will be entered in potential reversal zone.
Buying And Sell Targets:
The buying and sell targets according to harmonic Shark pattern should be:
Buy between: $152.95 to $150.74
Sell between: $154.86 to $159.24
Stop Loss:
The potential reversal zone area which is up to $150.74 can be used as stop loss in case of complete candle sticks closes below this level.
Possible profit and loss ratio:
As per above targets this very short term hourly chart trade has the profit possibility of 5.63% and as per above mentioned stop loss, the loss possibility is 2.82 %.
Note: This idea is education purpose only and not intended to be investment advice, please seek a duly licensed professional and do you own research before any investment.

ETH/USDT we don't buy at Resistance zones.Hello Traders,
Today i am gonna be doing a simple and quicly analyses for ETHEREUM/DOLLAR is facing a KEY level right now.
A key level is one place where the price worked many times as support and resistance over trade history, and now we are facing this level as resistance, and we don't buy at resistance zones.
If we start a bullish acumulation pattern at this level the long position will be interesting once again.
Please press the like button and follow us on the tradingview.

Ethereum - mixed signalsEthereum also showing mixed signals. With a bullish inverted ascending scallop formed supported by the formation of a bullflag on the 4H chart for the bulls case. Also a bearish triangle formed for the bears case.

ETH / USD - The Virus is calling the Bottom soon?????ENLA Auto Trader Called the new Short at 130 $
New Buy Zone between 90$ - 105$ ETH?????
NO FINANCIAL ADVISE

ENLA Auto Indicator called the Short on ETH for around 8% ProfitPossible Head & Shoulders with pump back in the upcoming week.
Crypto was build for Financial Crisis but the actually Situation is not just a financial crisis, it is more like the people need the Money for life and to protect theyr Businesses.
NO FINANCIAL ADVISE

Ethereum Re-Tests Major Support AreaETH is following a descending support line and has done so since July 2019. There is a strong support area at $85, which will soon coincide with the descending support line.
On March 12, the Ethereum price decreased significantly and reached a low of $101.2. Since then, it has made numerous attempts at retracing last week, most notably on March 20, when it reached a high of $153, but they have all ultimately been proved to be unsuccessful.Therefore, the short-term upside potential is limited, since the price has to flip numerous resistance levels in order to move upwards.
Rather, the price is expected to re-test the support line and support area, before possibly making another attempt at bouncing upwards.
Please leave a LIKE and/or a COMMENT if you enjoyed the analysis

ETHUSD | Rising WedgePlease support this idea with LIKE if you find it useful.
Price broke the Rising Wedge pattern with a confirmation (Three Black Crows). In case there is a confirmed rejection of the Ichi Cloud resistance zone we can initiate a short position. If horizontal support is lose we can also initiate a short position
Thank you for reading this idea! Hope it's been useful to you and some of us will turn it into profitable.
Remember this analysis is not 100% accurate. No single analysis is. To make a decision follow your own thoughts.
The information given is not a Financial Advice.

ETHUSD | Upward BreakoutPlease support this idea with LIKE if you find it useful.
Price made an Upward breakout of a symmetrical triangle and can test the Ichi Cloud resistance zone
Thank you for reading this idea! Hope it's been useful to you and some of us will turn it into profitable.
Remember this analysis is not 100% accurate. No single analysis is. To make a decision follow your own thoughts.
The information given is not a Financial Advice.

Ethereum is forming bullish Crab | For a big bullish moveHi Folks hope you are doing good, this bearish trend is helping many tokens and cryptocurrencies to complete their final bearish legs to form bullish patterns and Ethereum is also one of them. On 2 day chart the Ethereum is forming bullish Crab pattern, and soon it will be entered in potential reversal zone but before that we will need some more bearish trend.
Let’s dig this pattern deeper to observe how perfect this pattern is formed:
After initial leg (X to A) the A to B leg is retraced between 0.328 to 0.618 Fibonacci and then B to C leg is projected between 0.382 to 0.886 of A to B Fibonacci projection area and last leg (C to D) should be retraced between 1.27 to 161.8 Fibonacci.
Buying And Sell Targets:
The buying and sell targets according to harmonic Crab pattern should be:
Buy between: $69.28 to $8.87
Sell between: $116.26 to $230.36
So if the final leg will be retraced up to maximum extent then this pattern can produce up to 2497% big gains.
Stop Loss:
The potential reversal zone area can be used as stop loss in case of complete candle stick closes below this level.
Note: This idea is education purpose only and not intended to be investment advice, please seek a duly licensed professional and do you own research before any investment.

ETHUSD | Rising WedgePlease support this idea with LIKE if you find it useful.
Price formed a Rising Wedge pattern. In case there is a confirmed breakout we can initiate a short position. Also it will be a rejection of the Ichi Cloud resistance zone
Thank you for reading this idea! Hope it's been useful to you and some of us will turn it into profitable.
Remember this analysis is not 100% accurate. No single analysis is. To make a decision follow your own thoughts.
The information given is not a Financial Advice.

ETH 4H DivergenceBullish divergence on the 4H chart, this may result in a short term upside. My 'bait' wick analysis was incorrect, and i apologize to anyone that entered a trade. I will link it. This divergence shows promise for the short term, and margin / leverage traders however. Fortune favors the bold! Currently analyzing the success rate of these divergences.

ETH baitEthereum has produced a bullish divergence (if it has bottomed), while clinging onto the 50MA on the weekly chart. Expect nice price moves up to the 50MA in the next few days to create a nice doji (possibly dragonfly) and later continuation of the parabolic rally that has been seen. Classic example of the bullish divergence in which the price produces lower lows while technical indicator produces higher lows.

ETHEREUM long term supportLong term support formed from a previous resistance, price is also attempting to cling onto the 50MA on this weekly chart. Not much else to say, it has been a bloody couple of days for my portfolio. I expect a reversal once this support line is touched.

Ethereum on a breakout rallyAfter a rally in the early part of 2020, perhaps Ethereum is now just done with the retracement. It retraced a little deeper than expected (orange box), but has just made its comeback and relaunched the next leg rally.
This time, it’s m coordinated well with the MACD and the OBV crossing up just a few days ago.

Ready for Ethereum dominance? (Wedge + Pennant)Falling Wedge was broken above and the price reached half of the target level already.
Now price forming a Pennant which means a continuation pattern.
Be ready to long when the price goes up to the resistance line of Pennant.
Good luck.

ETHUSD | Bearish PennantPlease support this idea with LIKE if you find it useful.
Price formed a Bearish Pennant. We can initiate a Short position if price makes a confirmed breakout of Support level of the Pattern.
Thank you for reading this idea! Hope it's been useful to you and some of us will turn it into profitable.
Remember this analysis is not 100% accurate. No single analysis is. To make a decision follow your own thoughts.
The information given is not a Financial Advice.

ETH cap wide trading rangeETH cap can be seen to have a wide trading range, as indicated by the support and resistance provided by the parallel channel that is currently present. Massive opportunity for upsides.

ETHUSD | Fixed Above Two Horizontal ResistancesPlease support this idea with LIKE if you find it useful.
Price fixed above two horizontal resistances which can lead to third horizontal resistance will be tested. We can initiate a long position in case there is a confirmed breakout
Thank you for reading this idea! Hope it's been useful to you and some of us will turn it into profitable.
Remember this analysis is not 100% accurate. No single analysis is. To make a decision follow your own thoughts.
The information given is not a Financial Advice.

ETHUSD | Testing Horizontal ResistancePlease support this idea with LIKE if you find it useful.
Currently price testing horizontal resistance. If there is a confirmed breakout we can initiate a long position. If price takes a correction we can initiate long on a confirmed retracement from on of the support levels.
Thank you for reading this idea! Hope it's been useful to you and some of us will turn it into profitable.
Remember this analysis is not 100% accurate. No single analysis is. To make a decision follow your own thoughts.
The information given is not a Financial Advice.
