Ethereumdollar

HistoryWill ETH repeat history and start a massive new bull run? Imo ETH has just been in a dip for a year, and we will see BIG movement in the years to come, with a moonshot comparable to Bitcoins 2017 run. Exciting times.

Don't miss the great buy opportunity in ETHUSDTrading suggestion:
. There is a possibility of temporary retracement to suggested support line (147.35). if so, traders can set orders based on Price Action and expect to reach short-term targets.
Technical analysis:
. ETHUSD is in a range bound and the beginning of uptrend is expected.
. The price is below the 21-Day WEMA which acts as a dynamic resistance.
. The RSI is at 38.
Take Profits:
TP1= @ 168.00
TP2= @ 191.75
TP3= @ 224.15
SL= Break below S2


Ethereum holding 150?Bottom of regression channel on 4hr looking for a move upward, DMI shows extended bearish action, hopefully holding the parabolic curve seen in the weekly chart.

ETHUSD formed bullish Crab | Upto 46% expectedPriceline of Ethereum / US Dollar cryptocurrency has formed a bullish Crab pattern and entered in potential reversal zone.
This PRZ area should be used as stop loss in case of complete candle stick closes below this zone.
I have used Fibonacci sequence to set the targets:
Buy between: 140.83 to 124.86
Sell between: 153.21 to 183.53
Regards,
Atif Akbar (moon333)

Ethereum (ETHUSD) Market Outlook | Daily Crypto Market BreakdownETH is definitely at a make it or break it point. It will be very interesting to see how the crypto market reacts this next week. Let's see how low ETH and the other ALT coins can go.

Ethereum - Support vs CapitulationAfter another sell-off earlier today, crypto markets have continued to fall, with the total market cap dropping to $220 Billions threshold.
Ethereum couldn't avoid taking a 6.57% hit driven by the overall bearish market sentiment.
Question:
What is the probability you see at $175 major bottom and support against , $175 failure ?
Looking forward your commend and would appreciate your like and engagement.
Thank you
Scrembo


ETH/USD LogPotential for massive returns, 7000% seems far-fetched however based on the previous bull run, that is what we have seen.
Hopefully we see some upward movement with the release of ETH 2.0.


ETHUSD formed bullish Cypher | A good long opportunityPriceline of Ethereum / US Dollar cryptocurrency is has formed a bullish Cypher pattern and entered in potential reversal zone.
This PRZ area should be used as stop loss point in case of complete candle stick closes below this area.
I have used Fibonacci sequence to set the targets:
Buy between: 185.13 to 182.57
Sell between: 187.15 to 191.95
Regards,
Atif Akbar (moon333)

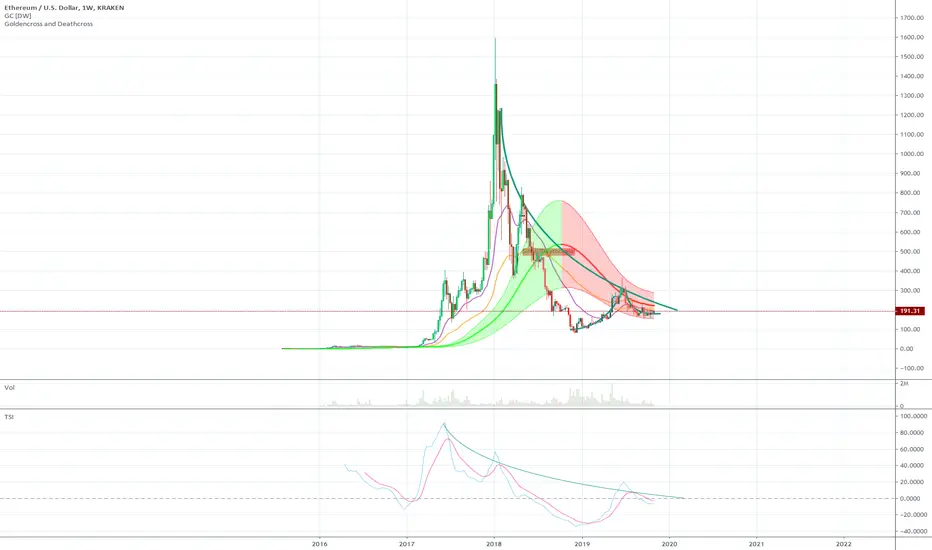
Ethereum updateMaybe looking for a golden cross. Personally i think Ethereum is extremely undervalued and 300+ is an appropriate target at this stage. We will see what unfolds in the weeks to come.

ETH/BTC Going to break this trendline? &MusicWhen will Eth break this trendline? For anyone interested in the winky face, I have been hearing a lot of references to 'the end is nigh' kinda thing in songs, (mostly rap music) Here's a list of songs with some references.
'We made you' Eminem (Dr Dre 2020!)
'Not Alike' Eminem, Royce Da 5'9"
'I wanna rock' G-eazy
'Boy Bye' BROCKHAMPTON (This is the year place your bets)
'WE GOOD!' Travis Thompson
'Oh Wow...Swerve' Dreamville ('And i feel like the world is ending soon')
Please leave comments!
I could be a schizophrenic so be wise. ;)
I still believe these comments that the current marketable applications of Ether outweigh that of Bitcoin, and overtime Ethereum will become the more popular of the two.

ETH/USD Price Action Analysis | Hopes & DespairsEthereum has got back in the Trading Range after a significant Bear Trap. Most of the bears are already got hunted and if not, will be hunted in the next up move along with the hopes of the bulls. That intersection of both, is where our entry initiates.
Entry: 187.9
SL: 208.1
TP-1: 152.1
TP-2: 132.1
R/R: 2.76
Please let me know if you have any suggestions or any ideas to add. I can also give you more detailed explanation for this specific trade setup.
The ideas published here are not financial advices.

ETHUSD formed bullish BAT | A buying opportunityPriceline of Ethereum / US Dollar cryptocurrency is forming a bullish BAT pattern and entered in potential reversal zone.
This PRZ area should be used as stop loss point in case of complete candle stick closes below this area.
I have used Fibonacci sequence to set the targets:
Buy between: 172.84 to 166.91
Sell between: 174.42 to 182.35
Regards,
Atif Akbar (moon333)

What's that? Is that a Ascending Triangle?
Check out the rsi as well, it appears as a symmetrical triangle. idk?
Fucking repo lol.

Alert for Ethereum Holder We are looking bearish trend in ether chat and our target is around 125$.
If you are trading on margin platform then you can take risk sell ether and get handsome profit.
We are not looking good market situation , so alts trader can wait for good entry.

ETHUSD formed bullish Crab | Upto 15% expectedThe priceline of Ethereum / US Dollar has formed a bullish Crab pattern and entered in potential reversal zone.
This PRZ area should be used as stop loss point in case of complete candle stick closes below this zone.
I have used Fibonacci sequence to set the targets:
Buy between: 196.10 to 188.24
Sell between: 202.20 to 216.97
Regards,
Atif Akbar (moon333)


ETHUSD forming a bullish shark | 12% potential short term tradeBy the grace of Allah the most high like always my previous chart of short term trade is also executed successfully:
Now on day chart after formation of successful bullish butterfly pattern the price action has started the formation of bullish Shark pattern, sofar all fibonacci sequence is going good as required for shark now the formation of last leg is in process and I am expecting that it will be also formed accordingly and soon the priceline will be entered in potential reversal zone.
The PRZ area should be used a stop loss zone if a complete candle stick will be closed below this area.
Volume profile of complete pattern is showing less interest of traders at this area.
But Stochastic is bearish and giving bear cross and MACD is turned weak bullish from strong bullish, so here I would suggest to wait for MACD to turn back strong bullish or if the MACD will be turned strong bearish then wait for to turn it back to weak bearish or wait for bull cross from stochastic then take the long position.
I have used Fibonacci sequence to set the targets:
Buy between: 166.30 to 161.63
Sell between: 171.16 to 181.23
Enjoy your profits and Regards,
Atif Akbar (moon333)
