Replicating the last Bull run ETHUSDA hypothetical channel that would lead to the replacement of the dollar
It happened once, why not twice ?
I expect controversy, go for it..
Magic internet money
Ethereumdollar

ETH Pump Potential - TopCapUsing the TopCap indicator for ETH we can see potential tops and previous tops
As you can see there is a massive discrepency between the ETHBTC chart and the USD chart
Suggesting there will be a second (2) up move for the USD pair to compensate
With ETHBTC's recent forming of a nice bullflag we could see some new highs for both pairs
I am long Ethereum

Ethereum .236 Trendline (Pink)The Trendline in pink (.236) shows cycles of movement down,up,down(bear market rally),up
This is supported by the touches on the Fibonacci circle especially 3.618 (yellow)
The last up cycle pushed the price up A LOT
Will this repeat?
My target is 20K as of now.

ETH vs BTC - Can we compare bullruns ?An idea comparing BTC's 2017 run to ETH's current run
Both are supported by a curved trend
Both have a point of interest for comparison
20k?

Another ETHEREUM AnalysisAll signs point to 20k
I know it sounds ridiculous, but consider it.
Pull a 2017 Bitcoin.
ETHUSD's first bull run pushed it up 23000%
Assume this occurs again
This places the price at just above 20k
With structural similarities, volume rising, and beautiful fundamentals. I wouldn't doubt it.
ETHBTC is displaying dangerously bullish signs with the current bullflag formed
It wants to form a channel from this recently acquired bull trend, which I have shown (parallel channel)
For this channel to form a large upward move would be needed, which I have plotted (bars pattern)
Putting ETHBTC at .25 briefly
With BTC also rallying to possibly (80 - 100k)
The price of one Ether would be 20k
Attached are my other popular analyses that also point to this

Ethereum 2214 is Valid.Welcome , Welcome , Welcome Back
2020-2046 TP We will draw Picture for you.
ReTest Finished. First Target is Valid.
We buy the trend.
Definitely do not miss these opportunities.
Hedge Golden Attack. Will back us or Watch it.

ETHUSD thoughts Ethereum is still within this wedge structure
Still above the major trendline that has formed (in yellow)
Red dotted line is where price will flirt with below the major trendline before bull momentum returns
I do believe this is just a very long pullback and bull action will resume
If it is, its the biggest shake ive witnessed so far

ETHUSD/BTC Falling WedgesETHBTC has formed a nice flag/falling wedge pattern that will very likely break out to the upside
While ETHUSD is trying to find a bottom 0.786 is a good candidate, with it being a previous point of resistance, now could prove itself as a point of support (green)
I have drawn also how I think the MA's (50,100,200) will play out on the USD pair, 4Hr chart
Continuation up for ETHUSD after two touches on the 200MA


Alligator Fakeout's, 58% Time will tell I guess
I am hodling my bullish stance
Yes it does look like a top formation, however time does not warrant a top this early
With everything going on around the Ethereum space (NFT's, DeFi) A run greater than that of BTC's 2017 run is expected by me.
I am long Ethereum

EthUsd- down after consolidationAfter breaking under 2200 support, Ethereum has started to consolidate.
In my opinion, a new leg down will follow and I maintain my 1800 target.
EthUsd above 2200 would delay this bearish scenario

Ethereum - this could be the best area to buy!!! 🤑🤑New update on ETH. On the Ethereum chart, we see that the price broke the important $2.177 level, closed above, tested it as support, and went up. Locally, we also see a trend line, which prevents prices from declining and is strong support. If the price corrects to the area marked below, it could be a good time to buy with the targets marked above!
Write in the comments all your questions and instruments analysis of which you want to see.
Friends, push the like button, write a comment, and share with your mates - that would be the best THANK YOU.
P.S. I personally will open entry if the price will show it according to my strategy.
Always make your analysis before a trade

Ethereum Hourly Idea ETHUSDA symmetrical triangle followed by a descending broadening wedge
now we are presented with a rising wedge which usually results in a downward outcome (red bars pattern)
The red bars pattern hits the downtrend and 1.618 at the same time, providing a huge support
This is the optimal entry point
Yellow zones are just areas of importance (rejection areas, fib level touches)
Idea for people trading lower timeframes
I am long Ethereum

More Ethereum Thoughts ETHUSDLooking at the chart over and over again
Using Sine lines to plot the tops and bottoms
These lines also suggest June 2022 for Ethereum's bull run end as have many of my previous analyses
Can also be interpreted as phases of UP,DOWN,UP
20k is a long way away, but remember Bitcoin in 2017, these things do happen.
Personally the NFT space is a great pocket of peers to relate with for myself
20K would be nice.

Ethereum Deathcross and New TrendlineEthereum has performed a 50, 100MA Deathcross
Also a new trendline has established, if this is true this trendline and hodls, the price will skyrocket
I expect price to dip a bit below the trendline and recover (black circles)

ETHUSD 20K and Mosaic Using spirals we can predict future tops
In this case it points to 20k
Also included a mosaic using triangles

Spot the Triangle ETHUSDETHUSD is currently in a large falling wedge on the 4Hr chart
This will most likely break out to the upside
You can see how many rising wedges (supposedly bearish) break out to the upside on a low timeframe (4Hr)
More of an artistic piece than a forecast, but the falling wedge still hodls potential
I am long Ethereum
Check out charts below for sharper ideas

Daily Eth analysis: Strong move into resistance, is it enough???***Welcome crypto community, I do daily Bitcoin / Ethereum review here, please follow, like, provide your feedback. Also if you have other chart requests please let me know***
As we concluded in the last couple of posts, it's important for Eth to cross above ~2200 resistance area.
Chart and levels are pretty clear, Etherum showed a lot of strength going into resistance yesterday, but momentum has slowed down a bit since today morning, we shall see how daily closes today.
Of course, it is not advisable to long into the resistance area, if we get any drop towards the 2040 area, then that's an area we can long with some stop of 1950 area or a bit lower.
Happy Trading!
PS: This is not financial advice, DYOR. please position your trading size

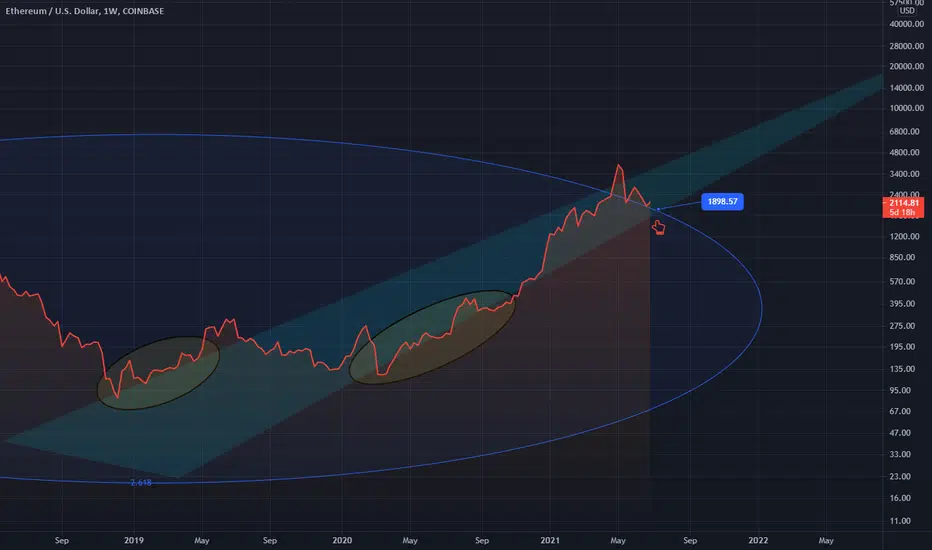
ETHUSD Where to expect the next move UPAn idea using a fib circle of the trend through the bear market
Shows price sitting just above 2.618
Price may float around ~1900, 2000 until early -> mid July
I hodl ETH
ETHUSD - Price Meets SupportStructurally price is finding old support at 1300-1700 zone. Look for W-harmonic pattern and breaks above any long-term resistance trends on RSI and Price.

Ethereum Scythe ETHUSDScythe usually (from past observations) lead to bullish continuation
If the lower band of the fib channel holds it will break out beautifully

Ethereum Price analysis. Daily closed below 200 moving averageeTHEREUM PRICE TODAY CLOSED BELOW 200 MA THAT IS A SIGN OF A VERY BEARISH SCENARIO.
I AM EXPECTING IT WILL HIT 1400 AREA SOONER THAT IS PREVIOUS ATH.
IF 1400 WILL NOT HOLD LONGER THEN WE CAN SEE SOME PRICE DROP AND FREE FALL OF ETHEREUM.
CURRENT SITUATION IS VERY BEARISH.
STAY SAFE
