ETHUSD 45-Min Chart — Counter-Trend Long From Demand After Major
Chart Analysis:
Market Structure:
Ethereum broke decisively below the 2,855 resistance zone, confirming a bearish structure shift. The move down was impulsive, followed by weak consolidation — classic distribution → continuation behavior.
Support / Demand Zone:
Price is reacting around 2,485–2,520, a highlighted demand area. This zone aligns with the first strong base formed after the sell-off, making it a high-interest reaction level.
Current Price Action:
ETH is printing long lower wicks into support, suggesting seller exhaustion and early dip-buying. However, structure is still bearish until a reclaim occurs.
Entry Logic:
The marked entry near ~2,490–2,510 assumes:
Support holds
A short-term higher low forms
Momentum flips on lower timeframes
Upside Targets:
TP1: ~2,690 (range equilibrium / liquidity grab)
TP2: ~2,740 (previous consolidation + minor resistance)
Final Target: ~2,855 major resistance (breakdown origin)
Invalidation:
A clean breakdown and close below 2,480 invalidates the long bias and opens continuation toward lower liquidity.
Bias Summary:
Trade Type: Counter-trend bounce
Risk Profile: Higher risk, higher R:R
Trend Context: Bearish until 2,855 is reclaimed
Ethereumforecast

Ethereum - Still a textbook chart!📌Ethereum ( CRYPTO:ETHUSD ) will first drop, then rally more:
🔎Analysis summary:
Over the course of the past couple of weeks, Ethereum has just been consolidating. But actually looking at the higher timeframe, Ethereum remains overall bullish. But first, we have to see another short term drop of about -20% back to the major support trendline.
📝Levels to watch:
$2,000
SwingTraderPhil
SwingTrading.Simplified. | Investing.Simplified. | #LONGTERMVISION

Coinranger|ETHUSDT. Potential reversal to 3137🔥News
🔹Fed rates at 22:00 UTC+3, FOMC press conference at 22:30 UTC+3. We can fly on this news.
🔹US earnings season is in full swing.
🔥 ETH
🔹A Bitcoin-like situation:
1️⃣ We took 3036. Above that, there are 3072 and 3137. Potential for now. This is a full set of upward waves.
2️⃣ 2950 below is the level for a move until evening. Below that: 2888, 2876, and 2768 - are a full set of downside waves.
I expect a flat between 3036 and 2950 before rate issue. After that, an upward movement is very likely.
---------------
Share your opinion in the comments!

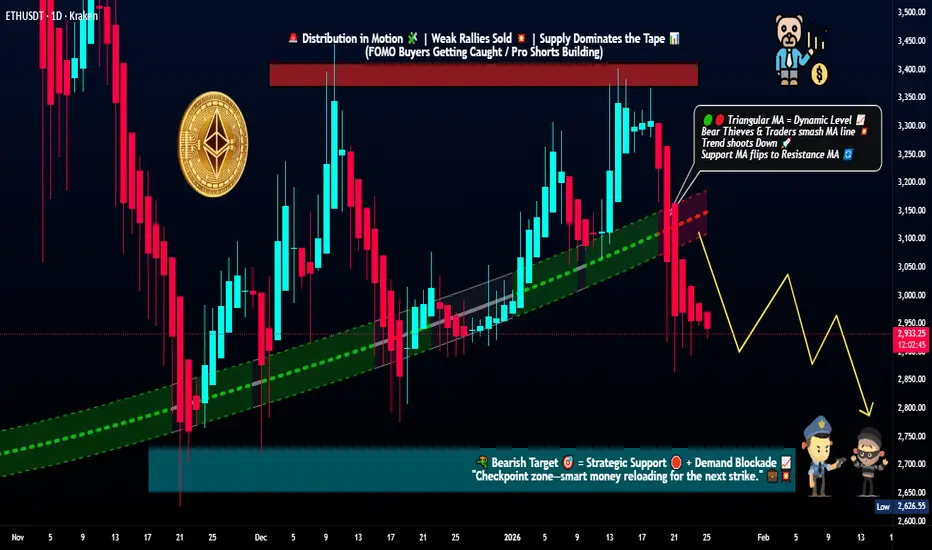
Ethereum Breaks Structure as Sellers Regain Control!🎯 ETH/USD: ETHEREUM vs TETHER - Crypto Market Profit Pathway Setup 💰
📊 Day/Swing Trade Opportunity | Bearish Momentum Confirmed ⚡
🔥 REAL-TIME MARKET DATA (January 25, 2026) 📈
Current ETH Price: $2,929 - $2,948 USD 💵
24H Volume: $8.1B - $25.89B (Extremely High Activity! 🚀)
Market Cap: $353.5B - $354.9B (#2 Crypto by Market Cap 👑)
24H Change: -0.06% to -3.07% (Bearish Pressure Building 🐻)
Market Rank: #2 Global Cryptocurrency 🥈
📉 TECHNICAL ANALYSIS & SETUP 🎨
🔴 Trade Plan: BEARISH CONFIRMATION
✅ Triangular Moving Average Breakout Confirmed
✅ Double-Top Pattern Formed at $4,000 Resistance (Major Reversal Signal! ⚠️)
✅ RSI Dropped Below 14-Week MA (Trend Reversal Confirmed 📉)
✅ Price Broke Below 100-Week EMA (5th Time Since 2022 - Historical Bearish Indicator! 🔻)
Chart Pattern: Symmetrical Triangle Breakdown + Structural Support Violation 📐
Momentum Indicators: Bearish divergence across multiple timeframes ⏱️
Bollinger Bands: Tight squeeze pattern (High Volatility Expected! 💥)
🎯 THIEF STRATEGY - LAYERED ENTRY EXECUTION 🏴☠️
💡 What is Thief Strategy?
Multiple Limit Orders (Layering Method) = Dollar-Cost Averaging into position across multiple price zones for optimal risk distribution! 🎲
🚨 RECOMMENDED SELL LIMIT LAYERS (Short Position):
Layer 1: 🔴 $3,150 (25% of Position Size)
Layer 2: 🟠 $3,100 (25% of Position Size)
Layer 3: 🟡 $3,050 (25% of Position Size)
Layer 4: 🟢 $3,000 (25% of Position Size)
Alternative Entry: Any current market price levels ($2,929 - $2,950 range) for aggressive traders 🎯
💎 Pro Tip: You can increase layer count based on your capital allocation and risk management strategy! Scale as you see fit, Thief OG's! 💪
🏆 PROFIT TARGET - "POLICE FORCE ZONE" 🚔
Primary Target: $2,700 🎯
Why This Level?
✅ Strong Historical Support Zone (Multiple bounces recorded 📊)
✅ Oversold Territory Expected (RSI < 30 anticipated 📉)
✅ Liquidity Trap Area (Institutional buyers likely positioned here 💰)
✅ Correlation with BTC Support Levels (Bitcoin dominance analysis confirms 🔗)
Potential Profit: ~8-15% from layered entries 💵
Risk-to-Reward Ratio: Approximately 1:2.5 to 1:3.5 📊
🛡️ RISK MANAGEMENT & STOP LOSS ⛔
Thief Stop Loss: $3,200 🚨
Invalidation Level: Price action above $3,200 negates bearish setup ❌
Risk Per Layer: Approximately 1.5-5% depending on entry point 📊
⚠️ IMPORTANT DISCLAIMER - READ CAREFULLY! 📢
Dear Ladies & Gentlemen (Thief OG's): 👋
I am NOT recommending you set only my TP/SL levels blindly! This is YOUR trade, YOUR capital, YOUR decision. 💯
You can make money, then TAKE MONEY at your own risk and comfort level! 🎰
Partial profits at $2,900? ✅ Your choice!
Exit at $2,850? ✅ Your prerogative!
Hold to $2,700 or beyond? ✅ Your strategy!
Risk Management is KING! 👑 Always trade with stop losses and position sizing! 📏
💱 RELATED PAIRS TO WATCH 👀
Correlated Assets for Multi-Pair Analysis:
BTC/USD (Bitcoin) 💰
Current: ~$89,100 - $93,700
Correlation: HIGH (BTC leads, ETH follows with amplified moves 📈📉)
Strategy: Watch BTC breaks below $88,000 support = ETH acceleration lower! ⚡
ETH/BTC (Ethereum vs Bitcoin Ratio) 🔄
Current: ~0.0346 BTC
Correlation: INVERSE strength indicator
Strategy: Weakening ratio confirms ETH underperformance 📉
SOL/USD (Solana) 🌟
Current: ~$137.45
Correlation: MEDIUM-HIGH (L1 blockchain competitor)
Strategy: Monitor for rotation signals from ETH to SOL 🔄
LINK/USD (Chainlink) 🔗
Correlation: MEDIUM (Ethereum ecosystem dependent)
Strategy: LINK weakness confirms ETH bearish momentum 📊
MATIC/USD (Polygon) 🟣
Correlation: HIGH (L2 scaling solution for Ethereum)
Strategy: Polygon decline = ETH infrastructure stress 🚨
AAVE/USD & UNI/USD (DeFi Leaders) 🏦
Correlation: HIGH (Ethereum DeFi ecosystem health)
Strategy: DeFi token weakness = ETH selling pressure ⚠️
Key Insight: Monitor these pairs for confirmation signals! When multiple correlated assets move together = HIGHER PROBABILITY SETUP! 🎯
🌍 FUNDAMENTAL & ECONOMIC FACTORS 📰
🔴 BEARISH CATALYSTS (Current Market Environment):
1. FEDERAL RESERVE POLICY UNCERTAINTY 🏦
❌ Interest Rates Held at 3.5%-3.75% (No immediate cuts expected! 🚫)
❌ Inflation Remains Above 2% Target (Wholesale prices +3%, Core CPI at 2.6% 📈)
❌ Jerome Powell's Tenure Ends May 2026 (Transition uncertainty ahead! ⚠️)
⚡ Impact: Risk assets under pressure as "higher for longer" narrative persists 📉
2. CRYPTO MARKET SENTIMENT - EXTREME FEAR 😨
📊 Fear & Greed Index: 24 (EXTREME FEAR ZONE!) 🔴
📊 BTC Dominance Rising: 59.8% (Capital fleeing altcoins including ETH! 🏃♂️)
📊 ETF Outflows Accelerating:
BTC ETFs: -$483M outflows (January 20) 💸
ETH ETFs: -$229M outflows (Breaking 2-month green streak!) 😱
3. GEOPOLITICAL TENSIONS & TARIFF CONCERNS 🌐
⚠️ US-Europe Tensions Escalating (Greenland disputes creating risk-off environment 🗺️)
⚠️ Tariff Threats on China (100% tariff increases = market instability! 💥)
⚡ Impact: "Crypto acts like ATM during uncertain times" - Recent 6.6% BTC drop confirms 📉
4. TECHNICAL BREAKDOWN SIGNALS 📉
🔻 Double-Top Pattern at $4,000 (Classic reversal formation! ⚠️)
🔻 $648M ETH Derivatives Liquidated (234,227 trader positions wiped! 💀)
🔻 Price Below $3,200 Key Support (January 19 breakdown confirmed 🚨)
🔻 25-Delta Skew Deterioration (Traders paying premium for downside protection! 🛡️)
🟢 POTENTIAL BULLISH CATALYSTS (Medium-Term, Post $2,700):
1. INSTITUTIONAL ACCUMULATION SIGNALS 💼
✅ Morgan Stanley ETH ETF Filing ($1.8T AUM entering market! 🏦)
✅ BitMine Aggressive Buying: 278,551 ETH purchased (30 days) = $13B+ total holdings 💰
✅ Stablecoin Growth: $300B supply, $1.1T monthly transactions (ETH ecosystem benefit! 📈)
2. ETHEREUM ECOSYSTEM DEVELOPMENTS 🛠️
✅ Pectra Upgrade Success (Improved scalability, lower gas fees ⚡)
✅ Upcoming: Glamsterdam & Hegota Upgrades (2026 implementation planned 🚀)
✅ DeFi Dominance: 68% Market Share ($68B TVL - Aave & Lido leading 👑)
✅ Layer-2 Scaling: Base & Arbitrum efficiency improvements 🔧
3. REGULATORY CLARITY POTENTIAL 📜
✅ CLARITY Act Progress (Could pass Senate in 2026 🏛️)
✅ Trump Administration Crypto-Friendly Stance (Despite current tariff concerns 🤝)
✅ Institutional Framework Development (Traditional finance integration advancing 🏦)
4. FUTURE FED POLICY EASING 📊
✅ 2+ Rate Cuts Expected 2026 (Mark Zandi, Moody's Analytics forecast 📉)
✅ Potential New Fed Chair (Kevin Hassett): "Cheaper car loans, easier mortgages" rhetoric 💰
✅ Historical Pattern: Past cycles peaked during rate hikes; current environment = rate cuts! 📈
🎲 UPCOMING ECONOMIC EVENTS TO MONITOR 📅
Critical Data Releases (Next 30 Days):
January 29, 2026: FOMC Meeting Decision 🏦
Impact: HIGH ⚡⚡⚡
Watch for: Rate guidance, Powell's press conference tone 🎤
February 2026: ISM Manufacturing PMI 📊
Impact: MEDIUM ⚡⚡
Watch for: <50 = economic slowdown = potential risk asset pressure 📉
February 2026: Monthly Jobs Report 💼
Impact: HIGH ⚡⚡⚡
Watch for: Weak job creation = Fed dovish pivot potential 🕊️
Q1 2026: Fed Chair Transition Announcements 🔄
Impact: HIGH ⚡⚡⚡
Watch for: Kevin Hassett confirmation = dovish policy expectations 📈
Ongoing: Trump Tariff Policy Updates 🌐
Impact: VERY HIGH ⚡⚡⚡⚡
Watch for: Escalation = risk-off / De-escalation = risk-on 🎢
📊 VOLUME & LIQUIDITY ANALYSIS 💧
24H Trading Volume: $3.8B - $25.89B (MASSIVE volume spike indicates institutional activity! 🐋)
Open Interest Changes: Declining futures OI = reduced speculative positioning 📉
Exchange Flows: Net outflows from exchanges = potential supply squeeze (bullish for reversal) 🔄
Whale Activity Alert: 🐋
Large liquidations observed ($648M derivatives wiped)
Smart money appears to be accumulating near support zones
Watch for $2,700-$2,750 zone for reversal signals! 👀
🎯 TRADE EXECUTION CHECKLIST ✅
Before Entering This Trade:
✅ Confirm your risk tolerance (Max 2-5% account risk recommended!)
✅ Set ALL limit orders if using layered strategy
✅ Place stop loss at $3,200 (or adjusted to your risk parameters)
✅ Monitor BTC/USD correlation (BTC leads the market!)
✅ Check upcoming FOMC announcements (Calendar marked?)
✅ Review your position size (Never over-leverage, Thief OG's! 🚫)
✅ Have profit-taking plan ready (Partial exits at multiple levels?)
✅ Confirm exchange liquidity for your order sizes
✅ Set price alerts at key levels ($3,000, $2,900, $2,700)
✅ Mentally prepare for volatility (Crypto never sleeps! 🎢)
🔥 FINAL THOUGHTS - THE THIEF OG PHILOSOPHY 🏴☠️
Trading is 90% Risk Management, 10% Entry Timing! 💯
This setup presents a HIGH-PROBABILITY bearish scenario based on:
✅ Technical breakdown patterns
✅ Macro economic headwinds
✅ Market sentiment extremes
✅ Historical correlation data
✅ Real-time volume analysis
BUT REMEMBER: 🧠
Markets can remain irrational longer than you can remain solvent!
Unexpected news can flip the script instantly!
ALWAYS protect your capital with stop losses!
NEVER trade with money you can't afford to lose!
Take profits when you have them - "Pigs get slaughtered" 🐷
💬 COMMUNITY ENGAGEMENT 🤝
Like this idea? Smash that 👍 button!
Disagree? Drop your counter-analysis in comments! 💬
Following this trade? Update us on your results! 📊
Let's make money together, Thief OG's! 💰🎯🔥
🏴☠️ Trade Smart. Trade Safe. Trade Like A Thief OG! 🏴☠️
#ETHUSD #Ethereum #CryptoTrading #TechnicalAnalysis #BearishSetup #DayTrading #SwingTrading #ThiefStrategy #TradingView #CryptoAnalysis #RiskManagement #FOMC #FederalReserve #DeFi #Layer1 #SmartContracts #Blockchain #TradingIdeas #ChartPatterns #PriceAction 🚀📊
ETH - Does THIS FRACTAL Look Familiar ??Hello Fellow Traders
So on this chart, we see some very interesting developments. What we see is Ethereum making a parabolic increase during the bullish cycle, which lasts approximately the same amount of time, which is roughly around 4 - 5 months.
We then see the start of a correction as soon as the parabolic curve is lost and the first three impulse waves down is characterized by the second point, (point B) being almost as high as the all-time high. And then the price further corrects to C, which is minus 40 - 50% of the total price.
After which we then see a period of range trading almost characteristically seeing higher lows again and again. We do not see higher highs. We then see another impulse wave up over 2-3 months, marked by a 30% increase (upside correction):
The price will likely spike, and then fall to lower lows as it did with the previous fractal, Where -60% puts us as $1600:

Ethereum Builds Strength: Day Trading Blueprint🔥 ETH/USD — Ethereum Day-Trade Breakout Blueprint 🚀 | Bullish Momentum Setup 🔍
📌 Asset: ETH/USD — Ethereum vs U.S. Dollar
📈 Market Type: Crypto | DAY TRADE Blueprint
📖 Trade Plan — Bullish Breakout Structure
ETH is building strong upward momentum with clean higher-lows and tightening price compression. Buyers are stepping in across major crypto pairs, signaling strength in the broader market cycle.
🎯 Entry
Any price-level breakout entry depending on your execution style.
🛑 Stop Loss (Risk Management First)
This is Thief SL → @ 2760
Dear Ladies & Gentlemen (Thief OG’s), adjust your SL based on your OWN strategy and risk.
⚠️ I'm NOT recommending to use ONLY my SL — your money, your rules, your risk tolerance.
🏆 Target
Moving Average is acting as strong resistance + market is entering overbought zones + potential trap formation for late buyers.
Our TP Zone → @ 3000
⚠️ Dear Ladies & Gentlemen (Thief OG’s), TP is your personal choice.
You can take profits the way YOU manage risk.
🔗 Related Pairs to Watch (Correlation Radar)
Watching correlated pairs gives confirmation + early signals of ETH strength or weakness.
1️⃣ BTC/USD (Bitcoin) — King Maker
ETH usually follows BTC’s momentum.
If BTC shows bullish continuation + strong volume → ETH breakout becomes HIGHER probability.
If BTC stalls or rejects → ETH breakouts often fail or become fakeouts.
2️⃣ ETH/BTC — Relative Strength Pair
A rising ETH/BTC = Ethereum outperforming Bitcoin.
A falling ETH/BTC = ETH lagging → Breakouts weaken.
Key Significance: Shows where smart money is rotating.
3️⃣ NASDAQ 100 / US Tech Index ( NASDAQ:NDX / NASDAQ:QQQ )
ETH has high correlation with risk-on tech sentiment.
If US tech rallies → Crypto liquidity flows → ETH bullish pressure increases.
If tech sells off → Crypto often follows.
4️⃣ DXY — U.S. Dollar Index ( TVC:DXY )
Weak USD → Crypto strengthens (inverse correlation).
Strong USD → Crypto cooling or correcting.
Watching DXY helps understand global risk appetite.
5️⃣ SOL/USD, AVAX/USD, MATIC/USD — Layer-1 Competitive Coins
High performance in these alt L1s often triggers rotation flows into ETH.
When these pump together → ETH usually follows with momentum.
📊 Why These Correlations Matter
Crypto → Highly interconnected; no asset moves alone.
BTC controls trend direction.
TradFi indices & USD influence liquidity conditions.
ETH/BTC shows smart-money rotation.
Alt-L1s show risk appetite in the broader ecosystem.
Tracking these pairs = fewer fake breakouts + stronger conviction.

Ethereum — Stronger Signal Than BTC
BBG:ETHEREUM has printed a stronger signal than CRYPTOCAP:BTC , sooner than I expected. On top of that, $ETH/BTC is holding its ground, which is exactly what you want to see if ETH is gearing up for relative outperformance.
Will ETH outperform BTC over the next couple of months?
Chart-wise, it looks like it could, but this is something we need to track continuously to avoid losing sats if the setup fails.
For now, the signal is there — and **we act on signals, not opinions**. If you haven’t positioned yet, this is the moment where ETH deserves attention.
If structure continues to hold and momentum follows through, a new ATH is absolutely on the table.

ETH/USDT Bullish Continuation Setup With MA Confluence🚀 ETH/USDT BULLISH PROFIT PATHWAY
Ethereum vs Tether | Day / Swing Trade Setup
📌 MARKET OVERVIEW
🔹 Asset: ETH/USDT
🔹 Market Type: Crypto
🔹 Trade Style: Day / Swing
🔹 Bias: BULLISH 📈
Ethereum is showing strong bullish continuation behavior after a healthy pullback, indicating smart money accumulation rather than distribution.
🧠 TRADE PLAN – WHY THIS SETUP WORKS:
✅ Bullish confirmation achieved with:
🔁 786 Hull Moving Average pullback → trend respect by buyers
🚀 386 Triangular Moving Average breakout → momentum shift in favor of bulls
🧲 Price holding above dynamic support → dip buyers active
📊 This structure suggests trend continuation, not exhaustion.
🎯 ENTRY STRATEGY – THIEF LAYERING METHOD
💡 Thief never chases — Thief stacks positions 🥷
🔹 Entry Style: Layered limit entries (cost-averaging with control)
🔹 Execution: Buy ANY price level using layers
📍 Suggested Buy Layers:
• 2950
• 3000
• 3050
• 3100
⚠️ Increase or reduce layers based on:
Risk tolerance
Timeframe
Volatility conditions
🧠 Why layering works:
It reduces emotional entries, improves average price, and lets thieves profit from volatility traps.
🛑 STOP LOSS – CAPITAL PROTECTION
🚨 Thief SL Zone: 2900
⚠️ Important Note for OGs:
This SL is a reference, not an instruction.
Adjust SL based on:
Your position size
Timeframe
Account risk rules
💬 Risk management keeps thieves alive longer than predictions.
🎯 TARGET & EXIT STRATEGY
🎯 Primary Target: 3400
🚓 Why 3400 is critical:
Strong resistance zone
Overbought conditions likely
Profit-booking + trap area
Correlated rejection risk
💰 Smart Exit Idea:
Scale profits instead of waiting for one magic number:
• Partial TP near resistance
• Trail stop after momentum slows
📌 Thieves escape with profits — not with hope.
🔄 RELATED PAIRS TO WATCH (CORRELATION CHECK)
📊 These pairs help confirm or invalidate ETH strength:
🔹 BTC/USDT – Market leader
• BTC strength = ETH momentum confirmation
• BTC weakness = caution on ETH longs
🔹 ETH/BTC – Alt strength meter
• Rising ETH/BTC = alt season behavior
• Falling ETH/BTC = BTC dominance risk
🔹 SOL/USDT & AVAX/USDT
• If these lead → risk-on sentiment
• If they stall → reduce aggression
🧠 Correlation helps thieves filter fake breakouts.
🌍 FUNDAMENTAL & MACRO CONTEXT
📌 Current Market Drivers:
• Ethereum supply dynamics tightening due to staking
• Network upgrades supporting long-term demand
• ETF & institutional attention influencing volatility
• Macro risk sentiment impacting crypto flows
📆 Upcoming Considerations:
• Sudden news = volatility spikes
• Macro data releases can shake leverage
• Always expect fake moves before real expansion
⚠️ News doesn’t create trends — it accelerates them.
🧩 KEY LEVELS SUMMARY
📍 Support Zones: 2950 – 3000
📍 Bull Control Zone: Above 3050
📍 Resistance / Exit Zone: 3280 – 3400
📍 Psychological Levels: 3000 & 3400
FINAL THIEF MESSAGE
💬 Dear Ladies & Gentlemen (Thief OGs),
This plan is a framework, not financial advice.
You control:
Entry size
Stop loss
Profit taking
💰 Make money → protect capital → escape clean.
👇 Drop your bias in comments:
Bullish continuation or trap near 3400?
Let’s see who escapes with loot 🥷🔥

Ethereum - The bearmarket is not over yet!🪚Ethereum ( CRYPTO:ETHUSD ) can still drop about -30%:
🔎Analysis summary:
Over the past four years, Ethereum has been creating a major bullish triangle. With the recent all time high retest, we are now seeing an expected reversal. But considering the bullish nature of this triangle, Ethereum will head higher after a retest of the next support.
📝Levels to watch:
$2,000
SwingTraderPhil
SwingTrading.Simplified. | Investing.Simplified. | #LONGTERMVISION

Ethereum $ETH weekly demand level at $2,879 is holdingEthereum CRYPTOCAP:ETH weekly demand level at $2,879 is holding as expected for now. There are signs of new bullish impulses in the smaller timeframes. Let's see if ETH cryptocurrency wants to rally higher from this demand level.

Bearish | ETHUSD | Ethereum COINBASE:ETHUSD
ETHUSD Weekly – Pullback Risks After Strong Rally
Trend Structure
Ethereum printed a Higher High near 4,800 after an aggressive rally.
The uptrend remains intact with a Higher Low base around 2,000, but short-term momentum is cooling.
Current weekly candles show rejection near the highs with potential for retracement.
EMA Context
Price is extended above the 9 and 35 EMAs, suggesting overbought conditions.
First dynamic supports sit around 3,470–3,350 (9 EMA zone + prior structure).
The 100 EMA around 2,600–2,700 is a deeper corrective target if selling intensifies.
Key Levels + Volume Profile
TP1: 3,354 – major support, aligns with HVN and prior breakout zone.
TP2: 2,960 – mid-volume shelf and structural pivot.
TP3: 2,627–2,708 – strong support cluster with HVN and EMA confluence.
Below 2,600, demand zones extend toward 2,000–1,800.
Targets
TP1: 3,354
TP2: 2,960
TP3: 2,627
Invalidation
A close back above 4,600 would negate the bearish retracement thesis and open continuation toward new highs.
Bias
Near-term bearish/retracement, expecting ETH to test 3,354 and potentially 2,960–2,627 if weakness persists.
Broader structure remains bullish unless 2,000 is lost.

Will Ethereum’s Market Flow Signal a New Bullish Phase?🎯 ETH/USD: The "Thief Strategy" Blueprint | Layer Your Way to Victory! 💰
📊 Market Overview
Asset: ETH/USD (Ethereum vs US Dollar)
Market: Crypto
Trade Type: Swing Trade
Bias: Bullish (Post-Breakout Setup)
🎭 The Thief's Master Plan
Ladies and gentlemen, gather 'round! 🎩 We're not just trading here—we're executing the legendary "Thief Strategy" where we sneak into multiple price levels like a professional heist crew. No single entry point for us, oh no. We layer up, diversify risk, and wait for the vault to open! 💎
🚀 Entry Strategy: The Layering Technique
Primary Entry Zone: Any price level AFTER a confirmed breakout above $4,200 ✅
The Thief's Layering Method (Multiple Limit Orders):
🥇 Layer 1: $3,900
🥈 Layer 2: $4,000
🥉 Layer 3: $4,100
🏆 Layer 4: $4,200
Pro Tip: Feel free to add more layers based on your capital allocation and risk appetite. The more layers, the smoother your average entry price! Think of it as building a ladder to success.
🛑 Stop Loss: Protect Your Treasure
Thief's Stop Loss: $3,700 🚨
⚠️ Important Disclaimer:
Dear Ladies & Gentlemen (Thief OG's), I'm NOT recommending you blindly follow my stop loss. This is MY risk tolerance. You need to assess YOUR own risk management strategy. Set your stop loss according to your capital size, risk appetite, and sleep-at-night comfort level. Remember: Your money, your rules! 💼
🎯 Take Profit Target: Know When to Exit the Heist
Primary Target: $4,600 🎰
Why This Level?
📈 Moving Average acting as a strong resistance zone (think of it as the police barricade!)
🔴 Overbought conditions on technical indicators
⚠️ Bull trap zone — smart money might be waiting to distribute here
Exit Strategy:
When you see the moving average resistance + overbought signals flashing, it's time to take your profits and vanish into the night! 🌙
⚠️ Important Disclaimer:
Dear Ladies & Gentlemen (Thief OG's), I'm NOT recommending you blindly follow my take profit level. This is MY analysis. Scale out profits at levels that make sense for YOUR trading plan. Partial profits, trailing stops, whatever works for YOU. Make money, then TAKE money—at your own discretion! 💵
🔗 Related Pairs to Watch
Keep an eye on these correlated assets to confirm the broader market direction:
BITSTAMP: BITSTAMP:BTCUSD — The king of crypto. When Bitcoin moves, ETH usually follows. Watch for BTC breakouts above resistance.
BINANCE: BINANCE:ETHBTC — Shows ETH's relative strength against Bitcoin. Rising = ETH outperformance.
TVC: TVC:DXY (US Dollar Index) — Inverse correlation. Weaker dollar = stronger crypto typically.
Total Crypto Market Cap — Confirms if capital is flowing INTO or OUT OF the crypto space.
COINBASE: COINBASE:SOLUSD , COINBASE: COINBASE:ADAUSD — Other major altcoins. If they're pumping too, it confirms alt season momentum.
Key Correlation Point: If Bitcoin is breaking resistance zones and the Dollar Index (DXY) is weakening, our ETH setup gets significantly stronger! 📊✨
🧠 Technical Analysis Breakdown
What We're Watching:
✅ Breakout Confirmation: Price must close above $4,200 with volume
✅ Support Levels: $3,900-$4,100 range acts as accumulation zone
✅ Resistance Zone: $4,600 where moving averages + overbought conditions converge
✅ Risk-Reward Ratio: Solid setup with layered entries minimizing average cost basis
The Thief Strategy Philosophy:
Instead of gambling on ONE entry point, we spread our risk across multiple price levels. This way, we're dollar-cost-averaging into the position BEFORE the breakout confirmation, positioning ourselves ahead of the crowd! 🎯
🎬 Final Words from the Thief
Remember, OG's: The best trades are the ones where you're positioned BEFORE the crowd rushes in. Layer your entries, manage your risk like a professional, and know when to take your profits and disappear! 👻
Stay disciplined, stay profitable, and let's make this heist a success! 🏆
✨ If you find value in my analysis, a 👍 and 🚀 boost is much appreciated — it helps me share more setups with the community!
#ETHUSD #Ethereum #CryptoTrading #SwingTrade #ThiefStrategy #LayeringStrategy #CryptoAnalysis #TechnicalAnalysis #TradingView #CryptoSetup #AltcoinSeason #ETHBreakout #RiskManagement #TradingStrategy #CryptoIdeas

Can Ethereum’s Capital Flow Blueprint Target 4600 Next?🎯 ETH/USD "The Liquidity Thief" Strategy 💰
Weighted MA Pullback + Manipulation Grab Blueprint
📊 TRADE SETUP OVERVIEW
Asset: ETH/USD (Ethereum vs USD) | Timeframe: Swing Trade
Market Structure: Bullish Confirmation with WMA Pullback Recovery
Strategy Type: Multi-Layer Accumulation (Thief-Style Entry Method)
🎪 THE GAMEPLAN
Bias: 🟢 BULLISH — Confirmed via:
Weighted Moving Average (WMA) acting as dynamic support
Liquidity pool identification on pullback zones
Institutional accumulation patterns detected
This setup thrives on pullback retracements where smart money accumulates before the next leg up. We're essentially "stealing" liquidity at discount prices during these inefficiency windows.
🚀 MULTI-LAYER ENTRY STRATEGY (The Thief Approach)
Instead of FOMO market orders, we deploy calculated limit order layers at strategic support zones:
Entry Levels (Layer-by-Layer Accumulation):
Layer 1: $3,700 USD
Layer 2: $3,800 USD
Layer 3: $3,900 USD
(Pro Tip: Scale these layers based on your risk tolerance and account size. Tighter layers = more fills; wider layers = better average price)
Position Building: Fill partial positions at each layer, building your total exposure gradually. This reduces average entry cost and maximizes probability of initial profit.
🛑 STOP LOSS (Risk Management)
Hard Stop: $3,500 USD
⚠️ Important Disclaimer: This is YOUR trading decision. No strategy guarantees profits. Position sizing and risk management are YOUR responsibility. Never risk capital you can't afford to lose.
🎯 TARGET & EXIT STRATEGY
Primary Target: $4,600 USD
Exit Rationale:
Strong resistance zone confluence
RSI/Stochastic overbought divergence
Liquidity trap zone (potential reversal catalyst)
💡 Golden Rule: Lock in profits at $4,600 or take partial profits at resistance. Never hold through key resistance on swing trades—greed kills thief traders.
⚠️ Disclosure: Risk management and profit targets are trader-dependent. Adjust based on your strategy framework, market conditions, and account allocation.
📈 CORRELATED PAIRS TO WATCH
Monitor these assets for confluence signals and capital flow indicators:
BITSTAMP:BTCUSD (✅ High Positive Correlation) — Bitcoin sets market sentiment; ETH typically follows in lockstep. When BTC rallies, altcoins like ETH amplify the move upward.
BINANCE:ETHBTC (⚖️ Relative Strength) — ETH strength against BTC equals altseason confirmation. Rising ETHBTC ratio means Ethereum is outperforming Bitcoin—bullish for our setup.
$SPY/ IG:NASDAQ (📊 Risk Appetite) — Traditional equity weakness creates crypto pullback risk. If stocks dump, crypto usually follows. Monitor US market opens for confirmation signals.
TVC:DXY (Dollar Index) (⚖️ Inverse Correlation) — Strong dollar = crypto headwind; weak dollar = tailwind for ETH. A declining DXY supports crypto rally scenarios.
COINBASE:USDTUSD (🔒 Stablecoin Flow) — USDT accumulation signals capital waiting for entry. Rising USDT on exchanges = dry powder ready to deploy into altcoins like ETH.
Capital Flow Blueprint: When BTC holds above support AND USDT shows inflow, altcoins like ETH enter "hunter mode."
🔑 KEY TRADING PRINCIPLES (Thief OG Edition)
✨ Patience — Wait for pullback confirmation before layering in
✨ Position Sizing — Risk only 1-2% per trade; 3% absolute maximum
✨ Confluence — Entry + Support + Volume + Correlation = Green Light
✨ Discipline — Exit at target or stop loss; no emotional HODL mode
✨ Adaptation — Markets evolve; update bias if structure breaks
If you find value in my analysis, a 👍 and 🚀 boost is much appreciated — it helps me share more setups with the community!
#ETH #ETHUSD #Ethereum #CryptoTrading #TechnicalAnalysis #SwingTrading #CryptoDCA #TradingStrategy #LayerEntry #LiquidityZones #AltSeason #CryptoAnalysis #TradeSetup #RiskManagement #Thief #CommunityDriven

ETHUSD Momentum Building! MA Breakout Keeps Bulls in Control📘 **ETHUSD “Ethereum vs U.S. Dollar”
Crypto Market Opportunity Blueprint (DAY Trade)**
🚀 Plan Overview
A bullish continuation scenario is active following a clear Moving Average breakout and clean retest. This structure builds a favorable environment for controlled entries backed by momentum confirmation.
🎯 Entry
👉 You can enter at any price level once your personal confirmation aligns with the ongoing MA structure.
The breakout + retest provides the core framework.
🛡️ Stop Loss Strategy
📍 This is the Thief SL @ 3050 Dear Ladies & Gentleman (Thief OG’s)
Adjust your Stop Loss based on your own strategy, risk tolerance, and trade model.
⚠️ Place the SL only after the MA breakout confirmation, not before.
📝 Note:
Dear Ladies & Gentleman (Thief OG's) I am not recommending that you use only my SL. It’s your own choice; you can make money then take money at your own risk.
🎯 Target
The SuperTrend ATR line is acting as a strong resistance, and current conditions suggest:
📈 Overbought signals building
Trap zones developing
📌 Smart exit required
👉 Our target: 3600
📝 Note:
Dear Ladies & Gentleman (Thief OG’s) I am not recommending that you set only my TP. It’s your own choice; you can make money then take money at your own risk.
🔍 Related Pairs to Watch (Correlation & Key Notes)
1. BITSTAMP:BTCUSD (Bitcoin vs USD)
ETHBTC correlation remains high during MA-driven moves.
BTC’s trend strength often dictates crypto-wide volatility.
Strong BTC breakout boosts ETH’s bullish follow-through potential.
2. BINANCE:ETHBTC (Ethereum vs Bitcoin)
Great pair to measure Ethereum’s relative strength.
Rising ETHBTC = ETH outperforming BTC → supports the bullish ETHUSD narrative.
Useful for detecting early reversals before USD-pairs show it.
3. CRYPTOCAP:TOTAL2 (Altcoin Market Cap)
Represents overall altcoin strength excluding BTC.
If TOTAL2 breaks resistance with volume, ETH usually moves aggressively.
Helps confirm whether the market supports a broad-based ETH rally.
4. COINBASE:SOLUSD (Solana vs USD)
Competes for capital rotation with ETH.
When SOL pumps aggressively, ETH sometimes lags before catching momentum.
Watching SOL gives early hints of altcoin capital flow.
5. TVC:DXY (US Dollar Index)
Inverse correlation with major crypto assets.
Weak DXY = supportive environment for ETHUSD upside.
Strong DXY = caution for crypto longs.

Ethereum crypto strong demand at $2,880 playing outEthereum tapped a major demand zone at $2,880, and the reaction is clear: buyers stepped in, just like they usually do when a clean, fresh imbalance takes control. The last time ETH reacted to a similar structure on the bigger timeframes, we saw extended bullish legs unfolding week after week.
Right now, the question is simple:
Will this demand level hold long enough to push ETH toward $4,120 and beyond?
Based on the current imbalance structure, the answer leans strongly toward yes.

ETH/USDT Bearish Roadmap: Structure + MA Break AligningAsset: ETH/USDT — “Ethereum vs Tether”
Market Context: Crypto Market | Swing Trade | Bearish Profit Pathway Setup
📉 Market Outlook: Bearish Plan Confirmed
Ethereum is displaying a bearish continuation structure, with price breaking below the Triangular Moving Average zone, signaling shifting momentum from buyers to sellers. Market structure is weakening, liquidity is building above the recent highs, and major supports remain untested below.
This creates a clean swing-trade opportunity for disciplined traders.
🎯 Trade Plan: Thief Layered Entry Strategy
The plan uses a layered sell-limit approach to capture premium retracement entries.
🧩 Sell-Limit Layers (Short Entry Zones):
1st Layer: 3200
2nd Layer: 3100
3rd Layer: 3000
(Traders may add additional layers depending on preference, liquidity, and volatility.)
Layering helps reduce emotional entry pressure and allows scaling into premium short zones rather than rushing into the move.
🛑 Stop-Loss: Structural SL @ 3300
This is the Thief SL reference level at 3300, positioned above structural liquidity.
Ladies & Gentlemen (Thief OG’s): adjust SL according to your own risk tolerance, capital, and strategy framework.
Risk is personal — protect your account.
🏆 Target Zone: 2700
The downside objective aligns with:
Strong support retest
Oversold region confluence
Trap-pattern breakdown
Correlation pressures across major crypto pairs
Ladies & Gentlemen (Thief OG’s): this is a community target reference — take profit based on your own comfort and risk appetite. Profit is profit.
🔍 Related Pairs to Watch (Correlation Insights)
1️⃣ BTC/USDT ( CRYPTOCAP:BTC )
Bitcoin leads crypto directional momentum.
ETH generally mirrors BTC swings with slightly slower volatility.
If BTC struggles to reclaim resistance zones, ETH downside probability strengthens.
2️⃣ ETH/BTC ( BINANCE:ETHBTC )
Key ratio indicating Ethereum’s strength vs Bitcoin.
ETHBTC downtrend continues → ETHUSD bearish continuation becomes more reliable.
3️⃣ SOL/USDT ( CRYPTOCAP:SOL )
Strong competitor in Layer-1 ecosystem.
SOL weakness often reflects broader market appetite decreasing → ETH follows.
4️⃣ TOTAL2 (Altcoin Market Cap)
Tracks overall strength of altcoins excluding BTC.
Breakdown in TOTAL2 = bearish environment = supports ETH downside targets.
Monitoring these pairs provides confirmation of:
Trend alignment
Market-wide weakness
Strength of bearish momentum
Liquidity flows across majors
✅ Final Notes
This setup is built for traders who prefer structured entries, disciplined layers, clear SL zones, and realistic targets.
Trade smart, manage risk, and follow your own strategy refinement.

Ethereum Range Analysis – First Breakout Will Be Fake Confirmed📌 Chart Overview
This ETH/USDT 30-minute chart shows a consolidation phase after a strong drop. Price is moving inside a clear sideways range, building liquidity on both sides. The idea on the chart focuses on waiting for a fake breakout (liquidity sweep) before the true move begins.
📍 Market Structure
Price is trapped between a defined upper resistance and lower support. Multiple touches on both sides show that buyers and sellers are accumulating orders. This creates equal highs and equal lows, which is where liquidity naturally forms.
The chart highlights that the market is not ready for a clean breakout yet. Instead, it is preparing to trap traders on one side.
📍 Upper Liquidity Zone
The resistance line above the range is a major level. Price has rejected it many times, which means:
breakout traders will try to buy above it
stop-losses of short positions are sitting there
smart-money will aim to grab liquidity above it
A breakout above this level is expected to be fake first, meaning price may spike above but quickly reverse downward.
📍 Lower Liquidity Zone
The support line under the range is equally important. Several wick rejections show buyers defending this level, which means:
long stop-losses are below
sell-side liquidity is growing
institutions may “run the lows” before pushing up
A drop below this support is also expected to be fake, followed by a reversal upward.
📍 Fake Move Logic
The chart’s message “Need Any Side First Move Fake” means:
Do not trust the first breakout
The market will likely sweep liquidity on one side
The real direction usually comes opposite to the first breakout
This is a classic Smart Money / Liquidity Grab pattern.
📍 Scenario: Fake Break Up → Real Drop
If price breaks above resistance:
breakout buyers enter
liquidity is taken
price rejects the top
strong downward move begins
This is a buy-side liquidity sweep leading to a bearish move.
📍 Scenario: Fake Break Down → Real Pump
If price breaks below support:
longs get liquidated
liquidity collected
price reverses and pushes upward
This is a sell-side liquidity sweep leading to a bullish move.

Ethereum - Another -30% correction!🥊Ethereum ( CRYPTO:ETHUSD ) continues the bearmarket:
🔎Analysis summary:
Just over the past couple of weeks, Ethereum has already been correcting about -40%. This happened due to another failed all time high breakout sending prices lower. And Ethereum can drop another -30% before it will then retest a major confluence of support.
📝Levels to watch:
$2,500 and $ 2,000
SwingTraderPhil
SwingTrading.Simplified. | Investing.Simplified. | #LONGTERMVISION

Ethereum Price Prediction: Can New Holders Fill the LTH Gap?Ethereum is trading at $2,805 at the time of writing, reflecting a 6% daily decline. The asset is sitting just below the $2,814 resistance level after its latest failed attempt to break through $3,000.
Based on current sentiment and market structure, ETH could stabilize and attempt a rebound, but a strong recovery will require consistent investor support. In the near term, Ethereum will likely fluctuate between $2,814 and $3,000 as it searches for direction.
If bullish momentum strengthens and fresh demand remains steady, Ethereum could finally break above the $3,000 barrier. A successful breach would pave the way for a move toward $3,131 and potentially $3,287, invalidating the short-term bearish thesis.

ETHEREUM HIGH PROBABILITY LONG SETUP SOON!!!🚨 ETHER HIGH PROBABILITY BUY SETUP 🚨
* Here We Can See Clearly The Next Potential Moves For ETHUSD Coming Hours/Days.
* Keep Your Eyes Close On Your Trading Positions.
* Happy PIP Hunting Traders.
FXKILLA.

ETH vs BTC- Sometimes when we look at markets, we get confused by all the noise, Trump and governments news, ETFs, FED, bans, SEC, FUD, FOMO, fake stories, and more.
- As a trader, you must always step back from news, view the trend from a distance, and filter out that noise.
--------------------------------------------------------------------------------------------------------
Trading Parts (Monthly TF) :
--------------------------------------------------------------------------------------------------------
- Look at the trend and indicators, that’s what you should focus on first. ETH reached its all-time high in November 2021, and then retested that same ATH level in August 2025.
- Now look at the RSI and MACD levels at that time... In 2021, the RSI was overbought and the MACD crossed downward.
- Alright, now compare with where we are today. The RSI is only halfway to the top (even though ETH has already reached $5K again), and the MACD just crossed upward a few months earlier.
--------------------------------------------------------------------------------------------------------
In my opinion, we’re not topped yet and ETH still low. They will always try to scare you out so they can buy your bags cheaper.
Keep your attention on the opportunities others can’t see.
Happy Tr4Ding !

Ethereum ( $ETH) Whales Load Up as Price Holds Key SupportEthereum trades near $2,939 after a volatile month that flushed out weak hands and pulled price into long-term support. The market now watches whale behavior closely, because large wallets often position early before major trend shifts. A well-known Hyperliquid whale — famous for earning nearly $200M shorting the October crash — has now opened a $44.5M ETH long, gaining over $300K within the first hour. His timing historically matters, and many traders view this as a signal that smart money expects a reversal.
On-chain data strengthens this view. Wallets holding 10,000–100,000 ETH added 440,000 ETH in one week, aligning their cost basis with current prices. Meanwhile, mid-tier wallets continue to sell into strength. This creates a classic compression scenario: institutional-grade buyers accumulate while smaller players distribute. One group will break soon — and whales rarely fold first.
Institutional flows also support the bullish narrative. US spot-ETH ETFs recorded $96.67M in inflows, ending an eight-day outflow streak. The Coinbase Premium Index climbed from -0.12 to -0.02, showing improving US demand. With rate-cut expectations above 80%, the macro backdrop now leans favorable for risk assets like ETH.
Regulatory developments add another catalyst. US regulators approved banks to custody Ethereum, unlocking access for pension funds, insurers, and large financial institutions. Combined with the upcoming Fusaka Hard Fork on December 3, 2025, which boosts scalability and blob capacity, Ethereum enters a new phase of adoption.
Technically, ETH hovers at its long-term support zone. If $3,000 holds, targets sit at $3,450 and $3,800. A close below $2,900 opens a path toward $2,150–$2,200. For now, whale accumulation, ETF flows, and improving sentiment signal accumulation rather than fear.

Ethereum Faces Death Cross After 9 Months After $4 Billion SellEthereum is currently priced at $2,921, sitting just under the crucial $3,000 resistance level. Losing this psychological threshold triggered the wave of $4 billion in selling and reinforced bearish sentiment.
In the near term, ETH will likely consolidate under $3,000 and attempt to hold above support at $2,814 or $2,681. If market conditions worsen or investors continue to sell, Ethereum could break below $2,681 and slide toward $2,606 or lower.
If broader conditions stabilize, ETH could regain bullish momentum. A decisive reclaim of $3,000 would open the path toward $3,131 and potentially $3,287. This would helping Ethereum invalidate the bearish thesis and rebuild confidence among holders.
