TradeCityPro | SOL: Market Calms After Sharp Move & RSI Support👋 Welcome to TradeCityPro!
Let’s analyze SOL, one of the most popular Ethereum killers with a market cap of $99.9 billion, currently ranking 6th on CoinMarketCap.
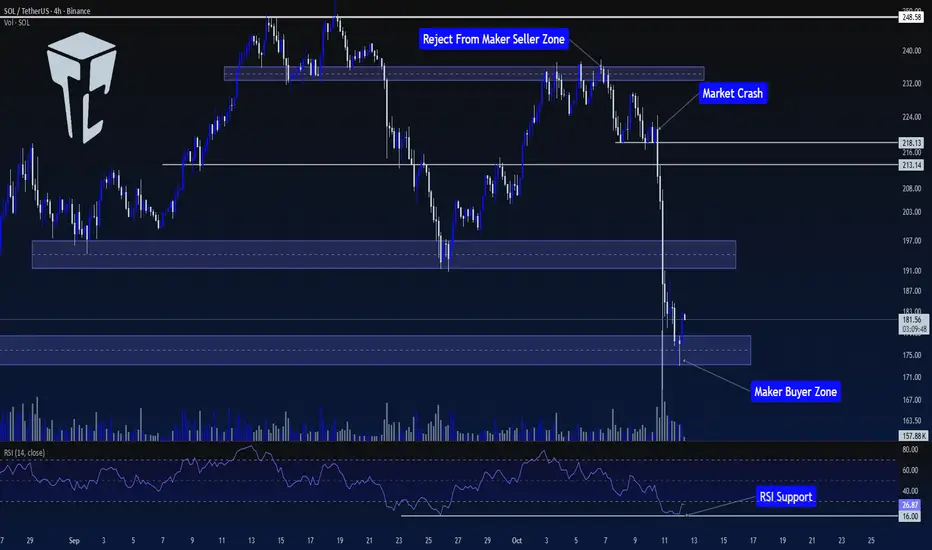
⏳ 4-Hour Timeframe
In the previous analysis, we had a Maker Buyer zone around $235. In that analysis, I mentioned that breaking this zone would be an early trigger for breaking $248.58.
🔍 However, the price never managed to sustain above this level, and after getting rejected from this zone, the price entered a corrective phase, forming a support at $218.13.
📊 After the price bounced from $218.13 for the first time, it failed to set a new high in line with previous highs and instead formed a lower high. The price returned to $218.13 again.
✔️ With the breakout of this level, coinciding with news between China and the U.S., the price started a sharp downward move, breaking through the $213.14 support.
✨ Over the course of 2-3 candles, SOL made a sharp move towards the first Maker Buyer zone, breaking it and reaching the second Maker Buyer zone.
💫 Naturally, there was a significant increase in selling volume during this move, and RSI dropped to 16, where it found support.
🧩 Currently, the market seems to have calmed down, with RSI still in the Oversell zone, but volatility has significantly decreased.
💡 Although the market has calmed, I believe the price needs to build a more structured setup before finding valid triggers, and the market conditions are not ideal for opening positions right now.
💥 So, for now, I won’t provide any triggers on this coin and will wait for more structure to form before making a better decision to open a position.
📝 Final Thoughts
Stay calm, trade wisely, and let's capture the market's best opportunities!
This analysis reflects our opinions and is not financial advice.
Share your thoughts in the comments, and don’t forget to share this analysis with your friends! ❤️
Ethereumkiller
TradeCityPro | POL Testing Range Top Amid Bullish Momentum👋 Welcome to TradeCity Pro!
In this analysis I want to review the POL coin for you. One of the so-called Ethereum Killer projects that in the previous bull run was highly hyped to replace Ethereum and now with a market cap of 2.6 billion dollars is ranked 42 on CoinMarketCap.
📅 Daily Timeframe
In the daily timeframe, this coin, like most altcoins, is in a very long-term range box. Now, after significant buying volume, it has reached the Maker Seller zone at the top of the box.
✔️ Since the price has registered a higher low than the 0.1717 bottom, the probability of breaking the zone has greatly increased. On the other hand, buying volume has gradually increased as the price has moved from the bottom of the box to the top, which shows the strength of the bullish trend.
⚡️ Now several daily candles in a row are stuck near this zone, consolidating just below it. If the zone is broken, we can have a long-term long position or even buy this coin in spot.
📊 If the bullish move starts, the resistance levels we can use as targets are 0.3299, 0.4271, and 0.5310. If the bullish trend continues and there are no signs of weakness, each of these levels can act as a new trigger for a long position.
🔍 If the price gets rejected from the resistance zone, with the breakdown of the 0.2315 trigger, the probability of a bearish move toward the 0.1717 bottom also exists, and with the breakdown of 0.2315 we can open a risky short position.
💥 With the breakdown of 0.1717, we also get the main confirmation of the trend change, and if this level is broken, this coin could have a very large drop.
📝 Final Thoughts
Stay calm, trade wisely, and let's capture the market's best opportunities!
This analysis reflects our opinions and is not financial advice.
Share your thoughts in the comments, and don’t forget to share this analysis with your friends! ❤️

Solana Surges Nearly 8% As Janover Pivots to Solana Treasury The price of Solana ( CRYPTOCAP:SOL ) famously known as the ethereum killer has surged nearly 8% today as Commercial property platform Janover pivots to Solana treasury strategy, stock surges 1,100% as investors rush in prior the news.
Janover has invested over $9.6 million into Solana (83,000+ SOL) as part of a new digital asset treasury strategy, with plans to stake its holdings and run validators to generate onchain revenue.
The move follows a $42 million funding round and has triggered a 1,100% surge in Janover’s stock price as the company positions itself as a transparent, publicly traded vehicle for crypto exposure.
Solana has lost grip of the $120 pivot for the past 2 weeks, but reclaimed the zone today currently trading at $120.54 per $SOL.
The daily price chart shows Solana has been trading within an enclose rectangular zone with the Resistant and support points slightly above each other. For Solana, a break above the $170 zone could pave way for a move to the $200- $270 zone. Similarly, a break below the $100 zone could be catastrophic for Solana.
However, the RSI shades a bit of a light at the end of the tunnel as it stands at 47, which is prime for a reversal.

Avax Long viewExelent opportunity to start accumulating Avax for the long term.
Price hiting a huge support area (Pink order block) AND perfleclty matching with the 0,5 level of Fib;
#Keep it Simple

ICX/ETH - Break it or leave itHello my dear friends. Here is an Idea of the ICX/ETH. This is the shorter term outlook for the aforementioned pair, the long term one I will post shortly after this idea. U see in this chart the marked resistances which ICX/ETH has to break to form some sort of bullish impulse which could create a new longer term narrative to the coin against ETH. This coin is called the Ethereum killer by the die hard maxi's. The break of the trendline will decide if they are right or wrong.
This coin is situated in a falling wedge (bullishly biased pattern) and is nearing its apex. So we have to expect a break to either side the coming couple weeks. In my opinion I think itll break up since ICX has amny developments going on and the many bullish divergences created on the weekly chart. There is also another major trendline when ICX breaks out of its small falling wedge. This trend line dates back to the conception of the ICX/ETH pair and is thus more important than ever to break. It is situated pretty high from this price so ICX may fake us out along the way and get rejected from this line. But when it breaks this major trend line, I think ICX will make its way to 10 usd plus prices very soon. If it gets rejected we may need more patience. That's all, cheers.
ILong

Resurrection of a Giant? EOS showing signs!BINANCE:EOSBTC
What to say about EOS? I think everybody that has somehow followed EOS´s development from time to time knows that he/she actually doesn´t know anything about what is going to happen with this project.
Some might think they know, but lets be honest. WE DO NOT KNOW!
The very same dilemma can be seen in the Chart structure.
EOS still suffers from a 3,5 year downtrend and has been on a flat line ever since 1 year (more or less).
Looking at the weekly chart we can assume the bottom is in (never say never!)
The upside potential is greater than the downside.
Getting back to the old Fib line of 0.23 means a massive 470%, which I think is very possible.
By the end of 2022 I can even see a 1000% upside move as a potential.
Needless to say that positive/negative news about EOS will strongly influence price movement.
Main reason for this is that EOS is not trending at all right now. And in order to give it a proper pump we need people as this is no small cap coin.
Lets see what will happen in the end, EOS is definetely on my watch list.
Enjoy and protect your capital.
Best Regards,
Thatwalletguy
PS. No financial advice, do your own research
ELong


Near - Bullish Days AheadNear is hyped as the Ethereum Killer in the market. I would say it's very early to make predictions on this coin, But I am bullish on this coin.
Near ICO was done in 3 phases, i.e. 0.40$ with 40 days lockup period, 0.34$ with 1 year linear release and 0.29$ with 2 years linear release. There are some strong holders of this coin. and if you had checked out mine recent Bitcoin analysis. I am seeing high probability of 13K in near future.
Add some NEAR tokens in your portfolio. This can give you some good profits.

ELong
