Ethereum - Still a textbook chart!📌Ethereum ( CRYPTO:ETHUSD ) will first drop, then rally more:
🔎Analysis summary:
Over the course of the past couple of weeks, Ethereum has just been consolidating. But actually looking at the higher timeframe, Ethereum remains overall bullish. But first, we have to see another short term drop of about -20% back to the major support trendline.
📝Levels to watch:
$2,000
SwingTraderPhil
SwingTrading.Simplified. | Investing.Simplified. | #LONGTERMVISION
Ethereumlong

Ethereum Builds Strength: Day Trading Blueprint🔥 ETH/USD — Ethereum Day-Trade Breakout Blueprint 🚀 | Bullish Momentum Setup 🔍
📌 Asset: ETH/USD — Ethereum vs U.S. Dollar
📈 Market Type: Crypto | DAY TRADE Blueprint
📖 Trade Plan — Bullish Breakout Structure
ETH is building strong upward momentum with clean higher-lows and tightening price compression. Buyers are stepping in across major crypto pairs, signaling strength in the broader market cycle.
🎯 Entry
Any price-level breakout entry depending on your execution style.
🛑 Stop Loss (Risk Management First)
This is Thief SL → @ 2760
Dear Ladies & Gentlemen (Thief OG’s), adjust your SL based on your OWN strategy and risk.
⚠️ I'm NOT recommending to use ONLY my SL — your money, your rules, your risk tolerance.
🏆 Target
Moving Average is acting as strong resistance + market is entering overbought zones + potential trap formation for late buyers.
Our TP Zone → @ 3000
⚠️ Dear Ladies & Gentlemen (Thief OG’s), TP is your personal choice.
You can take profits the way YOU manage risk.
🔗 Related Pairs to Watch (Correlation Radar)
Watching correlated pairs gives confirmation + early signals of ETH strength or weakness.
1️⃣ BTC/USD (Bitcoin) — King Maker
ETH usually follows BTC’s momentum.
If BTC shows bullish continuation + strong volume → ETH breakout becomes HIGHER probability.
If BTC stalls or rejects → ETH breakouts often fail or become fakeouts.
2️⃣ ETH/BTC — Relative Strength Pair
A rising ETH/BTC = Ethereum outperforming Bitcoin.
A falling ETH/BTC = ETH lagging → Breakouts weaken.
Key Significance: Shows where smart money is rotating.
3️⃣ NASDAQ 100 / US Tech Index ( NASDAQ:NDX / NASDAQ:QQQ )
ETH has high correlation with risk-on tech sentiment.
If US tech rallies → Crypto liquidity flows → ETH bullish pressure increases.
If tech sells off → Crypto often follows.
4️⃣ DXY — U.S. Dollar Index ( TVC:DXY )
Weak USD → Crypto strengthens (inverse correlation).
Strong USD → Crypto cooling or correcting.
Watching DXY helps understand global risk appetite.
5️⃣ SOL/USD, AVAX/USD, MATIC/USD — Layer-1 Competitive Coins
High performance in these alt L1s often triggers rotation flows into ETH.
When these pump together → ETH usually follows with momentum.
📊 Why These Correlations Matter
Crypto → Highly interconnected; no asset moves alone.
BTC controls trend direction.
TradFi indices & USD influence liquidity conditions.
ETH/BTC shows smart-money rotation.
Alt-L1s show risk appetite in the broader ecosystem.
Tracking these pairs = fewer fake breakouts + stronger conviction.

ETH/USDT Bullish Continuation Setup With MA Confluence🚀 ETH/USDT BULLISH PROFIT PATHWAY
Ethereum vs Tether | Day / Swing Trade Setup
📌 MARKET OVERVIEW
🔹 Asset: ETH/USDT
🔹 Market Type: Crypto
🔹 Trade Style: Day / Swing
🔹 Bias: BULLISH 📈
Ethereum is showing strong bullish continuation behavior after a healthy pullback, indicating smart money accumulation rather than distribution.
🧠 TRADE PLAN – WHY THIS SETUP WORKS:
✅ Bullish confirmation achieved with:
🔁 786 Hull Moving Average pullback → trend respect by buyers
🚀 386 Triangular Moving Average breakout → momentum shift in favor of bulls
🧲 Price holding above dynamic support → dip buyers active
📊 This structure suggests trend continuation, not exhaustion.
🎯 ENTRY STRATEGY – THIEF LAYERING METHOD
💡 Thief never chases — Thief stacks positions 🥷
🔹 Entry Style: Layered limit entries (cost-averaging with control)
🔹 Execution: Buy ANY price level using layers
📍 Suggested Buy Layers:
• 2950
• 3000
• 3050
• 3100
⚠️ Increase or reduce layers based on:
Risk tolerance
Timeframe
Volatility conditions
🧠 Why layering works:
It reduces emotional entries, improves average price, and lets thieves profit from volatility traps.
🛑 STOP LOSS – CAPITAL PROTECTION
🚨 Thief SL Zone: 2900
⚠️ Important Note for OGs:
This SL is a reference, not an instruction.
Adjust SL based on:
Your position size
Timeframe
Account risk rules
💬 Risk management keeps thieves alive longer than predictions.
🎯 TARGET & EXIT STRATEGY
🎯 Primary Target: 3400
🚓 Why 3400 is critical:
Strong resistance zone
Overbought conditions likely
Profit-booking + trap area
Correlated rejection risk
💰 Smart Exit Idea:
Scale profits instead of waiting for one magic number:
• Partial TP near resistance
• Trail stop after momentum slows
📌 Thieves escape with profits — not with hope.
🔄 RELATED PAIRS TO WATCH (CORRELATION CHECK)
📊 These pairs help confirm or invalidate ETH strength:
🔹 BTC/USDT – Market leader
• BTC strength = ETH momentum confirmation
• BTC weakness = caution on ETH longs
🔹 ETH/BTC – Alt strength meter
• Rising ETH/BTC = alt season behavior
• Falling ETH/BTC = BTC dominance risk
🔹 SOL/USDT & AVAX/USDT
• If these lead → risk-on sentiment
• If they stall → reduce aggression
🧠 Correlation helps thieves filter fake breakouts.
🌍 FUNDAMENTAL & MACRO CONTEXT
📌 Current Market Drivers:
• Ethereum supply dynamics tightening due to staking
• Network upgrades supporting long-term demand
• ETF & institutional attention influencing volatility
• Macro risk sentiment impacting crypto flows
📆 Upcoming Considerations:
• Sudden news = volatility spikes
• Macro data releases can shake leverage
• Always expect fake moves before real expansion
⚠️ News doesn’t create trends — it accelerates them.
🧩 KEY LEVELS SUMMARY
📍 Support Zones: 2950 – 3000
📍 Bull Control Zone: Above 3050
📍 Resistance / Exit Zone: 3280 – 3400
📍 Psychological Levels: 3000 & 3400
FINAL THIEF MESSAGE
💬 Dear Ladies & Gentlemen (Thief OGs),
This plan is a framework, not financial advice.
You control:
Entry size
Stop loss
Profit taking
💰 Make money → protect capital → escape clean.
👇 Drop your bias in comments:
Bullish continuation or trap near 3400?
Let’s see who escapes with loot 🥷🔥

ETH: Trying to go long.We both took and captured liquidity. The picture looks good.
The RSI for 1, 2, 3, and 4 hours is in the oversold zone. There is a high chance of a rebound.
Our first goal is to correct the short imbalance at approximately $3,100 and move the stop to break even. If we stand on the short imbalance and go down, the price will most likely go down to the lows again.
Good luck, everyone! Use competent risk management.
BINANCE:ETHUSDT.P

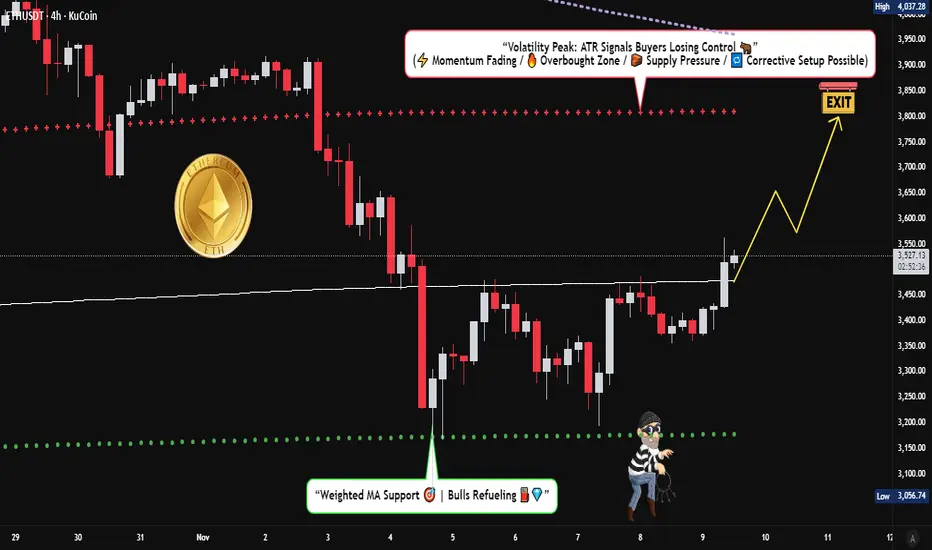
ETH/USDT Outlook – Bullish Bias Strengthens Above Key Support💎 ETHEREUM VS TETHER - Crypto Market Opportunity Blueprint (Swing Trade)
📊 CURRENT MARKET STATUS
Current Price: $3,380 - $3,427 USDT
Market Structure: Bullish consolidation at dynamic resistance
Setup Type: Weighted Moving Average Pullback + Breakout Confirmation
🎯 TRADE PLAN
📍 BIAS: BULLISH ✅
The bullish plan is CONFIRMED following:
✅ Weighted MA pullback completion
✅ Breakout at dynamic resistance line
✅ Price holding above key support zones
🔥 ENTRY STRATEGY - "THIEF LAYERING METHOD"
Entry Type: Multiple Limit Orders (Layer Strategy)
💰 THIEF ENTRY LAYERS:
Layer 1: $3,300 USDT
Layer 2: $3,400 USDT
Layer 3: $3,500 USDT
📌 Note: You can enter at ANY PRICE LEVEL or increase limit layers based on your own risk appetite and capital allocation. The layering strategy allows you to average your entry and reduce risk.
💡 Strategy Benefit: Multiple limit orders help capture price fluctuations and build position gradually instead of all-in at one price.
🛡️ STOP LOSS MANAGEMENT
Thief SL: $3,200 USDT
⚠️ IMPORTANT - Dear Ladies & Gentlemen (Thief OG's):
DO NOT blindly follow my SL level
PLACE YOUR SL AFTER BREAKOUT CONFIRMATION ONLY
Adjust your SL based on YOUR OWN strategy and risk tolerance
This is YOUR money, YOUR risk - trade responsibly
🎯 TAKE PROFIT TARGET
Target Zone: $3,800 USDT
⚠️ Exit Strategy Factors:
📉 Moving Average acting as strong resistance
⚠️ Overbought conditions expected
Potential bull trap zone
💰 Escape with profits at target levels
🔔 CRITICAL - Dear Ladies & Gentlemen (Thief OG's):
This is NOT financial advice
I'm NOT recommending you set ONLY my TP
Take profits at YOUR OWN price targets
Make money, THEN take money at your own risk level
No one knows your financial situation better than YOU
📊 CORRELATED PAIRS TO WATCH
Monitor these pairs for confirmation and correlation analysis:
Major Crypto Pairs 💹:
BINANCE:BTCUSDT - Bitcoin dominance and market leader direction
BINANCE:ETHBTC - Ethereum's strength vs Bitcoin (alt season indicator)
BINANCE:SOLUSDT - Layer-1 competitor correlation
BINANCE:BNBUSDT - Exchange token & ecosystem correlation
DeFi Ecosystem 🔗:
BINANCE:LINKUSDT - Oracle network (DeFi infrastructure)
BINANCE:UNIUSDT - DEX token (Ethereum ecosystem strength)
BINANCE:AAVEUSDT - Lending protocol (DeFi sentiment)
Layer-2s ⚡:
BITTREX:MATICUSDT (Polygon) - L2 scaling solution
BINANCE:ARBUSDT (Arbitrum) - L2 rollup correlation
BINANCE:OPUSDT (Optimism) - L2 ecosystem health
🔍 KEY CORRELATION POINTS
1️⃣ BTC Dominance: If BTC pumps independently, ETH might lag initially
2️⃣ ETH/BTC Ratio: Rising = Alt season favorable / Falling = BTC dominance
3️⃣ L2 Tokens: Strong performance = Ethereum ecosystem bullish
4️⃣ DeFi Tokens: Strength indicates institutional rotation into ETH ecosystem
5️⃣ Gas Prices: Rising on-chain activity supports bullish ETH narrative
⚡ TECHNICAL SETUP SUMMARY
✅ Weighted MA pullback completed
✅ Dynamic resistance breakout confirmed
✅ Support holding at lower levels
✅ Volume confirmation on breakout
⚠️ Watch for overbought RSI at target zone
⚠️ Be cautious of bull traps near MA resistance
🎓 RISK MANAGEMENT REMINDER
💼 Never risk more than 1-3% of portfolio per trade
📊 Position size according to YOUR stop loss distance
🎯 Have clear exit strategy BEFORE entering
💰 Take partial profits at psychological levels
🔄 Trail your stop loss as trade moves in profit
🔔 Like this idea? Drop a 👍 and follow for more setups!
💬 Comment your thoughts and TP levels below!
📊 Share with fellow traders who need to see this!
#ETHUSDT #Ethereum #CryptoTrading #SwingTrade #TechnicalAnalysis #TradingView #CryptoAnalysis #AltSeason #DeFi #Layer1
ETHUSD Momentum Building! MA Breakout Keeps Bulls in Control📘 **ETHUSD “Ethereum vs U.S. Dollar”
Crypto Market Opportunity Blueprint (DAY Trade)**
🚀 Plan Overview
A bullish continuation scenario is active following a clear Moving Average breakout and clean retest. This structure builds a favorable environment for controlled entries backed by momentum confirmation.
🎯 Entry
👉 You can enter at any price level once your personal confirmation aligns with the ongoing MA structure.
The breakout + retest provides the core framework.
🛡️ Stop Loss Strategy
📍 This is the Thief SL @ 3050 Dear Ladies & Gentleman (Thief OG’s)
Adjust your Stop Loss based on your own strategy, risk tolerance, and trade model.
⚠️ Place the SL only after the MA breakout confirmation, not before.
📝 Note:
Dear Ladies & Gentleman (Thief OG's) I am not recommending that you use only my SL. It’s your own choice; you can make money then take money at your own risk.
🎯 Target
The SuperTrend ATR line is acting as a strong resistance, and current conditions suggest:
📈 Overbought signals building
Trap zones developing
📌 Smart exit required
👉 Our target: 3600
📝 Note:
Dear Ladies & Gentleman (Thief OG’s) I am not recommending that you set only my TP. It’s your own choice; you can make money then take money at your own risk.
🔍 Related Pairs to Watch (Correlation & Key Notes)
1. BITSTAMP:BTCUSD (Bitcoin vs USD)
ETHBTC correlation remains high during MA-driven moves.
BTC’s trend strength often dictates crypto-wide volatility.
Strong BTC breakout boosts ETH’s bullish follow-through potential.
2. BINANCE:ETHBTC (Ethereum vs Bitcoin)
Great pair to measure Ethereum’s relative strength.
Rising ETHBTC = ETH outperforming BTC → supports the bullish ETHUSD narrative.
Useful for detecting early reversals before USD-pairs show it.
3. CRYPTOCAP:TOTAL2 (Altcoin Market Cap)
Represents overall altcoin strength excluding BTC.
If TOTAL2 breaks resistance with volume, ETH usually moves aggressively.
Helps confirm whether the market supports a broad-based ETH rally.
4. COINBASE:SOLUSD (Solana vs USD)
Competes for capital rotation with ETH.
When SOL pumps aggressively, ETH sometimes lags before catching momentum.
Watching SOL gives early hints of altcoin capital flow.
5. TVC:DXY (US Dollar Index)
Inverse correlation with major crypto assets.
Weak DXY = supportive environment for ETHUSD upside.
Strong DXY = caution for crypto longs.

My plan is ETH.Here are my thoughts on ETH. I'm maintaining my position from the previous review. You can check it out in my profile. My TVH is very good at 2,950+.
However, I'm still a little confused by the 4-hour RSI. For now, though, I'm ignoring it.
Think for yourself. I don't rule out price swings before or during the Fed meeting.
Good luck and profits to all!

Can ETHUSDT Sustain Momentum After LSMA Breakout?🔥 ETHUSDT BULLISH BLUEPRINT: LSMA Confirmed, Awaiting WMA Breakout for Range Escape! 🚀
Description:
👑 ATTENTION, LADIES & GENTLEMEN – THE THIEF OGs! 👑
Welcome to a clear, actionable blueprint for $ETHUSDT. This isn't just a signal; it's an educational opportunity to understand confluence and manage your own risk like a pro.
📈 THE BIG PICTURE (Market Context):
Ethereum is showing strength within a defined range. A critical LSMA breakout has already confirmed the underlying bullish bias. We are now waiting for the final confirmation to trigger a potential swing move UP.
⚙️ TRADE PLAN (Bullish Confluence):
Direction: Bullish 🐂
Style: Day Trade / Swing Trade
Phase: Range-Bound, awaiting bullish breakout confirmation.
Key Levels: Range resistance is the key hurdle.
🎯 KEY LEVELS & LOGIC:
🟢 TRIGGER ZONE (Entry): $3,200.00
Wait for a decisive candle close ABOVE the Weighted Moving Average (WMA) at this zone.
This WMA breakout is our awaited confirmation to join the LSMA's bullish bias.
"YOU CAN ENTRY AT ANY PRICE LEVEL AFTER THE WMA BREAKOUT" – but the $3,200 zone is optimal for confirmation.
🔴 RISK DEFINITION (Stop Loss): $2,900.00
This is MY "Thief SL" – a level that invalidates the setup.
CRITICAL NOTE: 📢 I am NOT recommending you use only my SL. ADJUST based on YOUR strategy & risk tolerance. Place your SL AFTER the MA breakout confirmation. Protect your capital first!
🟡 PROFIT TARGET (Take Profit): $3,500.00
This target aligns with a historical resistance zone where moving averages may converge.
WARNING: Be aware of potential overbought traps and resistance. "Escape with profits."
CRITICAL NOTE: 📢 I am NOT recommending you use only my TP. Manage your trade actively. "Take money at your own risk." Scale out partials or trail your stop!
💎 THE THIEF OG's GOLDEN RULES:
This is a BLUEPRINT, not financial advice.
YOU are responsible for your own trades, risk, and money management.
Confirmation > Impulse. Wait for the WMA breakout.
Always use a stop-loss. No excuses.
🔍 RELATED PAIRS TO WATCH (Correlation & Key Insights)
Monitoring correlated assets strengthens confirmation and trend accuracy.
Here are the most relevant ETH-linked market movers:
1️⃣ BINANCE:BTCUSDT – Bitcoin vs Tether
Correlation: High
Why it matters:
Bitcoin leads overall crypto sentiment.
ETH breakouts are stronger when BTC breaks key resistance zones.
If BTC rejects from MA levels, ETH often loses momentum too.
What to track:
BTC Daily MA structure
BTC dominance (BTC.D)
Volatility cycles
2️⃣ BINANCE:ETHBTC – Ethereum vs Bitcoin
Correlation: Medium–High (Relative Strength Pair)
Why it matters:
Shows whether ETH is outperforming or lagging against BTC.
A breakout in ETH/BTC gives early confirmation of strong ETH upside.
If ETH/BTC drops, ETHUSDT upside can slow even if USDT charts look bullish.
Key levels:
ETH/BTC horizontal range
MA crossovers
Relative strength slope
3️⃣ BINANCE:SOLUSDT – Solana vs Tether
Correlation: Moderate
Why it matters:
Competes with Ethereum in Layer-1 dominance.
Solana pumps often trigger temporary liquidity rotation away from ETH.
If SOL rallies aggressively, ETH may consolidate longer.
Watch for:
Layer-1 sentiment shifts
Capital rotation between SOL & ETH
4️⃣ BITTREX:MATICUSDT – Polygon vs Tether
Correlation: Medium
Why it matters:
Ethereum Layer-2 ecosystems influence ETH network usage & fees.
MATIC strong moves can signal increased demand for ETH’s ecosystem indirectly.
5️⃣ COINBASE:XTZUSD (or) BINANCE:AVAXUSDT (or) BINANCE:BNBUSDT
Correlation: Low–Moderate
Why it matters:
Any strong L1 competitor rally can pull temporary liquidity from ETH.
Helps judge broader altcoin sector strength.
🧭 KEY CORRELATION SUMMARY
BTCUSDT → Drives crypto trend direction
ETH/BTC → Determines whether ETH has relative strength
SOL, MATIC, BNB, AVAX → Track liquidity rotation
Stronger confirmations = safer ETH entry after WMA breakout

Ethereum ( $ETH) Whales Load Up as Price Holds Key SupportEthereum trades near $2,939 after a volatile month that flushed out weak hands and pulled price into long-term support. The market now watches whale behavior closely, because large wallets often position early before major trend shifts. A well-known Hyperliquid whale — famous for earning nearly $200M shorting the October crash — has now opened a $44.5M ETH long, gaining over $300K within the first hour. His timing historically matters, and many traders view this as a signal that smart money expects a reversal.
On-chain data strengthens this view. Wallets holding 10,000–100,000 ETH added 440,000 ETH in one week, aligning their cost basis with current prices. Meanwhile, mid-tier wallets continue to sell into strength. This creates a classic compression scenario: institutional-grade buyers accumulate while smaller players distribute. One group will break soon — and whales rarely fold first.
Institutional flows also support the bullish narrative. US spot-ETH ETFs recorded $96.67M in inflows, ending an eight-day outflow streak. The Coinbase Premium Index climbed from -0.12 to -0.02, showing improving US demand. With rate-cut expectations above 80%, the macro backdrop now leans favorable for risk assets like ETH.
Regulatory developments add another catalyst. US regulators approved banks to custody Ethereum, unlocking access for pension funds, insurers, and large financial institutions. Combined with the upcoming Fusaka Hard Fork on December 3, 2025, which boosts scalability and blob capacity, Ethereum enters a new phase of adoption.
Technically, ETH hovers at its long-term support zone. If $3,000 holds, targets sit at $3,450 and $3,800. A close below $2,900 opens a path toward $2,150–$2,200. For now, whale accumulation, ETF flows, and improving sentiment signal accumulation rather than fear.

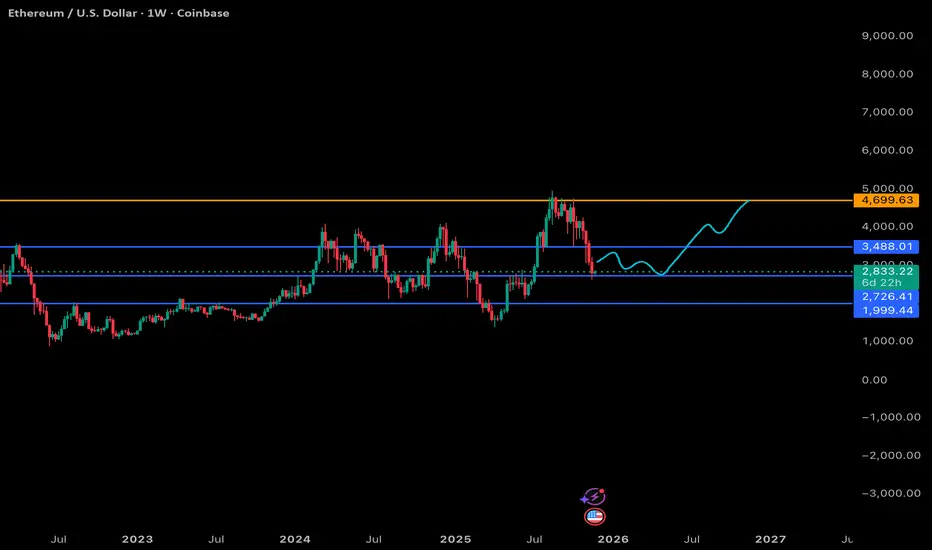
ETH 1W Breakdown: My Levels & What to Expect Next - Nov 23 2025Here’s my current high-timeframe view on Ethereum. Same structure as the BTC chart:
Blue = support, orange = major resistance, and the teal line = where I think price is headed into next year.
Support Levels (Blue)
$3,488: This is the upper support zone. ETH already lost it on the weekly, so I’m treating it as a potential reclaim level later rather than an area to rely on for an immediate bounce.
$2,726: This is the real weekly support I’m watching short-term. Price is sitting just above it, and this level has acted as both resistance and support multiple times across 2024–2025. If ETH is going to stabilize, it’ll probably start here.
$1,999: Deep, cycle-reset support. I’m not calling for this, but it’s absolutely in play if the broader market gets another leg down or BTC drags everything into a deeper correction phase.
Resistance (Orange)
$4,699–$5,000: This is the macro ceiling for ETH. Major weekly resistance from the last cycle’s highs. ETH hasn’t convincingly broken above this since 2021, so this is the level that needs to be taken out to start a real expansion phase.
My Expected Path (Teal)
The teal line is basically my roadmap going into late 2025/2026:
ETH chops around between $2.7K and $3.4K while the market tries to find weekly direction.
Eventually we get a reclaim of that mid-zone, slow, sideways, frustrating price action.
Then a grind back into the $4–4.5K region as momentum rebuilds.
Break above the orange zone later next year, which finally opens the door for a move into price discovery (I’m thinking $6K+ if things really align with the broader cycle).
This mirrors the BTC idea: a mid-cycle reset, sideways accumulation, then the breakout once the market has properly flushed leverage and sentiment has cooled off.
Overall View
ETH looks like it’s in the same boat as BTC right now, not bearish on the macro, just in that annoying “let’s reset everything” phase that tends to drag on longer than most people want. If it plays out like this, I think ETH offers multiple opportunities to accumulate before we get any push toward its all-time-high region.
Slow grind now, bigger moves later.
Ethereum 1st Spot Buy Target has been reachedMarkets like to reverse at low volume nodes or fair value gaps, so as you can see, we have reached one of the lowest volume areas of this year so this can act as my personal buy target for Ethereum.
2nd and 3rd are noted as well.
Wish you all the best trading.

Ethereum - The realistic $15,000 target!🔥Ethereum ( CRYPTO:ETHUSD ) can still break out:
🔎Analysis summary:
Over the past four years, Ethereum has been trading in a massive bullish triangle pattern. And despite the recent all time high rejection, Ethereum can still follow its underlying bullrun. It just has to create the bullish triangle breakout in the foreseeable future.
📝Levels to watch:
$4,000
SwingTraderPhil
SwingTrading.Simplified. | Investing.Simplified. | #LONGTERMVISION

BMNR BIG BULL RUN PROBABILITY SOON!!!🚨 BMNR HIGH PROBABILITY BUY SETUP 🚨
* Here We Can See Clearly The Next Potential Moves For BMNR Coming Hours/Days.
* Keep Your Eyes Close On Your Trading Positions.
* Happy PIP Hunting Traders.
FXKILLA.

Ethereum change in trend As this D leg comes to an end, the correct traders Psychology says this is extremely oversold. The bullish divergence is aggressive, key fib levels are being hit, monthly and weekly pivot levels are being hit and I should be looking for an aggressive rally to the upside. A minimum target of $4050 is very probable.

Can Short-Term Holders Rescue Ethereum From a Drop to $3,500?At the time of writing, Ethereum is trading at $3,846, holding just above the $3,802 support level. The altcoin king is likely to remain rangebound as market conditions show limited volatility.
Ethereum’s price currently fluctuates between $4,154 and $3,802. This consolidation range could persist in the coming sessions, with ETH possibly retesting resistance if short-term momentum returns.
However, if bearish conditions intensify and Ethereum loses the $3,802 support, a further drop could follow. A breakdown below this level may send the price under $3,742 and toward $3,500, invalidating the bullish thesis and signaling deeper market weakness ahead.

EthereumETHUSD
- Bearish Channel as an corrective pattern in Short Time Frame
- Sell Side Liquidity
- Change of Characteristics
- Completed " 1234 " Impulsive Waves
- Order Block

Ethereum - This triangle decides everything!🪄Ethereum ( CRYPTO:ETHUSD ) still respects the triangle:
🔎Analysis summary:
As we are speaking, Ethereum is creating the fourth retest of the previous all time high. Since Ethereum has been trading in a bullish triangle pattern for the past four years, a bullish breakout remains likely. But short term volatility remains totally expected.
📝Levels to watch:
$4,000
SwingTraderPhil
SwingTrading.Simplified. | Investing.Simplified. | #LONGTERMVISION

Ethereum Sees Major Sell-Off as Price Fails to Break $4,000Ethereum’s price sits at $3,950 at the time of writing, stuck below the critical $4,000 resistance. The altcoin has been oscillating near $3,872, showing no clear directional bias.
The current indicators suggest that this consolidation phase above $3,742 support is likely to persist. However, if market conditions worsen and ETH slips below $3,742, a further decline toward $3,489 could follow. Such a move would confirm a bearish continuation pattern.
Conversely, if buying activity strengthens and overall sentiment improves, Ethereum could breach the $4,000 resistance level. A successful breakout would open the path toward $4,221, invalidating the bearish outlook and signaling renewed investor confidence.

Ethereum Price Stuck Below $4,000 as LTHs Apply Selling PressureEthereum’s price trades at $3,846 at press time, slipping below the $3,872 support level. The altcoin king has remained stuck under $4,000 for nearly a week, reflecting fading momentum and tightening volatility in the broader crypto market.
Given the prevailing selling pressure and weak inflows, Ethereum’s price could fall further toward the $3,742 support zone. If this level fails to hold, a deeper correction could follow, pushing ETH down to $3,489. Such a decline would reinforce the current bearish outlook.
However, if Ethereum holders curb their selling and demand strengthens, ETH could rebound above $4,000. A decisive break of this resistance could lift prices toward $4,221, signaling renewed optimism and invalidating the prevailing bearish setup.

Ethereum - The clear $20.000 target!🚀Ethereum ( CRYPTO:ETHUSD ) is breaking out:
🔎Analysis summary:
Despite the recent back and forth, Ethereum clearly remains bullish. We are still able to see the underlying triangle pattern, which Ethereum is attempting to break again. After a successful breakout, Ethereum will immediately start the next potential +350% rally.
📝Levels to watch:
$4,500 and $20,000
SwingTraderPhil
SwingTrading.Simplified. | Investing.Simplified. | #LONGTERMVISION

ETHEREUM HIGH PROBABILITY SETUP SOON!!! 🚨 ETHER HIGH PROBABILITY BUY SETUP 🚨
* Here We Can See Clearly The Next Potential Moves For ETHUSD Coming Hours/Days.
* Keep Your Eyes Close On Your Trading Positions.
* Happy PIP Hunting Traders.
FXKILLA.

Ethereum Falls Below $4,000—But A Price Rebound Could Be NearEthereum’s price currently sits at $3,727, having fallen from $4,000 in the past 48 hours. However, technical indicators suggest that the altcoin may soon see a reversal, with investors preparing to defend key support levels.
If Ethereum bounces off the $3,742 support line, it could climb back toward $4,000. A successful breach of that barrier would likely push ETH higher, targeting the $4,221 level once again. This movement would align with historical recovery trends seen after periods of capitulation.
Still, a failure by investors to sustain momentum could trigger a deeper correction. Should the market sentiment turn bearish, Ethereum may decline toward $3,489. A drop below this level would invalidate the short-term bullish outlook, delaying any potential rebound.

3 Altcoins That Could Hit All-Time Highs In The Second Week Of OEthereum is currently trading at $4,143, hovering just below the key $4,222 resistance level and awaiting a decisive breakout. The altcoin king rebounded strongly from $3,742, marking a 10% surge in the past 24 hours and signaling renewed investor confidence across the broader crypto market.
The Ichimoku Cloud indicator points to short-term bullish momentum for Ethereum. If ETH successfully flips $4,222 into support, the price could rally toward $4,500. Securing this level would further set the stage for Ethereum to test the next resistance at $4,956, reinforcing its upward trajectory.
However, if bullish conditions weaken or ETH fails to breach the $4,222 barrier, a reversal could occur. Ethereum might fall to $4,000 or even lower, erasing recent gains and invalidating the bullish outlook as selling pressure intensifies.
