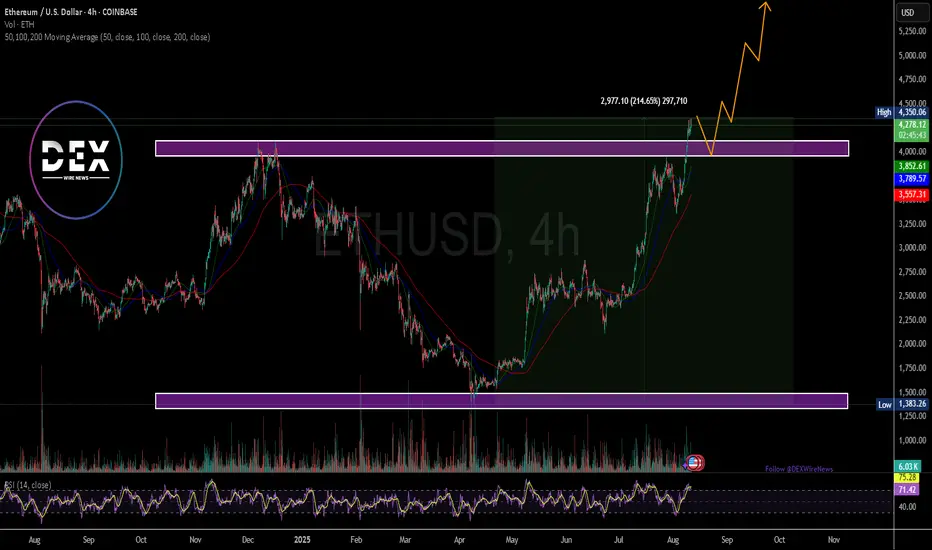
Ethereum $ETH crypto trade idea using the weekly demand levelThere is an Ethereum CRYPTOCAP:ETH crypto trade idea using the weekly demand at $3,872. This is a very similar crypto swing trade idea I recently shared with BitCoin. Let's see if it wants to rally for a couple of weeks. You can use the smaller timeframes to trade crypto intraday strategies or scalping strategies.
Ethereumlong

Ethereum Price Hits 6-Week Low, But Here Lies An OpportunityAt press time, Ethereum is trading at $3,938, attempting to establish $3,910 as a support floor. This decline marks a crucial break below the $4,000 level, highlighting short-term weakness.
Given current signals, ETH may remain rangebound under $4,074 resistance until stronger bullish cues emerge. Market sentiment suggests consolidation rather than sharp recovery, keeping investors cautious.
However, if Ethereum flips $4,074 into support, a push toward $4,222 could follow. This move would require investor participation and sustained inflows to counter bearish momentum, ultimately invalidating the short-term negative outlook.

Ethereum Price Steady at $4,500—Here’s What’s Ahead For ETHEthereum’s price is currently trading at $4,468, just shy of the $4,500 resistance. The altcoin has been consolidating near this level, showing resilience even as broader market trends remain mixed.
Given the supportive market sentiment and accumulation trend, Ethereum is poised to reclaim $4,500 as a support floor. Successfully flipping this level could pave the way for ETH to challenge the $4,775 resistance in the coming days.
However, downside risks remain if bearish pressure builds. In such a scenario, Ethereum could lose footing and slip to the $4,307 support level. A drop to this zone would invalidate the bullish thesis temporarily and deepen potential investor losses

ETHER HIGH PROBABILITY SETUP SOON!!!🚨 ETHUSD HIGH PROBABILITY BUY SETUP 🚨
* Here We Can See Clearly The Next Potential Move For Ethereum Coming Hours/Days.
* Keep Your Eyes Close On Your Trading Positions.
* Happy PIP Hunting Traders.
FXKILLA.

Ethereum $ETH daily demand playing out well. Breakout happenedEthereum CRYPTOCAP:ETH daily demand at $4,336 is playing out well. Breakout happened as expected and mentioned in the last update. Long positions should be managed on this major cruptocurrency.

Ethereum ETH Trade Setup: Resistance, Liquidity, and BoS Idea🟣 Ethereum (ETH) Update (further to my previous idea) 🟣
ETH is currently bullish 🟢📈 and pressing into a key resistance level ⚖️ where we see multiple relative equal highs 📍📍 forming consecutively. This is a major level 🔑.
Here’s what I’m watching:
1: The current pullback may give us a bullish BoS for an entry.
2: If price trades above this resistance 🚀, it will likely trigger buy stops 🎯, providing the liquidity 💧 needed for a potential pullback 🔽.
3: If price then breaks through decisively 💥, I’ll be looking for a retest + hold 🔄, followed by a bullish break of market structure (BOS) 🔓 as confirmation to get long 🟢.
⚠️ This is educational only, not financial advice. 📚

Ethereum ETH Analysis: 1D Bullish Trend with Order Block Support🔎 I’m currently looking at Ethereum (ETH), which is showing a strong bullish trend on the daily timeframe 📈. Price has pulled back significantly into a daily bullish order block 🟢 — a previous accumulation range that I expect to act as a key support level.
On the 30-minute timeframe ⏱, I’m watching closely for a bullish break of structure 🔑 as confirmation for a potential long entry 🎯.
⚠️ Not financial advice.


Ethereum - Here comes the final breakout!🚀Ethereum ( CRYPTO:ETHUSD ) breaks the all time high:
🔎Analysis summary:
Finally, after a consolidation of about four years, Ethereum is back at the previous all time high. With the recent rally of more than +200%, bulls are flexing their muscles, preparing the breakout. So far, everything is playing out according to plan with new all time highs soon.
📝Levels to watch:
$5.000
SwingTraderPhil
SwingTrading.Simplified. | Investing.Simplified. | #LONGTERMVISION

Ethereum Exit Queue Hits $5B: Wall Street’s Big Bet?
Ethereum Exit Queue Hits $5B: Sell Pressure or Wall Street’s Big Bet?
Ethereum continues to dominate crypto headlines in 2025. The network’s staking system has reached an unprecedented milestone with nearly $5 billion worth of ETH awaiting withdrawal—a development that has sparked both optimism and concern. While some fear that this backlog could translate into significant sell pressure, others see it as part of a broader realignment toward institutional adoption.
At the same time, Ethereum’s spot ETFs are outperforming Bitcoin ETFs by a wide margin, drawing in nearly $1.83 billion in just five days—ten times the inflows of Bitcoin funds. This surge highlights a growing narrative: Wall Street is tilting its focus toward Ethereum, not only as a cryptocurrency but as a foundational layer of modern finance.
This article examines the implications of the record exit queue, the rise of Ethereum ETFs, and whether ETH is poised to outperform BTC as the crypto market’s dominant asset.
Ethereum’s Record Exit Queue: A $5B Test for the Market
Ethereum’s exit queue refers to the backlog of stakers who have requested to withdraw their ETH from the staking contract. Following Ethereum’s transition to proof-of-stake in 2022 and the Shanghai/Capella upgrade in 2023, staked ETH has become liquid, enabling participants to lock and unlock their holdings as they choose.
Today, that queue has swelled to nearly 5 million ETH—worth around $5 billion. This is the largest exit queue in Ethereum’s history, and it raises critical questions:
1. Will this ETH be sold on the open market?
After a 72% rally in the past three months, many stakers may be tempted to take profits, especially those who locked in ETH at lower prices during the bear market. A mass sell-off could put downward pressure on prices.
2. Or is this a rotation of capital?
Not all withdrawals translate into selling. Many institutional investors may be withdrawing ETH to redeploy it into spot ETFs, where liquidity, custodial security, and regulatory approval are more attractive. Others may seek higher yields in decentralized finance (DeFi) protocols, liquid staking derivatives, or alternative strategies.
3. What about long-term holders?
A sizable portion of Ethereum’s stakers are long-term believers in the protocol. For them, withdrawing doesn’t necessarily mean exiting—rather, it may signal repositioning into newer financial products that better fit their strategies.
Ultimately, the exit queue is both a sign of Ethereum’s growing liquidity and a potential near-term overhang on price.
The 72% Rally: Profit-Taking or Momentum?
Ethereum’s price surge—up 72% in just three months—gives context to the withdrawal queue. After a prolonged bear market, ETH holders have seen one of the strongest rallies in years. For many, the exit queue represents an opportunity to lock in profits at multi-month highs.
However, the rally is not just speculative. Several fundamental drivers are fueling Ethereum’s rise:
• ETF approvals and inflows are bringing unprecedented institutional demand.
• Layer 2 scaling solutions such as Arbitrum, Optimism, and Base are driving transaction volumes while reducing costs.
• Tokenization pilots by major banks and asset managers are increasingly choosing Ethereum as a settlement layer.
This means the rally is underpinned by both sentiment and structural adoption, making it harder to dismiss as a short-lived pump.
Ethereum ETFs: Outshining Bitcoin
One of the most striking developments is the flow of capital into Ethereum ETFs. In just five days, spot Ether ETFs have attracted $1.83 billion in inflows, compared to only around $180 million into Bitcoin ETFs. This 10-to-1 ratio in favor of Ethereum is rare, as Bitcoin has traditionally dominated institutional flows.
Why are ETFs favoring Ethereum?
1. Utility Beyond Store of Value
Bitcoin is often called “digital gold,” but Ethereum is more than a speculative hedge. It underpins decentralized finance, NFTs, tokenization, and smart contracts—areas with real-world utility that institutions can leverage.
2. Yield Through Staking
Unlike Bitcoin, Ethereum offers staking rewards. Even though ETF structures may not directly pass staking yields to investors, the narrative of a yield-bearing crypto asset appeals to long-term capital allocators.
3. Alignment with Wall Street’s Future
Ethereum’s programmability makes it easier for Wall Street to imagine building products and services on top of it. From tokenized bonds to on-chain settlement systems, Ethereum’s relevance extends beyond speculation.
As a result, institutional flows are tilting toward ETH, reinforcing its narrative as the infrastructure layer of finance.
Will Ethereum Outperform Bitcoin?
The question on every investor’s mind: can Ethereum outperform Bitcoin in this cycle?
Ethereum’s Tailwinds:
• ETF Momentum: With stronger inflows, ETFs could become a steady channel for demand.
• Broader Use Cases: Ethereum is not just money—it’s programmable finance.
• Institutional Adoption: Banks and asset managers are experimenting with Ethereum for tokenization and settlement.
Ethereum’s Risks:
• Sell Pressure: The $5B exit queue could weigh heavily on prices if too much ETH hits the market.
• Competition: Alternative blockchains like Solana and Avalanche are vying for institutional attention with faster throughput.
• Regulation: Ethereum’s staking system could attract more scrutiny than Bitcoin, which is generally classified as a commodity.
Bitcoin’s Defenses:
Bitcoin still has the advantage of being the original, most secure, and most decentralized crypto asset. Its supply cap of 21 million gives it unmatched scarcity. But in terms of growth opportunities and utility, Ethereum may have the edge.
Wall Street’s Tilt Toward Ethereum
Ethereum’s ETF inflows and VanEck CEO Jan van Eck’s recent remarks calling ETH “the Wall Street token” suggest a broader narrative shift. Wall Street is beginning to view Ethereum not just as another cryptocurrency, but as the financial operating system of the future.
• Banks are exploring blockchain-based stablecoin transfers.
• Asset managers are launching tokenization pilots on Ethereum.
• Investors are reallocating from Bitcoin to Ethereum ETFs.
This alignment means Ethereum is no longer just a crypto-native story. It is becoming central to how global finance evolves.
Looking Ahead: Short-Term Pressure, Long-Term Promise
The $5 billion exit queue is a short-term concern. If even a fraction of that ETH is sold, prices could face volatility. But in the bigger picture, withdrawals represent liquidity and flexibility—a sign of a maturing ecosystem.
At the same time, Ethereum’s ETF success and its growing reputation as Wall Street’s blockchain suggest that institutional adoption is only beginning. If these inflows persist, Ethereum could not only outperform Bitcoin but also cement its role as the primary financial infrastructure of the digital age.
Conclusion
Ethereum is at a crossroads. On one hand, the record $5 billion exit queue raises fears of sell pressure and short-term volatility. On the other, Ethereum’s ETF dominance, institutional adoption, and 72% rally signal powerful momentum.
The battle between profit-taking and institutional accumulation will define Ethereum’s near-term price action. But the broader trend is clear: Ethereum is no longer just competing with Bitcoin—it is carving out its identity as the backbone of decentralized and traditional finance alike.
As Wall Street piles into ETH and banks experiment with on-chain settlement, Ethereum’s claim to be the future of finance grows stronger. Whether it outperforms Bitcoin in this cycle remains to be seen, but one thing is certain: Ethereum has secured its place at the center of the crypto narrative.

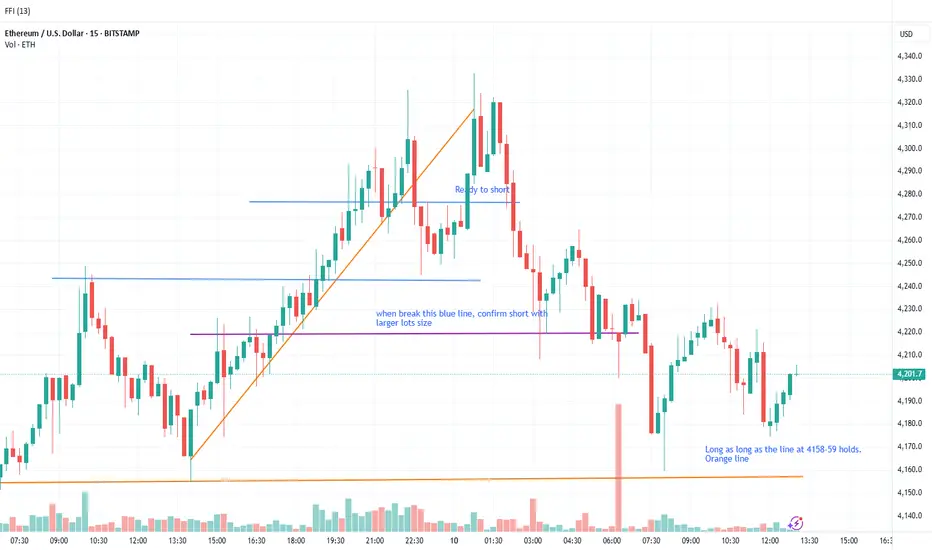
Using 15min TF to forecast the price movement action - LONGClose my shorts at 4180 and now taking a long position as long as the line at 4159 holds. This is my sharing on the Ethereum price action movement, removing all bias and purely focusing on the market maker psychology and trend. A break above the purple line (confluence zone) will confirm the Long position with bigger lots size.
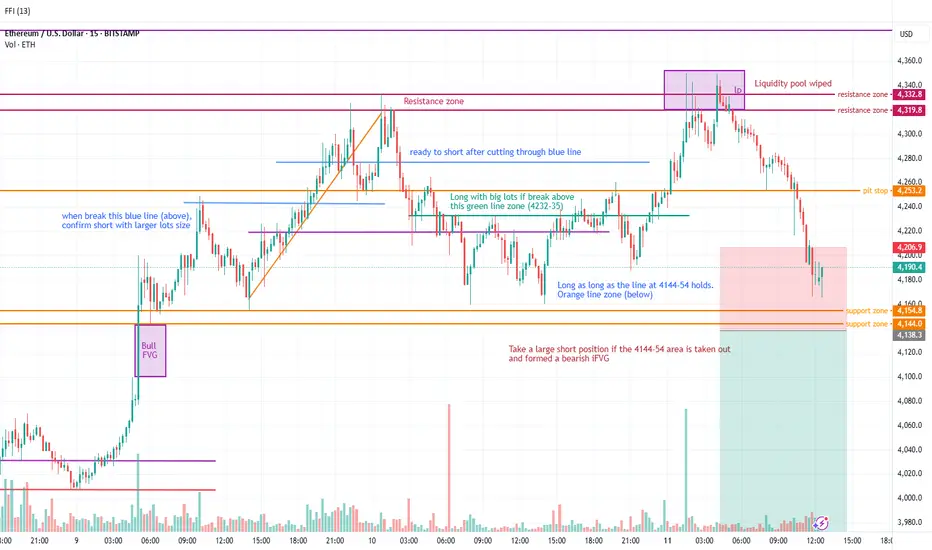
Day trading Ethereum (for both Long and Short)My analysis is based on the price action movement using liquidity pool to identify turnaround or fake manipulation move. Use FVG and iFVG to identify clear confirmation for trend movement. Price action allows me to shed light on the psychology and manipulated movement driven by market maker.
Ethereum Ready to Moon?––Bullish Trade Plan to $5K+
# 🚀 ETHEREUM BULLISH TRADE SETUP 🚀
💎 ETH Long Targeting \$5,090–\$5,800 | Risk-Defined Play 🎯
📊 **TRADE DETAILS**
🎯 Instrument: **ETH**
📈 Direction: **LONG**
💰 Entry Price: **\$4,773.95**
🛑 Stop Loss: **\$4,640.00**
🎯 Take Profit: **\$5,090 → \$5,300 → \$5,800**
📊 Size: **1% Risk**
💪 Confidence: **65%**
⏰ Entry Timing: **Market Open**
⚡ **Rationale:**
✅ Price > Key MAs (20/50/200) → Multi-timeframe bullish structure
✅ RSI/MACD show momentum with room to run
✅ Reward/Risk \~ 2.5:1 toward \$5,090+
⚠️ Risk: Low volume rally + BTC correlation
📌 **Plan:** Scale in near 4,760–4,800 → Target breakout toward \$5,000+
---
\#Ethereum #ETH #Crypto #Altcoins #ETHUSD #CryptoTrading #ETHAnalysis #CryptoSignals #TradingSetup #Breakout

Ethereum - The moment of truth!🔬Ethereum ( CRYPTO:ETHUSD ) trades at a key breakout level:
🔎Analysis summary:
Ethereum - after consolidating for the past four years - is once again retesting the previous all time high. And before we will witness another bearish rejection, Ethereum has the chance to finally break out of the long term triangle pattern. It's time for us to start praying.
📝Levels to watch:
$4.000
SwingTraderPhil
SwingTrading.Simplified. | Investing.Simplified. | #LONGTERMVISION

Ethereum Price Aims at $5,000 As Exchange Balance Falls To 9-YeaBINANCE:ETHUSDT is currently priced at $4,531 , positioned just above the $4,500 resistance. The broader indicators, suggest a favorable environment for a breakout. On-chain data highlights a key trend supporting Ethereum’s macro outlook.
Exchange balances have dropped to a nine-year low of 14.88 million BINANCE:ETHUSDT , signaling that investors are moving their holdings into long-term storage.
If BINANCE:ETHUSDT manages to reclaim $4,500 as support , the uptrend could accelerate. This move would help the cryptocurrency push through the next resistance at $4,749, paving the way for a test of the $5,000 mark.
However, risks remain if investor sentiment shifts suddenly. Should holders decide to secure profits, BINANCE:ETHUSDT could slide toward $4,200 or even $4,000 . Such a decline would weaken the bullish thesis, opening the door to consolidation instead of continuation of the current uptrend.

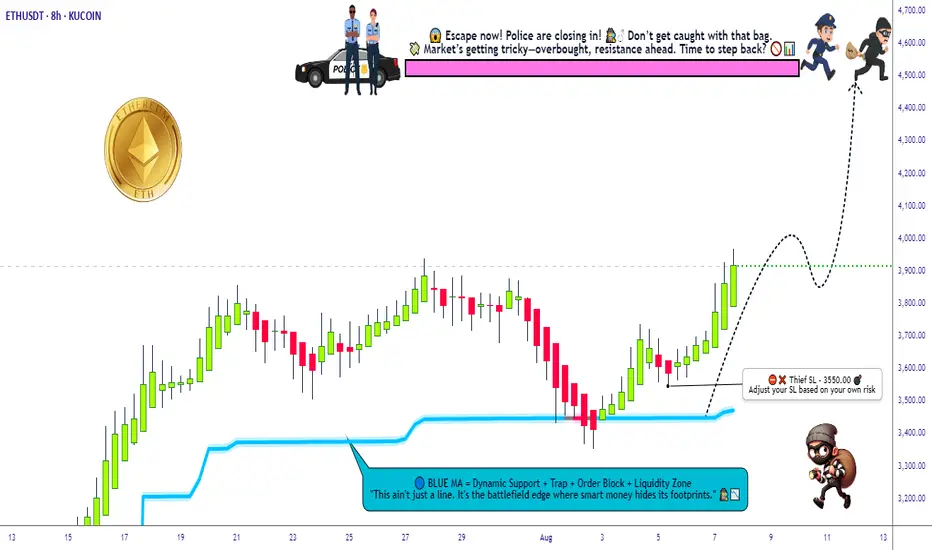
ETH/USDT Grid Plan » Bullish Loadout » Stealing the Top🚨ETH/USDT Crypto Heist Plan 🔓💰
Asset: ETH/USDT "Ethereum vs Tether"
Plan: 🟢 Bullish – Multi-Layered Entry Grid
Strategy: Thief-style limit orders (GRID / DCA stacking)
Entry: Any Dip is a Heist Opportunity 💸
Stop Loss: 🔻 3550.00
Target: 🎯 4500.00
👋 Hey Thieves & Money Makers!
Get your gear ready – it's time to loot the Ethereum Vault 💎🚀
🔥Thief Trader's ETH/USDT Master Robbery Blueprint🔥
This ain’t your average plan — we break in with layered entries, lock in on breakout volatility, and ride the bullish train to the moon 🌕.
💼 Entry Strategy:
No need to overthink. Any dip = loot zone!
Stack multiple limit orders like a pro (15M–1H level).
We're playing the grid game. The more dips, the bigger the stash! 🧱🪙
🚨 Stop Loss:
Set SL at 🔻3550 or under recent swing lows.
Adjust by risk appetite and how many entries you stack.
Thieves don’t chase – they calculate risk.
🎯 Target Zone:
We're eyeing the 4500 mark. But remember – exit before the vault shuts if momentum slows. 🏃♂️💨💰
🔁 Scalpers Alert:
Only long. Only bullish. Only profit. 🧲💥
Stack it, trail it, and let it run with a sniper's precision. 🎯🧠
📊 Market Context:
ETH bulls gaining control post-accumulation.
Strong on-chain metrics, solid macro tailwinds.
Bears trapped in the shadows – we move in daylight. 🐂🆚🐻
📰 Warning – News Bombs Ahead!
💣 Avoid fresh positions during high-impact events.
🎯 Use Trailing SLs to protect your loot.
Smart robbers never get caught unguarded.
💥BOOST This Idea if you're part of the robbery crew 🔐💰
Every boost powers our next move.
Let's rob the crypto market together – one breakout at a time! 🏴☠️📈🤑
Thief Trader™ – Locking Targets. Looting Charts.
💎🕵️♂️📊 #CryptoHeist #ThiefStyle #ETHBreakout #GridGang #BullMode
ETH/USD: Ethereum on the Edge of History!Ethereum recently surged over 50% in the last month, currently trading near $4,700, approaching its all-time high of ~$4,868 from November 2021.
Weekly momentum remains strong; Ethereum is riding a bullish channel. Some technical indicators hint at potential overbought conditions, but these can persist in strong rallies.
*Support lies between $4,400–4,500, with more substantial support around $4,145 and down to $3,800–3,700 in case of deeper pullbacks
*Most indicators point toward a continuation of the bullish channel, with potential for slight corrections as Ethereum tests key resistance levels.
Ethereum is currently in a strong bullish phase, trading near its all-time high, with momentum supported by institutional inflows, regulatory clarity, and recent protocol upgrades. Short-term projections suggest a possible breakout above $4,800, with targets between $5,200 and $6,000 in the coming weeks. By the end of 2025, most forecasts see ETH reaching at least $7,500, while more aggressive scenarios point toward $10,000 or higher.
In the longer term, Ethereum’s expanding role in stablecoins, decentralized finance, and institutional adoption could drive substantial price appreciation, with major banks forecasting $25,000 by 2028 and some optimistic models aiming for $40,000+ by 2030. However, this growth path is not without risks; potential market corrections, regulatory changes, and competition from other blockchain platforms could affect momentum.
Overall, Ethereum remains one of the most promising digital assets in the crypto market, with both technical and fundamental factors aligning for continued growth, provided broader market sentiment stays positive.

Ethereum ETH Pullback Into Support Could Lead to Another Rally📊 Taking a close look at ETH/USDT, the market has recently shown bullish intent after a break of structure on the daily 📈. From a Wyckoff perspective, price is currently reaching into a key resistance zone. Im looking for a retrace into support and, potentially forming an accumulation phase. I’ll be watching for a shakeout below support — followed by a strong rally. If this confirms with a bullish market structure break, it could offer a high-probability long setup 🔍💡🚀 (not financial advice).

Ethereum inches toward $5K as Standard Chartered sees $7,500Ethereum inches toward $5K as Standard Chartered sees $7,500 in 2025
Apparently Standard Chartered has sharply raised its year-end 2025 price forecast for Ethereum to $7,500, according to reports from crypto news outlets including CryptoRank and BlockNews.
ETH recently broke above $4,000 and is now just 5% away from the $5,000 mark, which would set a new all-time high.
On the 30-minute chart, price is holding in a tight range near recent highs, showing that buyers are potentially still in control but lacking immediate momentum. Short-term support might sits around $4,650, with stronger support near $4,580.
Looking beyond 2025, Standard Chartered reportedly expects Ethereum to continue climbing, projecting $12,000 in 2026, $18,000 in 2027, and $25,000 by 2028.

ETHUSDT, Is it time for the biggest Altcoin?Hi fellow traders, ETHUSDT will be ready to make a move higher from the blue box after it completes the flag correction in ABC formation. Target will be 3429.75. Good luck and trade safe!

Can ETH Reach $8,500 Amidst Bullish Catalysts and Threats?A confluence of unprecedented institutional buying, feverish derivatives activity, and bullish technical patterns has ignited the Ethereum market, propelling its price to multi-year highs and sparking bold predictions of a surge to $8,500 and beyond. This rally, however, is not without its skeptics, who point to signs of overheating, increasing profit-taking, and the ever-present shadow of a market cycle peak.
The world's second-largest cryptocurrency has been on a tear, with its price climbing significantly in a single month and nearing its all-time high. This powerful upswing has shifted the crypto world's focus away from a rangebound Bitcoin, raising questions about the mechanics of this bull run, its sustainability, and the myriad of forces pulling the price in opposite directions.
The Bull Case: A Perfect Storm of Institutional FOMO and Technical Breakouts
At the heart of the current rally is a tidal wave of institutional capital, a force that has fundamentally reshaped the market landscape. The recent launch of spot Ethereum Exchange-Traded Funds (ETFs) has been a resounding success, with reports indicating substantial net inflows on single trading days. This influx of "big money" provides a stark contrast to previous retail-driven rallies, suggesting a more stable, long-term buying pressure.
Leading this charge is one major institutional player, a technology firm chaired by a prominent Wall Street strategist. In a move that has drawn comparisons to aggressive corporate Bitcoin accumulation strategies, the firm has announced plans to expand its equity offering to a colossal sum, with the proceeds earmarked for further Ethereum purchases. The firm, already one of the largest corporate holders of Ethereum, is aiming to control a remarkable percentage of the total ETH supply. This monumental buying pressure from a single entity is a powerful bullish signal, fueling what some analysts have described as a price action that is "defying gravity."
The institutional appetite extends beyond this single entity. The total amount of Ether held by companies with crypto treasuries has surged. Simultaneously, Ethereum held on exchanges has dropped to a multi-year low, a bullish indicator that suggests investors are moving their assets into long-term storage with no immediate intention to sell.
This institutional fervor is underpinned by a compelling technical picture. Analysts have identified a rare but powerful chart pattern on Ethereum's daily chart that has been developing for months. This setup is characterized by a horizontal resistance level and a downward-sloping support line, indicating increasingly aggressive buying on each dip. A decisive breakout above this resistance, according to technical analysis principles, could initially target higher price levels, with stronger momentum potentially extending the rally significantly. Other optimistic projections see Ethereum potentially reaching even higher valuations, with some analyses pointing to a fractal pattern that mirrors Bitcoin's previous bull runs.
The Derivatives Dilemma: Record Highs and Muted Enthusiasm
The derivatives market paints a more complex and, in some ways, contradictory picture. Ether futures open interest has soared to an all-time high, with the monthly trading volume on institutional-grade exchanges hitting record levels. This surge in activity, particularly from platforms favored by institutional investors, undeniably signals heightened interest and preparation for volatility.
However, a closer look at the data reveals some nuances. The record open interest, when denominated in US dollars, is largely a function of the rising price of ETH itself, rather than a massive influx of new leveraged positions. In fact, open interest measured in ETH terms remains below its previous peak.
Furthermore, derivatives data suggests a surprisingly subdued appetite for leveraged bullish bets. The annualized premium for ETH perpetual futures has been hovering around a neutral level, below what would typically indicate strong demand for leveraged longs. This could be interpreted in two ways: either the rally is being driven more by spot buying and has a more solid foundation, or there is a lack of conviction among speculative traders about the sustainability of the current price levels.
The Bearish Counterpoint: Profit-Taking, Historical Cycles, and Competitive Threats
As Ethereum's price tiptoes near its previous highs, signs of profit-taking are beginning to emerge. On-chain analytics show that short-term holders, in particular, are ramping up their selling to realize gains. While long-term holders remain relatively steadfast, daily profit realization has climbed. With a vast majority of all Ether addresses now in a state of profit, the temptation to sell could create significant headwinds, potentially slowing the ascent.
Adding to the cautionary tone is analysis from some market experts who have advised investors to consider selling their Ethereum holdings by the autumn. Citing the psychology of market cycles, one analysis suggests that the current "Optimism" phase is likely to transition into a "Market Peak/Euphoria" phase, which is historically followed by a swift and brutal correction. This perspective predicts that Bitcoin could show signs of topping out first, with Ethereum following suit, potentially leading to a significant price collapse for ETH. The short-term target in this scenario lies in a range substantially higher than current prices, but would precede this potential downturn.
Beyond immediate market sentiment, Ethereum faces long-term strategic challenges. Its dominance in the decentralized finance (DeFi) space is being contested by a growing number of independent layer-1 blockchains that offer faster transactions and lower fees. Major corporations and traditional finance entities are increasingly favoring these proprietary chains for their own blockchain projects, seeking greater control and customization. This trend is reflected in on-chain metrics, with Ethereum's total value locked (TVL) showing a decline and its weekly base layer fees lagging behind some competitors.
Ethereum vs. Bitcoin: The Flippening Narrative Resurfaces
For much of the recent crypto market action, Bitcoin has been in a state of consolidation. This has allowed Ethereum to take the spotlight, with ETH significantly outperforming BTC in recent weeks. This divergence has reignited discussions of "The Flippening," the hypothetical moment when Ethereum's market capitalization surpasses Bitcoin's.
The bull case for Ethereum's outperformance hinges on its utility as a programmable platform for DeFi, NFTs, and a host of other decentralized applications. This contrasts with Bitcoin's primary role as a store of value. The massive institutional inflows into Ethereum, both through direct purchases and ETFs, are seen as a validation of its long-term potential beyond a simple inflation hedge.
However, some Bitcoin proponents argue that the current ETH/BTC rally is an engineered market event. They allege that influential players are rotating their Bitcoin holdings into Ethereum to inflate its price based on the corporate treasury narrative, only to later sell their ETH and convert the profits back into Bitcoin.
Conclusion: A High-Stakes Balancing Act
Ethereum stands at a pivotal juncture. The powerful narrative of institutional adoption, exemplified by audacious corporate accumulation strategies, combined with bullish technical indicators, provides a credible path towards ambitious price targets. The influx of capital through ETFs and the growing recognition of Ethereum's role as the backbone of Web3 are formidable tailwinds.
However, the journey is fraught with peril. The specter of a cyclical market top, as articulated by some analysts, cannot be ignored. The increasing profit-taking by short-term holders, the ambivalent signals from the derivatives market, and the persistent competition from other layer-1 blockchains are all significant hurdles that could stall the rally.
Whether Ethereum will surge to new all-time highs and beyond or succumb to the pressures of an overheated market remains to be seen. The coming weeks will be crucial in determining if the current bull run has the legs to defy historical patterns and establish a new paradigm for the world's leading smart contract platform. For now, the market remains in a delicate, high-stakes balancing act, with the potential for both explosive gains and sharp, unforgiving corrections.

Ethereum (ETH) Price Hits 3.5 Year High; Nears ATH Of $4,891BINANCE:ETHUSDT is approaching a significant milestone in August, trading at $4,182, a 3.5-year high . The altcoin breached the $4,000 mark over the weekend, setting its sights on the next target of $4,891. This strong upward momentum suggests Ethereum could make history if it sustains its growth.
At $4,303, BINANCE:ETHUSDT is 17% away from its all-time high (ATH) of $4,891 . To reach this ATH, ETH must first secure $4,500 as a stable support level. A successful consolidation above this threshold could set the stage for ETH to continue its bullish ascent towards the ATH.
However, if investor sentiment shifts and selling pressure increases, BINANCE:ETHUSDT could struggle to maintain its position above $4,000 . A decline below this level would invalidate the bullish outlook, potentially reversing the recent gains and sending ETH lower.

Breaking: Ethereum Is Set To Reclaim the $5k Price Pivot The price of the notable Altcoin- Ethereum ( CRYPTOCAP:ETH ) is set to reclaim the $5k resistance amidst growing interest and buying momentum.
For the past 3 months Ethereum ( CRYPTOCAP:ETH ) spiked 200+% breaking out from a cup and handle pattern amidst growing interest ikn the Ethereum chain.
Crypto Pundits on X, LinkedIn and Discord envisage the influx of memecoins on the Ethereum ( CRYPTOCAP:ETH ) chain- while most skeptics think the layer 1 blockchain is dead, Ethereum's sojourn to the $5k pivot is just days away as popular folks like Eric Trump the son of the present president of USA hints on investor's to buy Ethereum's dip.
As of the time of writing, CRYPTOCAP:ETH is up 0.58% already breaking the $4k resistance trading at $4276. With the Relative strength Index (RSI) at 71, CRYPTOCAP:ETH is on the verge of reaching overbought region. CRYPTOCAP:ETH might experience a respite before picking momentum up.