ETH: Trying to go long.We both took and captured liquidity. The picture looks good.
The RSI for 1, 2, 3, and 4 hours is in the oversold zone. There is a high chance of a rebound.
Our first goal is to correct the short imbalance at approximately $3,100 and move the stop to break even. If we stand on the short imbalance and go down, the price will most likely go down to the lows again.
Good luck, everyone! Use competent risk management.
BINANCE:ETHUSDT.P
Ethereumprice

Is ETH About to Drop Hard?From my perspective, ETHUSDT is showing clear weakness when combining the latest news with the current price action on the chart.
In the final days of November, the USD strengthened and risk-off sentiment spread across the crypto market , causing liquidity to stall. ETH had no positive catalysts , and multiple reports showed that price continued to remain “stuck” below the 3,000–3,100 USD zone — an environment that leans more toward downside than upside.
On the H4 chart, the 3,100 USD zone has become extremely strong resistance . ETH has been repeatedly rejected at the descending trendline — exactly the same pattern as previous reversals. Buying pressure is very weak , showing the market is not ready for a breakout.
Ichimoku also leans bearish: price is below the cloud , the future cloud is thin and sloping downward , signaling weak bullish momentum. The lower-highs, lower-lows structure further reinforces the downside bias.
If ETH continues to be rejected at 3,100, the highest-probability scenario is a pullback toward 2,950–2,980, before potentially dropping further. A very achievable target is 2,870 USD, which aligns with the support zone shown on the chart. If the market weakens further, the 2,750–2,800 zone may also be retested.

ETHUSDT: Pullback to 2,900 Before the Next DropLooking at the current price action, ETH is showing the classic signs of a weak market : shallow pullbacks, weak buying pressure , and repeated rejections at key resistance zones. Everything suggests ETH is simply taking a short pause before the next leg down.
On the H4 timeframe, price remains firmly inside the descending channel drawn on the chart. Every time ETH touches the upper boundary of the channel, it gets sold off aggressively — a pattern that has repeated consistently. The 2,900 USDT area above now acts as a confluence resistance zone: it aligns with the channel’s upper boundary and a corrective structure — the perfect place for sellers to step in.
At the moment, ETH is making a minor pullback to retest the 2,900 region, but buying momentum is fading and candles are being pushed down repeatedly. This indicates that a bearish reversal is likely forming. Once rejection confirms, the nearest target is the 2,650 support zone. If bearish momentum accelerates, ETH could slide further toward 2,550.
Reference Scenario
Main Trend: Bearish
Strategy: Wait for ETH to retest 2,900 and SELL
Targets: 2,650 – 2,780 → deeper target: 2,550

ETH Breaks Structure! Are the Bears Back in the Race?Ethereum (ETH) is entering a sensitive phase as overall market sentiment turns more cautious following recent declines across the crypto market. While it remains the leading platform for tokenization and DeFi, short-term selling pressure is becoming increasingly evident — especially as speculative capital shifts toward safer assets.
On the daily chart, ETHUSDT remains inside a medium-term descending channel , with every rebound quickly rejected at the dynamic resistance line. Price is currently trading around $3,480, signaling a weak recovery attempt while momentum remains trapped below the Ichimoku cloud.
The current scenario suggests that ETH could retest the $3,800 resistance zone before continuing its move lower toward $2,900 and $2,500 — both aligning with the lower boundary of the channel and a strong support area from previous price action.
Overall, the primary trend remains bearish , and any short-term bounce is likely just a technical pause before renewed selling pressure. In the short run, the bears are clearly still in control.
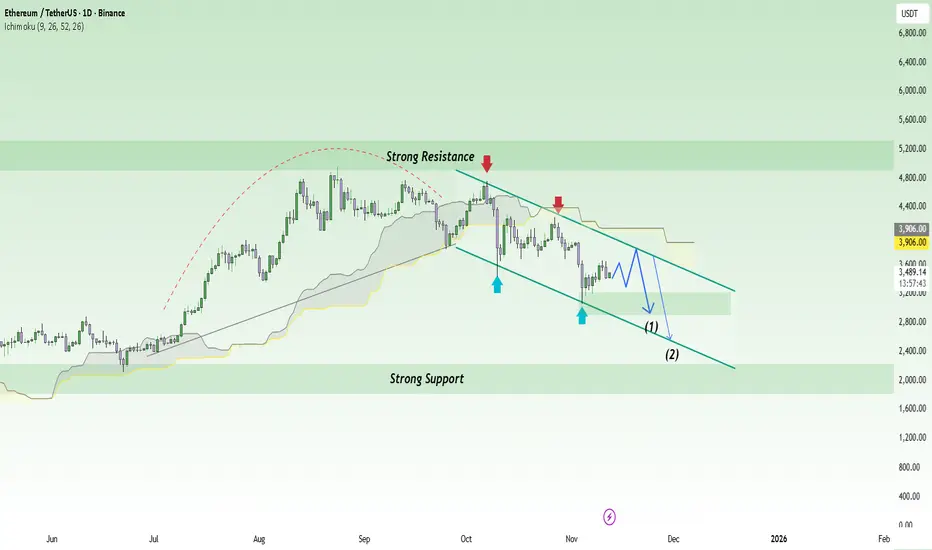
ETH/USDT – Ethereum’s Downtrend May ContinueAlthough Ethereum saw a slight recovery on October 14th, it remains under significant pressure from US-China trade tensions, negatively impacting the financial markets and Ethereum’s value. The US imposing 100% tariffs on Chinese goods, along with retaliatory measures from China, has raised concerns about global economic stability. These factors have pushed ETH/USDT down to a low of $3,893.
The chart shows that Ethereum is trading within a clear downtrend channel, with $4,130 acting as a strong resistance level. After hitting this resistance, Ethereum may continue to decline towards $3,530 in the coming days if there is no positive shift in the fundamental factors.
With the market still uncertain and US-China trade tensions unresolved, Ethereum is likely to remain under downward pressure in the short term.

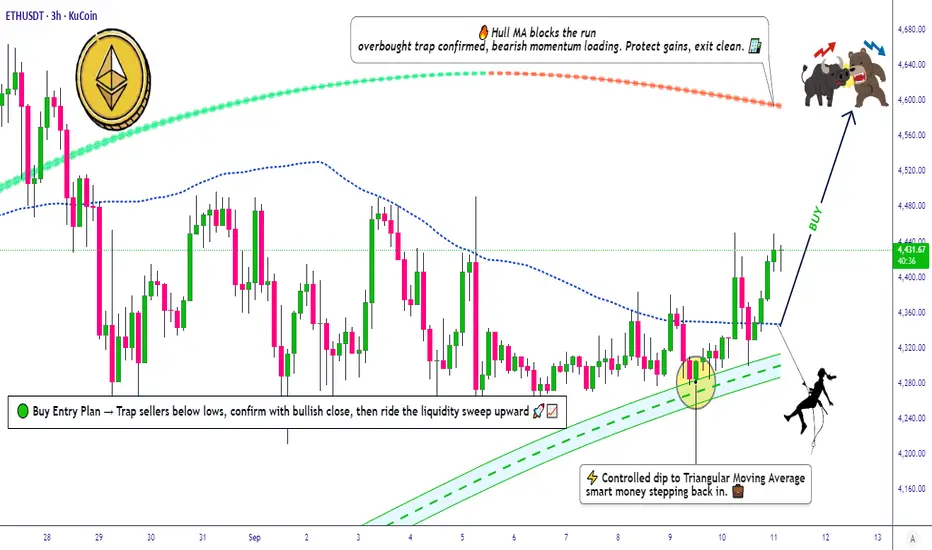
ETH/USDT Technical Roadmap | Bullish Swing & Day Trade Levels📌 ETH/USDT "Ethereum vs Tether" Crypto Market Plan (Swing/Day Trade)
🔹 Plan: Bullish (Pending Order Breakout Plan)
We are preparing for a breakout setup around 10.000⚡ TRIANGULAR MOVING AVERAGE BUY PLAN.
Price action shows strong buyer strength with signs of institutional accumulation on dips.
🛠️ Thief Strategy (Layered Entry Style)
This strategy uses multiple limit orders (layering method) after breakout confirmation.
✅ Example buy limit layers (can be adjusted to your own risk):
4350
4370
4390
4420
👉 Please set a TradingView alert near the breakout level so you don’t miss confirmation.
🛑 Stop Loss (Risk Management)
📍 Suggested risk level: 4300 (after breakout confirmation)
This is the Thief SL reference point, but remember:
Adjust your SL based on your personal risk tolerance & strategy.
🎯 Target (Profit Zone)
Price may face resistance near moving averages with possible overbought traps.
📍 Planned exit zone: 4600
Manage your own TP — use targets that fit your risk/reward ratio.
🔗 Related Pairs to Watch
BINANCE:BTCUSDT – Bitcoin breakout strength often leads ETH moves.
BINANCE:ETHBTC – Key ratio showing ETH’s relative strength vs BTC.
BINANCE:SOLUSDT – High-beta crypto that often correlates with ETH sentiment.
BINANCE:BNBUSDT – Another major altcoin for cross-market momentum comparison.
✨ “If you find value in my analysis, a 👍 and 🚀 boost is much appreciated — it helps me share more setups with the community!”
#ETH #ETHUSDT #Ethereum #Crypto #SwingTrade #DayTrade #BreakoutStrategy #LayeredEntries #CryptoTrading #TradingPlan
ETHEREUM HIGH PROBABILITY SETUP SOON!!!🚨 ETHER HIGH PROBABILITY BUY SETUP 🚨
* Here We Can See Clearly The Next Potential Moves For ETHUSD Coming Hours/Days.
* Keep Your Eyes Close On Your Trading Positions.
* Happy PIP Hunting Traders.
FXKILLA.

ETHER HIGH PROBABILITY SETUP SOON!!!🚨 ETHUSD HIGH PROBABILITY BUY SETUP 🚨
* Here We Can See Clearly The Next Potential Move For Ethereum Coming Hours/Days.
* Keep Your Eyes Close On Your Trading Positions.
* Happy PIP Hunting Traders.
FXKILLA.

$8 Billion ETH Maturing May Push Ethereum Price to New HeightsEthereum is currently trading at $4,495, just below the $4,500 support line. If the decline extends, ETH may slip toward $4,307, but deeper losses appear less likely given the strong investor positioning.
The maturing supply and bullish long-term outlook indicate that Ethereum could soon reverse course. With fewer coins entering circulation, the altcoin has structural support for renewed upward momentum despite short-term volatility.
If Ethereum reclaims $4,500 as support, the path to $4,775 opens. A move past this level would invalidate the bearish thesis, reinforcing confidence that ETH could continue its climb toward new highs

Ethereum Breaks $4K — Eyes on $5K and BeyondEthereum has been the top-performing asset since the April 7 low, breaking through resistance and solidifying its position as the backbone of the stablecoin ecosystem. The trend remains firmly bullish as long as ETH continues its pattern of higher highs and higher lows.
The breakout above the $4,000–$4,200 zone turned former resistance into new support, giving bulls the upper hand. Momentum now shifts toward retesting the former all-time high region at $4,800–$5,000, with upside potential extending into the next cycle.
📈 Technical Highlights:
✅ Short-term resistance: $4,800–$5,000 (former ATH)
✅ Medium-term target: $7,000 baseline
✅ Extended objective: $8,000 possible
🛡️ Key support: $4,000–$4,200 (new floor)
📣 Takeaway:
Ethereum’s structure remains a textbook bullish setup. As long as it holds above $4,000, the path favors further upside. Breakouts above $5,000 could fuel the next leg higher, while current levels may offer strong opportunities for trend-followers and long-term investors.
#Ethereum #ETH #Crypto #Trading #TechnicalAnalysis #EthereumPrice #Bullish #CryptoTrading #Altcoins #Breakout

Ethereum Price Aims at $5,000 As Exchange Balance Falls To 9-YeaBINANCE:ETHUSDT is currently priced at $4,531 , positioned just above the $4,500 resistance. The broader indicators, suggest a favorable environment for a breakout. On-chain data highlights a key trend supporting Ethereum’s macro outlook.
Exchange balances have dropped to a nine-year low of 14.88 million BINANCE:ETHUSDT , signaling that investors are moving their holdings into long-term storage.
If BINANCE:ETHUSDT manages to reclaim $4,500 as support , the uptrend could accelerate. This move would help the cryptocurrency push through the next resistance at $4,749, paving the way for a test of the $5,000 mark.
However, risks remain if investor sentiment shifts suddenly. Should holders decide to secure profits, BINANCE:ETHUSDT could slide toward $4,200 or even $4,000 . Such a decline would weaken the bullish thesis, opening the door to consolidation instead of continuation of the current uptrend.

Ethereum inches toward $5K as Standard Chartered sees $7,500Ethereum inches toward $5K as Standard Chartered sees $7,500 in 2025
Apparently Standard Chartered has sharply raised its year-end 2025 price forecast for Ethereum to $7,500, according to reports from crypto news outlets including CryptoRank and BlockNews.
ETH recently broke above $4,000 and is now just 5% away from the $5,000 mark, which would set a new all-time high.
On the 30-minute chart, price is holding in a tight range near recent highs, showing that buyers are potentially still in control but lacking immediate momentum. Short-term support might sits around $4,650, with stronger support near $4,580.
Looking beyond 2025, Standard Chartered reportedly expects Ethereum to continue climbing, projecting $12,000 in 2026, $18,000 in 2027, and $25,000 by 2028.

Ethereum (ETH) is setting up for a powerful moveFollowing a strong breakout, ETH has entered a healthy consolidation phase—setting the stage for its next leg higher.
Momentum remains firmly on the bulls’ side, with the breakout from a long-term saucer pattern fueling continued upside pressure.
📈 Technical Highlights:
✅ Short-term target: $4,000+ (breakout continuation)
✅ Long-term potential: $7,000+
🛡️ Key support: $3,000–$3,200 (bullish as long as this holds)
📣 Takeaway:
Ethereum is showing classic bullish structure. With higher-lows forming and strong support below, pullbacks are likely to offer high-probability entries for both traders and long-term holders.
#Ethereum #ETHUSD #Crypto #Trading #TechnicalAnalysis #CryptoTrading #EthereumPrice #Altcoins #Bullish #Breakout
Ethereum Eyes $8K After Bullish BreakoutEthereum (ETH) is setting up for a powerful move. After hitting a multi-month high last week, ETH pulled back into a higher-low formation—strengthening the newly established bullish trend.
Money flow is shifting: with recent crypto legislation, Ethereum is now benefiting even more than Bitcoin, marking a notable change in market dynamics.
📈 Technical Highlights:
✅ Short-term target: $4,800–$5,000 (new all-time highs)
✅ Long-term potential: $7,000–$8,000
🛡️ Key support: $2,800–$3,000 (bullish as long as this holds)
📣 Takeaway:
Ethereum’s trend is firmly bullish. As long as support holds, pullbacks could offer strong entry opportunities for both swing traders and long-term investors.
#Ethereum #ETHUSD #Crypto #Trading #TechnicalAnalysis #CryptoTrading #EthereumPrice #Altcoins #Bullish #Breakout

Ethereum: Breakout Holds Strong | Next Targets $4K, $7K+Last week, three major crypto bills cleared the U.S. House of Representatives—and Ethereum (ETH) is emerging as the biggest winner from this legislative momentum.
ETH recently broke out of a rounding bottom pattern and hasn’t looked back. Momentum continues to build, and it’s now outperforming most other major assets.
📈 Technical Highlights:
✅ Short-term target: $4,000
✅ Long-term potential: $7,000–$8,000
🛡️ Key support: $2,700–$2,800 (bullish as long as this holds)
📣 Takeaway:
Ethereum’s breakout remains intact. Pullbacks into support could offer high-probability setups for swing traders and long-term investors.
#Ethereum #ETHUSD #Crypto #Trading #TechnicalAnalysis #CryptoTrading #EthereumPrice #Altcoins #Bullish #Breakout

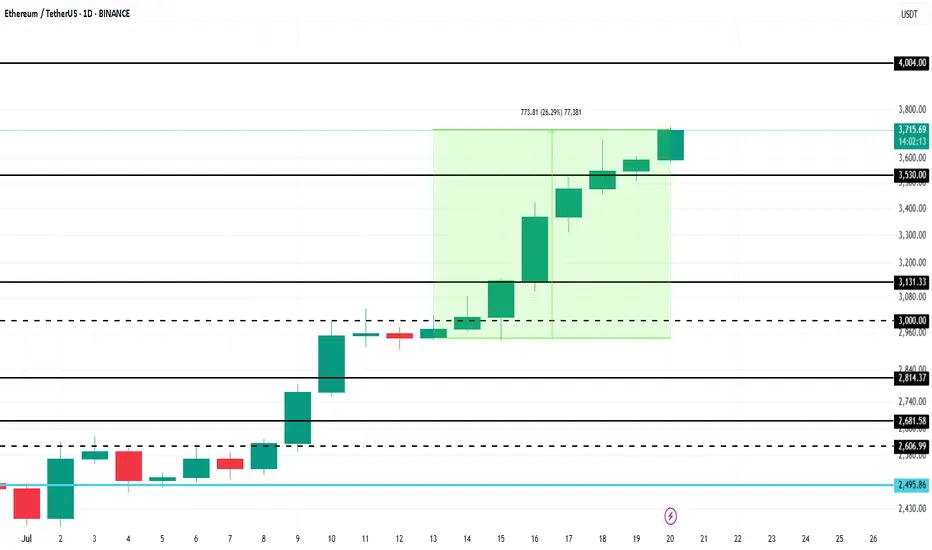
Ethereum Price Hits 6-Month High, Up Next $4,000BINANCE:ETHUSDT has managed to navigate recent market volatility with significant support from investors. As companies increasingly mirror Bitcoin’s corporate treasury use case, Ethereum is gaining traction.
BINANCE:ETHUSDT price surged 26% over the past week , reaching $3,715 and marking a 6-month high. The rally strengthened after ETH formed a Golden Cross last week. With this bullish momentum, Ethereum is now targeting $4,000 in the coming days, benefiting from investor confidence and growing institutional interest.
However, if BINANCE:ETHUSDT bullish momentum weakens and investors opt to sell, the price could decline to $3,131 . This would erase recent gains and invalidate the current bullish outlook.
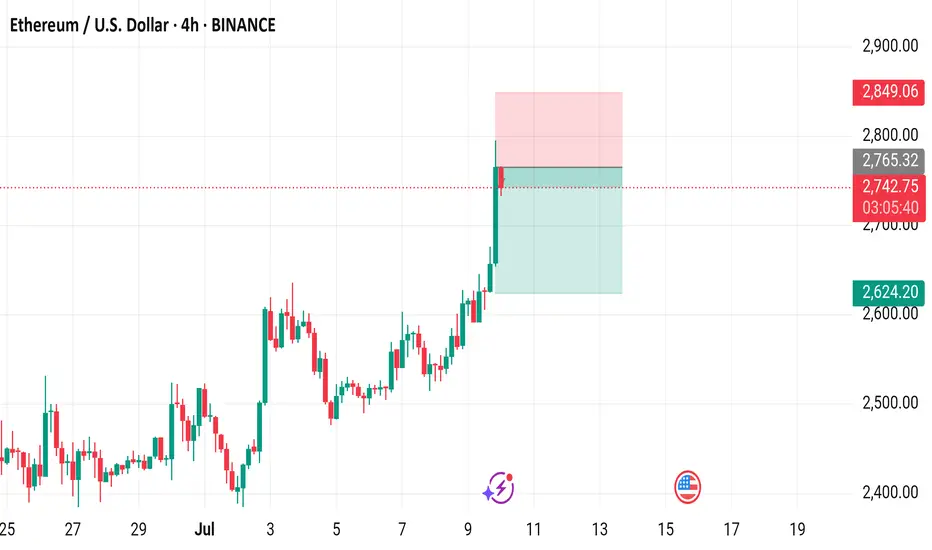
Ethereum / U.S. Dollar 4-Hour Chart (BINANCE)4-hour candlestick chart displays the price movement of Ethereum (ETH) against the U.S. Dollar (USD) on the BINANCE exchange. The current price is $2,740.99, reflecting a +$124.74 increase (+4.77%) in the last period. The chart includes a buy/sell indicator with no current activity (0.00), a resistance zone highlighted in pink, and a support zone in light green. The price has recently surged, breaking through the $2,740.99 level, with additional price points ranging from $2,400.00 to $2,949.06 shown on the right axis. The time frame spans from late June to July 10, 2025.
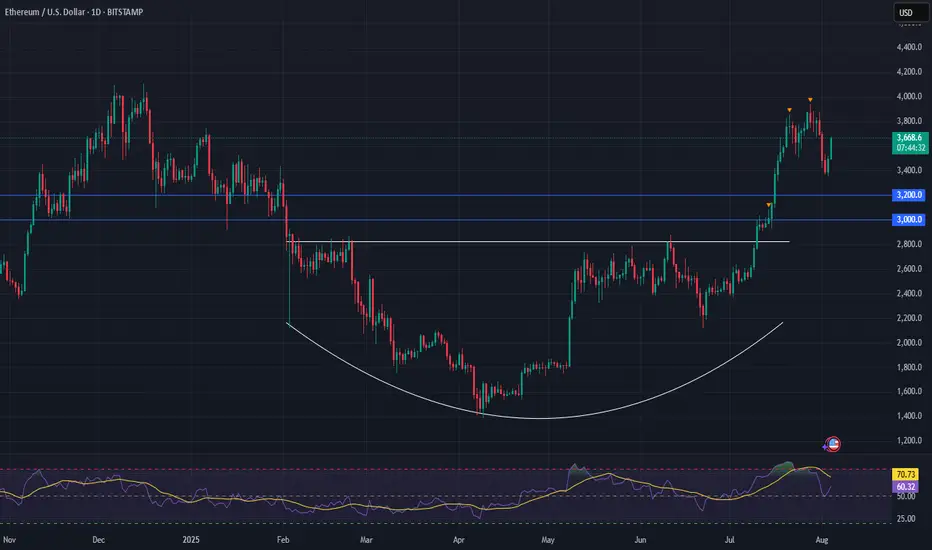
Ethereum: Eyeing New Highs?Ethereum has surged recently and continues rising in turquoise wave B. The next target is a break above the June high, with potential upside to resistance at $4,107. A direct breakout above this level (27% probability) would suggest green wave alt. ended in April. However, our main scenario expects a reversal below $4,107, with turquoise wave C likely dragging ETH into the Long Target Zone between $935.82 and $494.15 to complete wave .
📈 Over 190 precise analyses, clear entry points, and defined Target Zones - that's what we do.

ETH/USDT Price Action Analysis — Bullish Continuation Expected 📊 ETH/USDT Price Action Analysis — Bullish Continuation Expected 🚀
🔍 Chart Overview (as of June 9, 2025):
This chart of ETH/USDT highlights a well-defined support and resistance structure, projecting a potential bullish move toward a main resistance target at $2,788.00.
🧱 Key Zones:
🔵 Support Zone: $2,440 – $2,480
Price rebounded strongly from this area, showing buyer interest and liquidity absorption.
🟠 Resistance Zone: $2,660 – $2,690
Previously rejected zone where supply overtook demand. Price must break and hold above this for further upside.
🔺 Main Resistance Target: $2,788.00
If resistance is cleared, this is the next major supply area, acting as a potential take-profit level.
📈 Price Action Insight:
Price is currently hovering near $2,538.37, approaching resistance.
The chart suggests a potential breakout scenario after a short consolidation.
A bullish breakout above $2,690 could trigger a sharp rally toward the $2,788 target.
The chart projects a pullback-retest pattern (break, retest, and continuation) before the final leg up.
⚠️ Risk Management:
Invalidation Level: $2,381.49
A break below this level would invalidate the bullish setup and could lead to further downside.
✅ Summary:
Bias: Bullish 📈
Entry Area: Break and retest above resistance zone ($2,660–2,690) 🔓
Target: $2,788 🎯
Invalidation: Below $2,381.49 🚫
📌 Note: Always use proper risk management and confirm breakouts with volume or momentum indicators (e.g., RSI, MACD).

ETH Breakout Setup: Eyeing $2,550 Target!"Key Observations:
Strong Support Level: ETH has bounced from a strong support zone around $1,792 - $1,905.
Retest & Buy Zone: Price has broken above a key level and is now retesting it, indicating a potential buy opportunity.
Resistance Zone: A key resistance zone is marked near $2,557.71.
Target Levels: The first target is set at $2,557.71, with a possible further extension to $2,854.38.
Bullish Confirmation: If ETH maintains support above $1,981, the uptrend towards the target is likely.
Trading Idea:
Entry: Buy on successful retest.
Stop Loss: Below the strong level at $1,905 - $1,792.
Take Profit: First target at $2,557.71, extended target at $2,854.38.
This setup follows a classic breakout and retest strategy, suggesting bullish momentum if Ethereum sustains above key levels.

Ethereum Analysis Ethereum Analysis
Ethereum is currently exhibiting a pattern similar to the one observed in Shiba Inu, with a clear downtrend that has led to the breakdown of a key support level. As of now, it seems to be retesting this broken support, though confirmation will only be possible once the current candle closes.
In my opinion, patience is critical in this scenario, and it would be wise to wait for the candle to close before considering any short positions. The broader trend still appears to be bearish, suggesting that Ethereum may not have exhausted its downward momentum just yet. However, market dynamics can shift rapidly, and it is important to remain vigilant and adapt to new information as it unfolds.
I would appreciate your thoughts on Ethereum's current price action and whether you agree with the assessment of a potential continuation of the downtrend. As always, thorough analysis, risk management, and due diligence are essential before making any trading decisions.
Cheers!

ETHEREUMUSDT | Risky Hedge ShortIn our previous ETHUSDT analysis, we mentioned the importance of the $4102 level and the possibility that our rapid entry into the range with its manipulation could lead to bad possibilities.
The price has entered the range again and continues to fall, but it is not nice that the liquidity remaining above is very open. Still, taking a short hedge is not a bad trade by taking the possibility of a losing 1R from here.
I keep my charts clean and simple because I believe clarity leads to better decisions.
My approach is built on years of experience and a solid track record. I don’t claim to know it all, but I’m confident in my ability to spot high-probability setups.
My Previous Analysis
🐶 DOGEUSDT.P: Next Move
🎨 RENDERUSDT.P: Opportunity of the Month
💎 ETHUSDT.P: Where to Retrace
🟢 BNBUSDT.P: Potential Surge
📊 BTC Dominance: Reaction Zone
🌊 WAVESUSDT.P: Demand Zone Potential
🟣 UNIUSDT.P: Long-Term Trade
🔵 XRPUSDT.P: Entry Zones
🔗 LINKUSDT.P: Follow The River
📈 BTCUSDT.P: Two Key Demand Zones
🟩 POLUSDT: Bullish Momentum
🌟 PENDLEUSDT.P: Where Opportunity Meets Precision
🔥 BTCUSDT.P: Liquidation of Highly Leveraged Longs
🌊 SOLUSDT.P: SOL's Dip - Your Opportunity
🐸 1000PEPEUSDT.P: Prime Bounce Zone Unlocked
🚀 ETHUSDT.P: Set to Explode - Don't Miss This Game Changer
🤖 IQUSDT: Smart Plan
⚡️ PONDUSDT: A Trade Not Taken Is Better Than a Losing One
💼 STMXUSDT: 2 Buying Areas
🐢 TURBOUSDT: Buy Zones and Buyer Presence
🌍 ICPUSDT.P: Massive Upside Potential | Check the Trade Update For Seeing Results
🟠 IDEXUSDT: Spot Buy Area | %26 Profit if You Trade with MSB
📌 USUALUSDT: Buyers Are Active

ETH/USD "ETHEREUM" Crypto Market Heist Plan on Bullish SideHi there! Dear Money Makers & Robbers, 🤑 💰
Based on Thief Trading style technical analysis, here is our master plan to heist the ETH/USD "ETHEREUM" Cryptocurrency market. Please adhere to the strategy I've outlined in the chart, which emphasizes long entry. Our aim is the high-risk Red Zone. Risky level, overbought market, consolidation, trend reversal, trap at the level where traders and bearish robbers are stronger. So Be Careful, wealthy and safe trade.
Entry 📈: Acceptable anywhere; I advise placing buy limit orders within a 15-minute Chart. The entry for the Recent/Nearest Low Point should be in pullback.
Stop Loss 🛑: Using the 4H period, the recent swing low
Goal 🎯: 4600.0
Scalpers, take note: only scalp on the long side. If you have a lot of money, you can go straight away; if not, you can join swing traders and carry out the robbery plan. Use trailing SL to safeguard your money 💰.
Warning : Our heist strategy is incompatible with Fundamental Analysis news 📰 🗞️. We'll wreck our plan by smashing the Stop Loss 🚫🚏. Avoid entering the market right after the news release.
Take advantage of the target and get away 🎯 Swing Traders Please reserve the half amount of money and watch for the next dynamic level or order block breakout. Once it is resolved, we can go on to the next new target in our heist plan.
💖Supporting our robbery plan will enable us to effortlessly make and steal money 💰💵 Tell your friends and family to follow, like, and share. Boost the strength of our robbery team. Every day in this market make money with ease by using the Thief Trading Style.
I'll see you soon with another heist plan, so stay tuned 🫂
