Ethereum - Looking To Sell Pullbacks In The Short TermH4 - Strong bearish move.
No opposite signs.
Currently it looks like a pullback is happening.
Expecting bearish continuation until the two Fibonacci resistance zones hold.
If you enjoy this idea, don’t forget to LIKE 👍, FOLLOW ✅, SHARE 🙌, and COMMENT ✍! Drop your thoughts and charts below to keep the discussion going. Your support helps keep this content free and reach more people! 🚀
Ethereumshort

Ethereum - The bearmarket is not over yet!🪚Ethereum ( CRYPTO:ETHUSD ) can still drop about -30%:
🔎Analysis summary:
Over the past four years, Ethereum has been creating a major bullish triangle. With the recent all time high retest, we are now seeing an expected reversal. But considering the bullish nature of this triangle, Ethereum will head higher after a retest of the next support.
📝Levels to watch:
$2,000
SwingTraderPhil
SwingTrading.Simplified. | Investing.Simplified. | #LONGTERMVISION

ETH/USDT Bearish Roadmap: Structure + MA Break AligningAsset: ETH/USDT — “Ethereum vs Tether”
Market Context: Crypto Market | Swing Trade | Bearish Profit Pathway Setup
📉 Market Outlook: Bearish Plan Confirmed
Ethereum is displaying a bearish continuation structure, with price breaking below the Triangular Moving Average zone, signaling shifting momentum from buyers to sellers. Market structure is weakening, liquidity is building above the recent highs, and major supports remain untested below.
This creates a clean swing-trade opportunity for disciplined traders.
🎯 Trade Plan: Thief Layered Entry Strategy
The plan uses a layered sell-limit approach to capture premium retracement entries.
🧩 Sell-Limit Layers (Short Entry Zones):
1st Layer: 3200
2nd Layer: 3100
3rd Layer: 3000
(Traders may add additional layers depending on preference, liquidity, and volatility.)
Layering helps reduce emotional entry pressure and allows scaling into premium short zones rather than rushing into the move.
🛑 Stop-Loss: Structural SL @ 3300
This is the Thief SL reference level at 3300, positioned above structural liquidity.
Ladies & Gentlemen (Thief OG’s): adjust SL according to your own risk tolerance, capital, and strategy framework.
Risk is personal — protect your account.
🏆 Target Zone: 2700
The downside objective aligns with:
Strong support retest
Oversold region confluence
Trap-pattern breakdown
Correlation pressures across major crypto pairs
Ladies & Gentlemen (Thief OG’s): this is a community target reference — take profit based on your own comfort and risk appetite. Profit is profit.
🔍 Related Pairs to Watch (Correlation Insights)
1️⃣ BTC/USDT ( CRYPTOCAP:BTC )
Bitcoin leads crypto directional momentum.
ETH generally mirrors BTC swings with slightly slower volatility.
If BTC struggles to reclaim resistance zones, ETH downside probability strengthens.
2️⃣ ETH/BTC ( BINANCE:ETHBTC )
Key ratio indicating Ethereum’s strength vs Bitcoin.
ETHBTC downtrend continues → ETHUSD bearish continuation becomes more reliable.
3️⃣ SOL/USDT ( CRYPTOCAP:SOL )
Strong competitor in Layer-1 ecosystem.
SOL weakness often reflects broader market appetite decreasing → ETH follows.
4️⃣ TOTAL2 (Altcoin Market Cap)
Tracks overall strength of altcoins excluding BTC.
Breakdown in TOTAL2 = bearish environment = supports ETH downside targets.
Monitoring these pairs provides confirmation of:
Trend alignment
Market-wide weakness
Strength of bearish momentum
Liquidity flows across majors
✅ Final Notes
This setup is built for traders who prefer structured entries, disciplined layers, clear SL zones, and realistic targets.
Trade smart, manage risk, and follow your own strategy refinement.

EthereumETHUSD
- Bullish Channel as an corrective pattern in Short Time Frame
- Break of Structure
- RSI - Divergence
- Order Block
- S / R Level

Ethereum - Expecting Bearish Continuation In the Short TermH1 - Strong bearish move.
No opposite signs.
Currently it looks like a pullback is happening.
Expecting bearish continuation until the two Fibonacci resistance zones hold.
If you enjoy this idea, don’t forget to LIKE 👍, FOLLOW ✅, SHARE 🙌, and COMMENT ✍! Drop your thoughts and charts below to keep the discussion going. Your support helps keep this content free and reach more people! 🚀
-------------------------------------------------------------------------------------------------------------------

EthereumETHUSD
- Bearish Channel as an corrective pattern in Short Time Frame
- Sell Side Liquidity
- Change of Characteristics
- Completed " 1234 " Impulsive Waves
- Order Block

Ethereum ShortAs U.S. Treasury yields and the U.S. dollar continue to strengthen, The crypto market continues its selloff. I have outlined some key areas where bulls will start to nibble on longs. Shorts are still open for at least another 2% down.

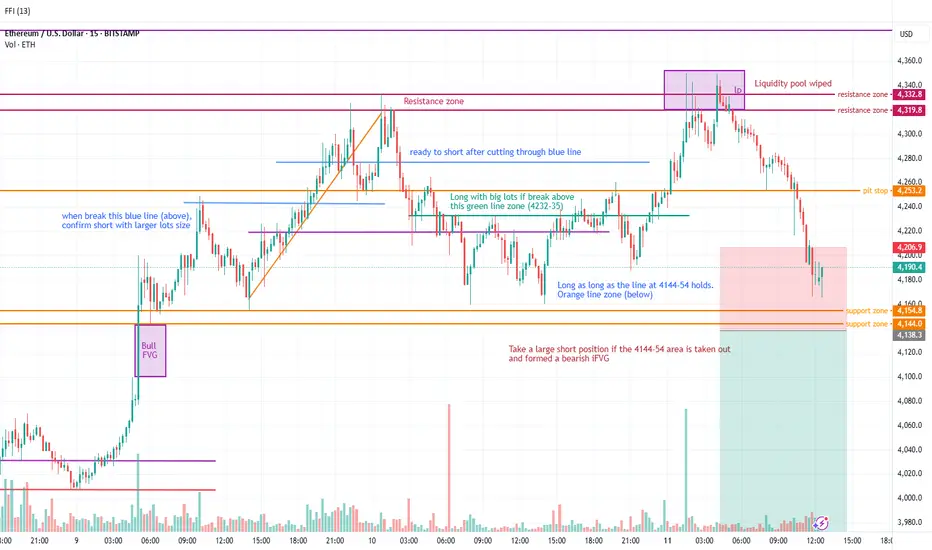
Day trading Ethereum (for both Long and Short)My analysis is based on the price action movement using liquidity pool to identify turnaround or fake manipulation move. Use FVG and iFVG to identify clear confirmation for trend movement. Price action allows me to shed light on the psychology and manipulated movement driven by market maker.
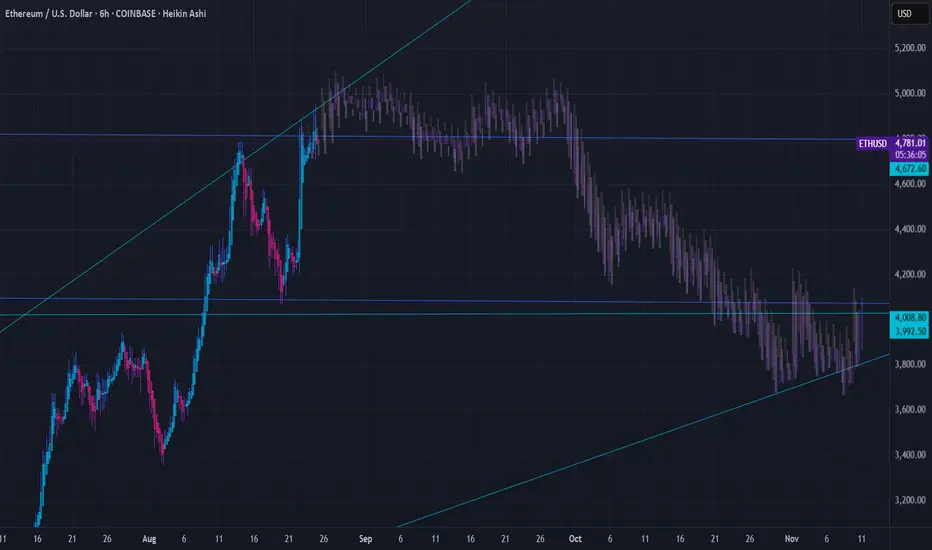
▒𖢻▒ ETHEREUM FORECAST | 6HR ▒𖢻▒COINBASE:ETHUSD
Here's my Forecast for Ethereum on the 6-hour chart. After an incredible run, ETH is now consolidating in a tight range, and the chart is giving us some very clear levels to watch.
Here's my breakdown of the current situation:
The Bullish Case (Consolidation):
ETH is currently holding strong above the key support level at $4,677. As long as we remain above this line, this sideways action looks like healthy consolidation before the next leg up.
The overall structure is still a clear uptrend, defined by the ascending trendline providing support from below.
The Bearish Case (Potential Pullback):
The price is currently below the recent High near $4,950. A failure to break this level could signal exhaustion and lead to a pullback.
The first major support to watch on any significant dip is the 0.382 Fibonacci retracement level around $4,300. This would be a logical area for buyers to step back in.
Key Levels to Watch:
Resistance: The recent high around $4,950. A clean break and hold above this level signals the next major move higher.
Immediate Support: $4,677. This is the line in the sand for the current consolidation range.
Major Support: The 0.618 Fib level and structural support at $4,000. This is the critical level that bulls absolutely must defend to maintain the larger bullish trend.
My Outlook:
For now, I'm leaning bearish on the 6HR, bullish in the immediate short-term but remaining cautious. I'm watching for a decisive break of $4,950 as confirmation for new highs. If the immediate support at $4,677 fails, I'll be looking for a potential dip-buying opportunity at $4,300.
DISCLAIMER
I AM NOT A FINACIAL ADVISOR, NOR AM I YOURS. THIS IS NOT FINANCIAL ADVICE. MEARLY DOODLINGS ON A MATHMATICALLY DRIVEN GRAPHICAL INTERFACE, TRACKING AN INVISIBLE 256BIT MILITARY-GRADE ENCRYPTED ASSET. . . FOR ENTERTAINMENT/AMUSEMENT PUROSES ONLY. ENJOY!
Ethereum inches toward $5K as Standard Chartered sees $7,500Ethereum inches toward $5K as Standard Chartered sees $7,500 in 2025
Apparently Standard Chartered has sharply raised its year-end 2025 price forecast for Ethereum to $7,500, according to reports from crypto news outlets including CryptoRank and BlockNews.
ETH recently broke above $4,000 and is now just 5% away from the $5,000 mark, which would set a new all-time high.
On the 30-minute chart, price is holding in a tight range near recent highs, showing that buyers are potentially still in control but lacking immediate momentum. Short-term support might sits around $4,650, with stronger support near $4,580.
Looking beyond 2025, Standard Chartered reportedly expects Ethereum to continue climbing, projecting $12,000 in 2026, $18,000 in 2027, and $25,000 by 2028.

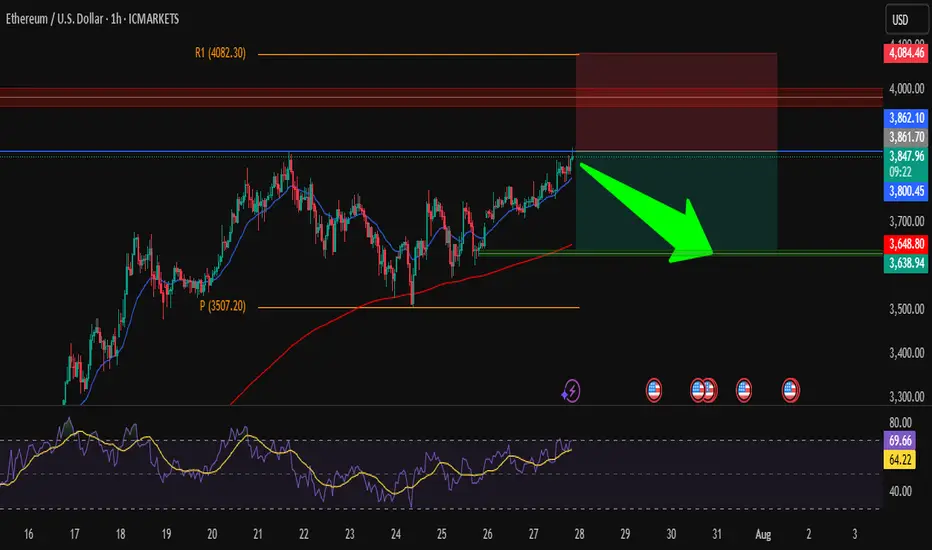
ETH/USD – Short from ResistanceHi traders ! , I opened a short position on ETH/USD as price is hitting a strong resistance zone.
Entry: 3850
SL: 4084.46
TP: 3638.94
📌 Why I took this trade:
Price is testing a strong resistance zone around 3860, RSI is overbought, and we could see a pullback toward the support area around 3640.
Nice risk/reward setup, keeping it simple.
This is just my analysis, not financial advice.
What’s your view — drop or breakout?
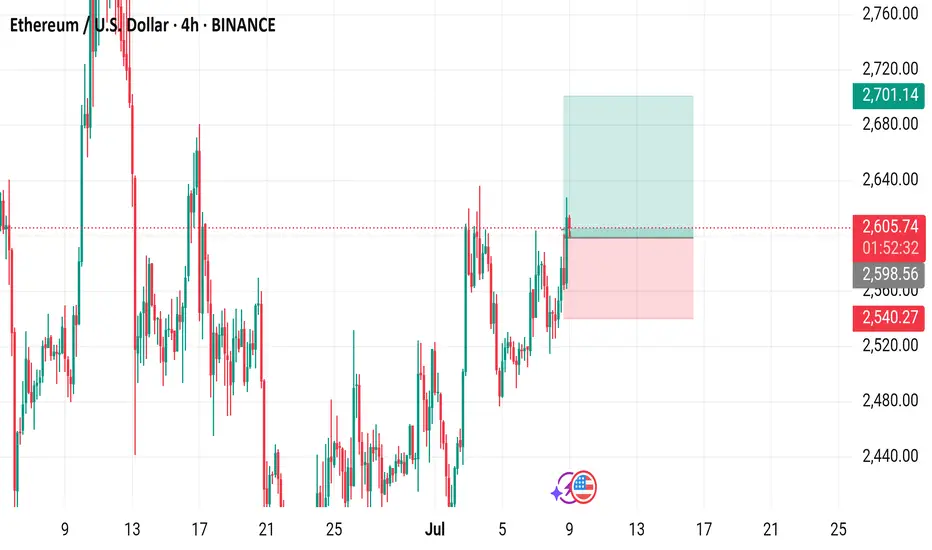
Ethereum (ETH) to U.S. Dollar (USD) 4-Hour Chart - Binance4-hour candlestick chart from Binance displays the price movement of Ethereum (ETH) against the U.S. Dollar (USD) from late June to early July 2025. The current price is $2,608.76, reflecting a +$65.53 (+2.58%) change. The chart includes buy and sell indicators at $2,608.76, with a highlighted resistance zone around $2,700-$2,760 and a support zone around $2,540-$2,600. The chart also shows a recent upward trend with fluctuating volatility.
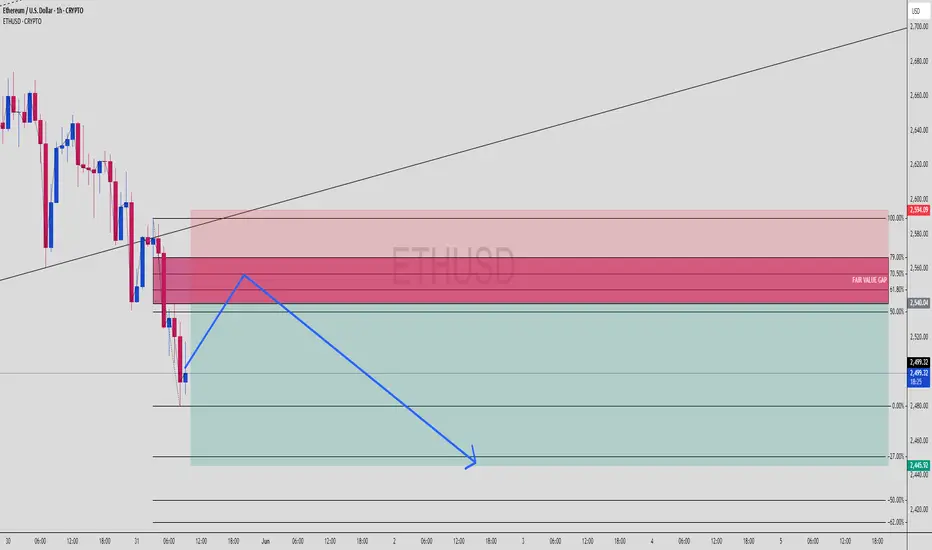
ETHUSD Bearish FVG Play | Premium Rejection Loading?Ethereum (ETHUSD) 1H Smart Money Bearish Setup | FVG + Fib Confluence
Textbook short scenario lining up on ETHUSD as it retraces into a premium zone filled with imbalance. Let’s unpack the key ingredients of this setup for the squad.
🔍 1. Trade Idea Summary
Price dumped sharply, leaving a clean Fair Value Gap
Retracement into premium (Fib 61.8%–79%) zone
Confluence of:
✅ FVG Supply
✅ Fib retracement zone
✅ Internal structure breaker
Targeting sell-side liquidity near 2,445 for a smooth RR 1:3+ setup.
📊 2. Key Zones on Chart
Entry Zone: 2,540 – 2,590 (FVG + 61.8%–79% Fib)
Strong High for Sweep (if needed): 2,594
TP Zone (Sell Side Liquidity): 2,445
SL: Above 2,600
🧩 3. Smart Money Concept Breakdown
Market made a lower low ➝ bias shifts bearish
Now retracing into the last up candle before the dump (FVG zone)
Expecting:
Premium rejection
Lower time frame CHoCH
Push to sell-side liquidity
⚙️ 4. Execution Plan
Let price enter FVG zone
Wait for M5 or M15 bearish break of structure
Confirm with:
OB rejection
Entry confirmation candle
Ride it down to TP or trail SL at midpoint
💡 5. Trader Tips:
Watch volume drop as price enters FVG — sign of weak buyers
Don’t force entry — let structure confirm
⚔️ Comment "ETH Breakdown 🔪" if you're eyeing this short
📈 Save this setup & follow @ChartNinjas88 for real-time sniper breakdowns
🎯 DM “TRADE” for access to my sniper SMC playbook
Ethereum - Short Term Sell Trade Update!!!Hi Traders, on April 8th I shared this idea "Ethereum - Expecting Retraces Before Prior Continuation Lower"
I expected retraces and further continuation lower until the two Fibonacci resistance zones hold. You can read the full post using the link above.
The bearish move delivered, as expected!!!
If you enjoy this idea, don’t forget to LIKE 👍, FOLLOW ✅, SHARE 🙌, and COMMENT ✍! Drop your thoughts and charts below to keep the discussion going. Your support helps keep this content free and reach more people! 🚀
-------------------------------------------------------------------------------------------------------------------
Disclosure: I am part of Trade Nation's Influencer program and receive a monthly fee for using their TradingView charts in my analysis.

Ethereum - Expecting Retraces Before Prior Continuation LowerH1 - Bearish trend pattern in the form of lower highs, lower lows structure.
Strong bearish momentum
Lower lows on the moving averages of the MACD indicator.
Expecting retraces and further continuation lower until the two Fibonacci resistance zones hold.
If you enjoy this idea, don’t forget to LIKE 👍, FOLLOW ✅, SHARE 🙌, and COMMENT ✍! Drop your thoughts and charts below to keep the discussion going. Your support helps keep this content free and reach more people! 🚀
--------------------------------------------------------------------------------------------------------------------
Disclosure: I am part of Trade Nation's Influencer program and receive a monthly fee for using their TradingView charts in my analysis.

(ETH/USD) Breakout from Falling Wedge – Bullish Momentum Ahead?Ethereum (ETH/USD) Breakout from Falling Wedge – Bullish Momentum Ahead?
This 4-hour Ethereum chart shows a breakout from a falling wedge pattern, a bullish reversal formation. The price has started forming higher lows, signaling potential upside movement. The projected target is around $2,411, indicating a significant recovery.
A successful retest of the breakout level could confirm further upward momentum. Traders may consider long positions while monitoring resistance levels.
📌 Key Levels:
Support: ~$1,879
Target: ~$2,411
Resistance Zones: $2,100 - $2,200
Would you like me to refine this further? 🚀

ETH USD ShortTrumps hope rally doesnt change in real fundamentals.
ETHUSD definitley a MUST-Short to me.
I cover the sells there where hype is the biggest: Others buy breakouts,or set their stops and take profits,I sell exactly those levels.

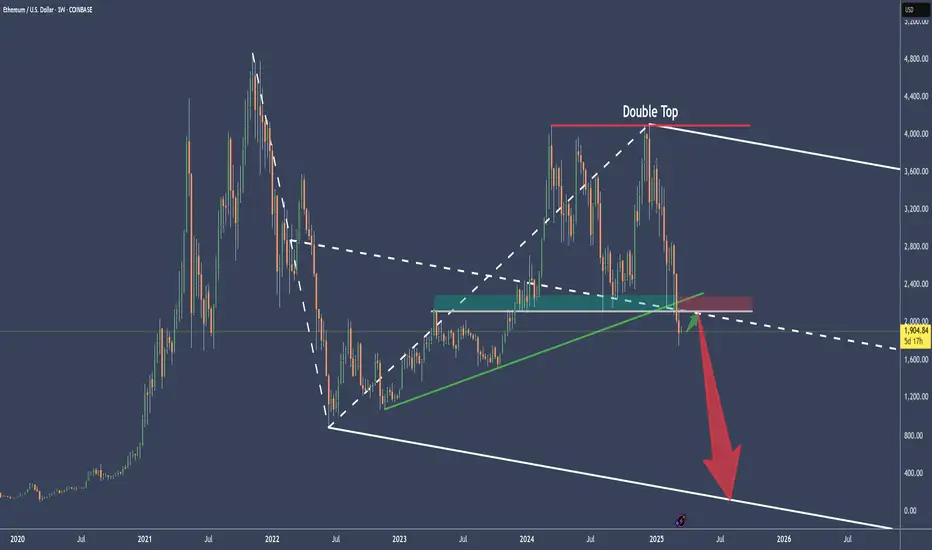
ETHUSD Cracked the longterm supportFirst there was the Double-Top.
Then there was no higher close above the last 2 highs, pressing ETHUSD brutally down to fullfill the Medianlines Rule to reach the Center-Line over 80% of times.
Then price not only reached the Center-Line by breaking through the slanted green support, but also cracked through the weekly horizontal Base (grey) which acted as the last support Bastion.
There are two scenarios possible.
a) a pullback, jump above the CL and we will see a moonshot.
or
b) price is retracing the Center-Line as it does most of the time after it's break, and then continues to the downside. Target would be the Lower-Medianline-Parallel.
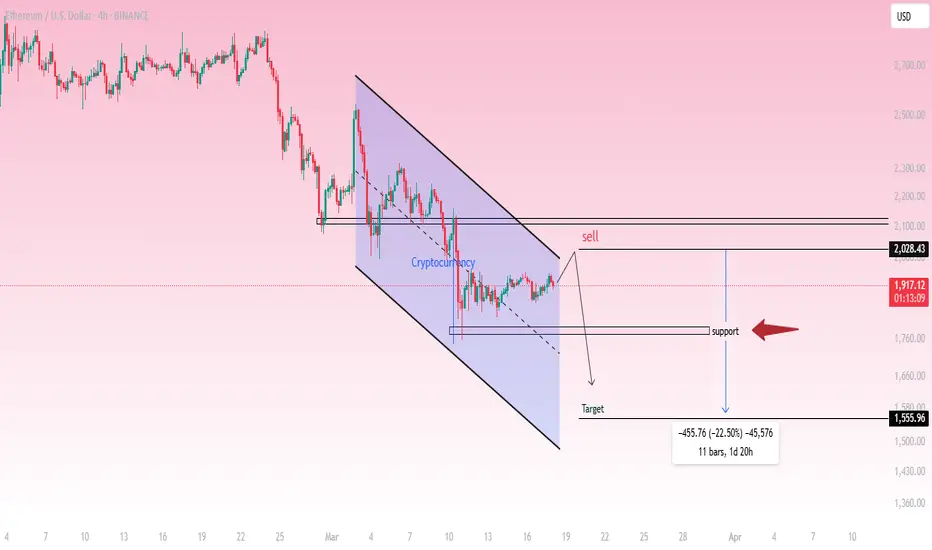
Ethereum (ETH/USD) - 4H Analysis & Trade Setup
Market Overview:
ETH/USD is in a downtrend, forming a descending channel.
Price is currently trading around $1,915.23, showing signs of consolidation near resistance.
Technical Analysis:
Trend: Bearish
Resistance Level: $2,028.43
Support Level: $1,760
Target: $1,555.96
Pattern: Descending Channel
Trade Idea (Short Setup):
🔴 Sell Zone: Around $2,028.43 (Resistance)
✅ Target: $1,555.96 (-22.50%)
⛔ Invalidation: A breakout above $2,028
Conclusion:
Ethereum is respecting the downward channel structure.
A rejection from resistance at $2,028 could confirm further downside.
Traders may consider short positions targeting $1,555.96, provided the trend remains bearish.
📉 Bearish bias remains intact unless price breaks above resistance.
Ethereum Analysis Ethereum Analysis
Ethereum is currently exhibiting a pattern similar to the one observed in Shiba Inu, with a clear downtrend that has led to the breakdown of a key support level. As of now, it seems to be retesting this broken support, though confirmation will only be possible once the current candle closes.
In my opinion, patience is critical in this scenario, and it would be wise to wait for the candle to close before considering any short positions. The broader trend still appears to be bearish, suggesting that Ethereum may not have exhausted its downward momentum just yet. However, market dynamics can shift rapidly, and it is important to remain vigilant and adapt to new information as it unfolds.
I would appreciate your thoughts on Ethereum's current price action and whether you agree with the assessment of a potential continuation of the downtrend. As always, thorough analysis, risk management, and due diligence are essential before making any trading decisions.
Cheers!

ETHEREUMUSDT | Risky Hedge ShortIn our previous ETHUSDT analysis, we mentioned the importance of the $4102 level and the possibility that our rapid entry into the range with its manipulation could lead to bad possibilities.
The price has entered the range again and continues to fall, but it is not nice that the liquidity remaining above is very open. Still, taking a short hedge is not a bad trade by taking the possibility of a losing 1R from here.
I keep my charts clean and simple because I believe clarity leads to better decisions.
My approach is built on years of experience and a solid track record. I don’t claim to know it all, but I’m confident in my ability to spot high-probability setups.
My Previous Analysis
🐶 DOGEUSDT.P: Next Move
🎨 RENDERUSDT.P: Opportunity of the Month
💎 ETHUSDT.P: Where to Retrace
🟢 BNBUSDT.P: Potential Surge
📊 BTC Dominance: Reaction Zone
🌊 WAVESUSDT.P: Demand Zone Potential
🟣 UNIUSDT.P: Long-Term Trade
🔵 XRPUSDT.P: Entry Zones
🔗 LINKUSDT.P: Follow The River
📈 BTCUSDT.P: Two Key Demand Zones
🟩 POLUSDT: Bullish Momentum
🌟 PENDLEUSDT.P: Where Opportunity Meets Precision
🔥 BTCUSDT.P: Liquidation of Highly Leveraged Longs
🌊 SOLUSDT.P: SOL's Dip - Your Opportunity
🐸 1000PEPEUSDT.P: Prime Bounce Zone Unlocked
🚀 ETHUSDT.P: Set to Explode - Don't Miss This Game Changer
🤖 IQUSDT: Smart Plan
⚡️ PONDUSDT: A Trade Not Taken Is Better Than a Losing One
💼 STMXUSDT: 2 Buying Areas
🐢 TURBOUSDT: Buy Zones and Buyer Presence
🌍 ICPUSDT.P: Massive Upside Potential | Check the Trade Update For Seeing Results
🟠 IDEXUSDT: Spot Buy Area | %26 Profit if You Trade with MSB
📌 USUALUSDT: Buyers Are Active

Ethereum Value Slashes by 99%Though this episode of crypto winter is very soon due to be a thing of the past, just a regular seasons do, it will come around again! Considering the all-time structure of Ethereum's price chart, I believe the next crypto winter will be especially bad for Ethereum.
While many altcoins are due for very sizeable runs (100x - 500x and more) over the next couple of years, I think Ethereum will top out near the $6000 mark, giving it a 3.6X push from current price levels. Beyond this, there is great chance that the sloping formation begins to drastically slip. Despite completing 2 sizeable five-swing moves and a correction between the two, its unlikely that this equates to a truly impulsive formation being developed.
The tell-tale sign for me is the extreme shallow correction that we see in the boxed area. Some would classify this as Wave 2 but I'm more inclined to believe it to be a Wave B instead. While it is possible for Wave 2 to find support/terminate near the 0.38 fib level, it is quite rare and even when it does, generally it still makes a return to the previous sub-wave 4. In this case of Ethereum this has not manifested.
If not in an impulsive wave, as the price action suggests, there are 2 options as to how this could play out:
1 - it Luna bombs and eventually makes new all-time lows.
2 - it drops to 0.618 - 0.89 fib levels (compared to the size of Waves A and C combined) and finds support there before resuming upside.
With this in mind, support at/near $20 is the very best outlook for Ethereum's mid-term future. From $6K-$7K, this would equate to a massive 99% drop and this is a very perfect reason why its important to study and understand the science of price action. The last macro crypto pattern I've seen resemble this form was Luna. I thought it would find support at $1.50 but instead it dropped to $0.0000. My Luna prediction was shared well before the drop came. We will see in the years ahead if Ethereum follows suit or if bulls make a stand.
Until next time, stay safe and don't drown. Peace!

Ethereum Retracement potential? 🤔Ethereum! Anticipating a retracement from Weekly Zone 3,519$ and monthly zone 3,346$. Wow! What an ascent that we have observed in recent weeks. A bull market typically has healthy retracements from profit taking and to clear late buyside liquidity. Gathering liquidity is necessary to continue the upside campaign and so we may retrace and consolidate for some time before the train continues. All other technicals explained in the video.
Please share your feedback if this analysis was useful.
