ETHUSD today analysis, 191011. Wait til the flow will be clear.Good morning. Cryptoranger K.
As you may have noticed late yesterday, I told you that the place was ambiguous. And still my position is Long. Yes. The chart shown above is a one-week chart. I'm basically Bear, so it's easier to see the invert chart. If you look at the chart, you can see the following features.
Ethereumshort

ETHUSD today analysis, 191010. I think it will drop to $184~186Hello, my friends. It's Cryptoranger K.
Yesterday ETH has risen quite a bit. And so far, it hasn't shown much movement. In fact, I posted a short analysis saying that ETH is likely to rise, and I immediately deleted it. The chart shown above is a 10-minute ETH chart. As I saw earlier, I thought the current flow was a rising pennant. But in another way, the flow looks like a rising flag. The reason I wrote it is because no matter what the current flow looks like, I've seen it as a place of decline. The reason is that I thought by looking at the ETH 3 hour chart.

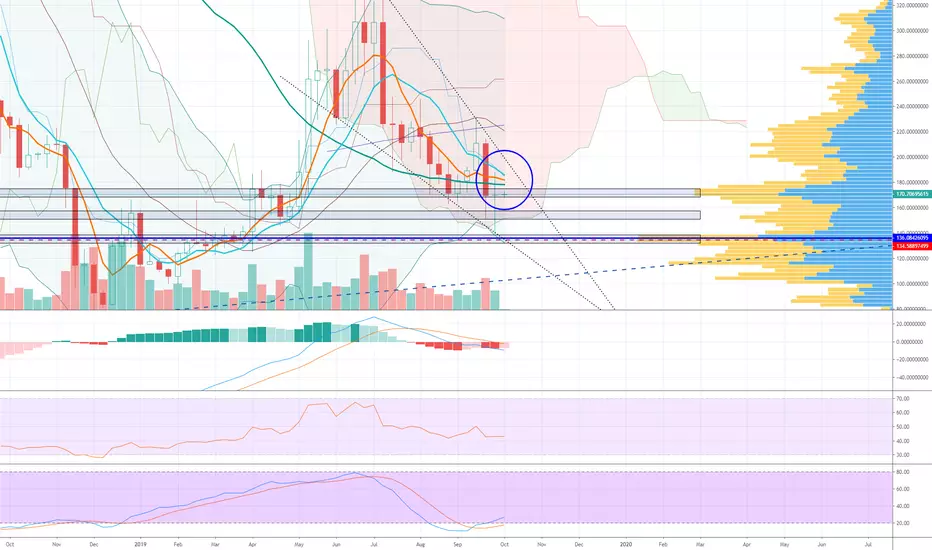
ETHUSD today analysis, 191007. I think it still need 1 more fallHello, my friends. It's Cryptoranger K.
After a long time, the main altcoins show the white body as a whole. When I saw this, I would always shake my heart. And I used to buy in anxiety that I might miss the chance of rising. Is XRP climbing the most now? There are many opinions that other altcoins will rise because XRP is up. Personally I don't trust company based cryptocurrencies. Of the large altcoins, Ripple is not particularly fond of, so I don't care if XRP goes up or not. So let's analyze ETH without Ripple. I think the price of ETH is quite likely to rise in a month or two. However, I do not think the rise in ETH will happen immediately after XRP is up.
Based on the ETH week chart, the intersection of the 5, 10, and 50 day lines is likely to appear the next week or two later. First of all, I think it is important what the candle looks like here. Personally, I believe that the ETH trend is still falling, so the candle on that day will not rise through that intersection. Then I can ask the following questions.
"If the price of ETH falls on the resistance of the intersection, how far will it fall?"
I'm positive about the current one-week stochastic's appearance of the Golden Cross. But there is only one positive part that is currently showing me. There is still a lot of resistance, and in the medium to long term, the price of ETH is still in decline. Personally, I hope to rise in the Ichimoku Cloud. But given the trend, it's more likely that it won't happen. The important thing is to see that the direction of the 10-day line changes. But in order to do that, it is only possible to make the price come back after the price drops once more. I hope that if the price drops to around $ 155 at this point and then comes back up quickly, it will create the flow I want. Then I'll look at what the price flow looks like and judge the rise or fall once again. (Worst case, I think it can fall to $ 139. And $ 139 is the previous low.)
Although I am waiting for one drop, I believe there will be a period of reduced volatility in the near future. If I have to buy ETH first rather than BTC, then the interval where volatility diminishes will be the point where I buy ETH.
Today's analysis is up to here.
Seoul has been raining since Monday.
I am cheering you on doing your best every day by posting an analysis like this.
I sincerely hope that you will always make a successful investment with peace of mind.
Thank you.
ETHUSD today analysis, 191004. Last one more drop is neededHello, my friends. It's Cryptoranger K.
As of yesterday I switched my position to ETH to Long. Just because my trading style changed positions doesn't buy it right away. However, from now on, we are going to work on figuring out where to buy ETH. I was worried and sorry that some of you might have gotten a buy right after seeing my post yesterday. For that reason, I would like to explain this in more detail.
Yesterday I looked at the 50-day line of the weekly chart and saw that ETH was about to complete its decline. I'm not sure if this will lead to an upside or sideways consolidation, but I felt certain it was a move to close the decline. The problem is that the chart's 50-day line isn't perfectly upright yet. I posted yesterday and thought about it for a while. This is how the current ETH chart looks like.
1) Considering the flow of the 50-day line, we can see that ETH is trying to turn the trend upward.
2) The 1 week candle is still below the 50 day line.
3) Now, before the 5 and 10 day lines create an intersection.
4) The 20-day line has just fallen.
Let's talk about '2)' first. If I (or we) buy the ETH, the first point is when the candle goes through the 20 day line. Along with this, if I have to talk about the last buy point, I will say without hesitation that the candle is on the 50-day line for a week. (This is only for this time.)
You can remember the big drop in BTC that started on November 5 last year. Then everyone shouted, "The drop is now over. The BTC must go up here."
But then there is something that everyone overlooks.
That is, the candle did not rise above the 20day line.
3) The current ETH chart will create three intersections soon. 5, 10day lines cross and 10, 50day lines cross. Considering the fall in ETH, it adds up to 5 and 50 day lines, so three intersections await us. The problem is that the current candle is located below the 50 day line. If the current one-week candle rises sharply and the next week's can't be made above $ 190, all of these intersections are expected to act as resistance to the candle.
"Is it likely that ETH prices will rise sharply here?"

ETHUSD today analysis, 191002. "Yes, I believe it's Short."Hello, my friends. It's Cryptoranger K.
Yesterday I felt a little stressed because the indicators showed an unclear flow. I also predict the direction of future prices, but I think that the flow of the chart can change all the time, so I have to be stressed out in this ambiguous situation.
The introduction was long. In my previous analysis, I told you that the $ 186 area is the resistance zone and that it could be the end of the rebound. But as I watched today's chart of Stochastic and MACD as of today, I thought for a moment that the rebound might be a catalyst for the upside. So I watched the chart for hours, and I noticed one feature on the 3 day chart.
I thought yesterday that there would be an intersection of the 5, 10 and 20 day lines, but as today's price drops, the intersection of the 5 and 10 day lines comes first. The three-day candle will not rise above this intersection until October 4th. And if the intersection of the 10-day and 20-day lines occurs around October 4th, it is also expected to resist the price of the next candle as a role of resistance.
However, a few days ago I told you that the ETH price should fall once more, and as it is now, the price is likely to fall only near the previous low of $ 152. Rather, the price may rise after showing sideways in the resistance marked with '1) in the chart. (This is the top of the three rectangles in the chart.) But this will be judged later.
I don't know which way the market is going to change, so my analysis is just for your reference.
That's what I analyzed today.
It was a hard day yesterday and today. However, I was cheered up because some people left me a good content in the comments.
Hopefully my analysis will help you with your trading.
I hope you will continue to keep your assets well and continue to make money.
Thank you.

ETHUSD today analysis, 190929. Not bottom, there's more.Hello, my friends. It's Cryptoranger K.
Currently, the price of ETH has not changed much for several days. With this in mind, some people predicted that the floor would be near. But what I'm seeing is just the return of the ETH price to its original position, and I think the price of ETH is still falling. ETH prices are likely to rise. If one of the 1-week candles created within two weeks from now rises and settles on the 50-day line, the price of ETH may rise. (The chart shown above is a 1week chart.) But the reason I think that is unlikely is that the MACD is still talking about the decline. Although Stochastic created the Golden Cross, as I mentioned earlier, the MACD's power is superior to Stochastic in the already oriented situation. If this is the bottom, at least the direction of the MACD should point upwards. More decisive is that the current price lies below the 5, 10, 20 and 50 day lines. And all of these lines are now coming together in one place. Basically, all of these lines each have a role as a resistance, and at the point where all these lines are gathered, the resistance is multiplied many times. So I accepted this as a signal that ETH's price would fall again.
(You should look at the picture from here. In fact, it's a simple picture, but it's complicated as a lot of information goes in one place.)
What is important from now on is the timing of the flow of the 20-day line going from the bottom to the top. This requires at least one strong price drop. If you see a rebound that quickly rises below the 20-day line after the ETH price drops strongly in the future, you can think of the 20-day line's downward direction as a signal from a downturn to a rise. For reference, the upward rally that lasted from early March to the end of July was also a move to drive the rise of ETH. The rise has shifted the chart's current 50-day line from drop to sideways, and we expect another rise to reverse the 50-day line from sideways to rise.
As mentioned in the analysis I posted a few days ago, the yellow dotted line '1)' predicts the average shift in ETH price going forward. The purple curves labeled '2)' predicted future ETH price movements in consideration of resistance and support. If the ETH price goes as expected, the 20day line will flow in the shape of a brown dotted line marked '3)'. The flow you see is just my prediction, and the price floor that's falling right now could be made lower or higher than I expected. Of course, the timing may be earlier or later than expected. The current figure is an estimate of the ETH price flow.
Today's analysis is up to here.
Today's picture was a bit complicated. I tried to explain it in as much detail as possible, but I don't know if I explained it well. If you have any questions, please leave a comment. However, I am not a native speaker of English, so I would appreciate it if you could make the sentence as easy and simple as possible.
I hope you'll have the rest of the weekend in peace, and I'll see you again tomorrow.
Thank you.

ETHUSD today analysis, 190926. Price can go up to around $115.Hello my friends. It's Cryptoranger K.
The day before, ETH fell by more than 17%. Normally, the day after the price declined that much, it would rebound to near the 5day line, so I expected it to be this time. I watched like that, but there was no movement. So once again I looked at the chart wider. On a three-day chart, the price seems to be a soft landing. This is the yellow dotted line that I marked. The yellow dotted line is the average of the price changes I think it is, and I think it's likely that the bottom is $ 136 based on the volume profile.
The approximate estimate is this. Personally, however, the price is likely to be lower than expected at around $ 115. There are three scenarios.
1) The price may be soft landing along this yellow dotted line and form a floor near $ 135.
2) The candle may rebound here, approaching the 20-day line and then falling to $ 115.
3) The candle can change at this point, leading directly to a drop near $ 115.
I've marked similar sections on the left and right side for you to understand.

Alert for Ethereum Holder We are looking bearish trend in ether chat and our target is around 125$.
If you are trading on margin platform then you can take risk sell ether and get handsome profit.
We are not looking good market situation , so alts trader can wait for good entry.

ETHUSD today analysis, 190924. Much worse than expected.Hello my friends. It's Cryptoranger K.
Few hours before this article, the price of ETH dropped momentarily to $182 and then rose. I saw this and accepted that the future drop would be at least $182. If you look at today's spot, below is the intersection of the 20-day and 50-day lines. This is the support of the candle today. Also up there is the intersection of the 5 and 10 day lines. This is the resistance of the candle today. I expected today if the candle touches the resistance above and falls back, the end of the drop would be near $190. But in the length of yesterday's candle and today's candle, I think the strength of this drop is getting bigger and bigger. So I thought the end of the drop could go below $190. As of today's chart, the MACD is showing its appearance before making a dead cross. If the daily MACD shows a dead cross, I think the drop could fall to $180 or mid-170.

ETHUSD today analysis, 190923. Rebound after fall to around $190Hello my friends. It's Crypto Ranger K.
First of all, fortunately, for the last few days, I think the price is flowing as I expected.
One thing that bothers me is that today's candle bottom is higher than yesterday's candle bottom.
I think there are three reasons for the weakening of the decline.
First of all, I think it's far from the 5day line due to a sharp drop in prices over the past few days.
The second reason is that the intersection of the 200-day line and the 10-day line acts as a support, and finally, the current position is the place where the trading volume is concentrated.
In fact, when I saw this part yesterday morning, I thought about the possibility that the price would rise from this point.
I still think there is some possibility.

Short the hopium out of Ethereum?
Stop loss: $226
Target: $125
Please refer to my last idea as to how I can possibly be Bearish on Ether right now.
"but but but but bull ru..." "NO!"

Window closing for ETHUSD (SHORT) TP1 $190.18
TP2 $193.97
STOP @ $174.42
DISCLAIMER*
Not Financial Advise

SHORT ETHUSDI think bitcoin will rise. When bitcoin is elevated, altcoins drop due to bitcoin. So I think ETH drop to Fibonacci support.

ETH BTC THOUGHTS$ETH - $BTC
Not looking good at all. If we lose the POC level that we're currently at, the next area I'd be interesting in longing is at 0.0108. Be careful.


we found it good to take action ether usd in bank level buy zone ,
hopefully reach our target soon
good luck

ETHUSD could possibly go this way!ETHUSD could possibly go this way!
Check out my FREE Telegram channel to receive instant NOTIFICATION.
Telegram: SamuelFelixClub
One of every 100 subscribers on my Telegram channel gets $100 credit. Don't miss it!


ETH/USDT (Binance) SHORT (Just for now)i think ethereum will make a C&H and im not totally sure if 240 $ or 190 $ but 190 $ makes sense. 2nd part of July is the time if we'll see 190 $.
next? to the Moon (respect Hekate)

Ethereum Short 1 HR Chart#Ethereum #Bitcoin #Litecoin #Crypto
Hello to all watching my charts.
Similar to other crypto ETHUSD Ethereum tries to find a bottoom now ,
but here the chart has been really damaged for long.
2 Big suppport aereas have been hit from ETHUSD at the range 275 - 277
and next stop down is 262.
What i also want to mention negativ is
that at the moment i write this here , Ethereum has been stopped the little up trend
exactly at the next resistance level from 17.6. ( BLUE RESISTANCE LINE)
For Long trendchange i think we do need a jump in the aerea of my
BLUE ARROW and make a new higher hgh (higher than high from yesterday in the minimum ).
Good trades
If you want to support my work and my charts, please like them
Renkotrade

ether still downtrend here is our view about ether bank levels i hope you enjoy and bank profit
good luck

Ethereum SHORT 1 HR ChartHello to all watching my charts
Ethereum made similar to other cryptos now a big jump down
and is in recovering mode.
Recovering from my longgtime channel is fine
but to go back in a long , we have to wait in higher highs an higher lows.
The next high which is to beat is at 297
(my black line)
If the aerea of 298-299 will not reached , than its only
a recovery in the short trend (Blue lines)
What is for longs not so fine is, that my shorttime channel
system (purple lines) are so much weaker and tell us so clear
a short mode.
For long change:
First is to trade at 300 (my lower blue arrow)
Than to jump above the resistance of 302 (higher black line)
Than trade in the aerea of 305-306 , this would restart
my long scenario.
All other trades are short in my eyes at the moment.
Good trades
If you want to support my work and my charts, please like them..
Renkotrade

ETHEREUM SHORT ETHUSD SHORT 1 HR Chart#Renkotrade
Hello to all watching my charts.
Ethereum is now similar to Bitcoin on the way down
Short, short, short as my eye is able to see..
My longtime channelsystem is short , my shorttime channelsystem is short
and my really longlongtime channel which checked 7 days is also short
but i have leave that her byside to dont overfill the chart.
Dor my visitor which want to have an advice for a tendchnage
i have add my ARROW System for a long run
but i dont see any chance at the moment !!
for ETHUSD to come to that range in 2 days.
So as in Bitcoin i do hope you are short or have sold
your Ethereum at around 324 as 2 supports had had been broken
(black lines)
Good trades
If you want to support my work and my charts, please be so kind and like them...
Renkotrade
