Who called the ETH top and H&S pattern?!? Me. Where now?!Ether has confirmed the head and shoulder and broke the neck line. A push down to 600 seems to be just a matter of time. The real question is whether or not this ABCD pattern is going to hold true. At this point, I think it is but I don't have a crystal ball so we will see. Besides the technical aspects of ether itself going to 400, if we look at the correlation with how it's been going down with BTC, it seems that it's not out of the cards at all if BTC pushes down to 6k which also seems very likely.
1st martingale is active at just above this 700 level. I have buys stacked down to 400 in case of a large push down. I will be looking for a bounce up from this 600 level to get out of these initial positions at 620 and 700 for continuation to the downside.
I outlined some of the levels and possibilities that we could see here going forward.
Trade safe everyone.
-Sherem
My calls:
Identifying the top -
identifying the H&S -
Ethereumshort

ETHEREUM (correction is continue)Hello Traders!
Very uncertain, unpredictable & hard to understand wave structure.
There are no less than 3 variants of price directions. Sure, the phase of correction is still continue.
Please do not trade.
Everyday, nine Tengri's traders, creates professional analysis, specializing on Elliotte wave theory, Technichal analysis,
Volume Spread analysis, Market Profile, Depth of Market, Order flow & Footprint.
We trade in all financial markets, there are no boundaries or limitations.
Join us!
«« «« «« «« «« Hold Like! »» »» »» »» »»
(If you have questions, comments, write, reply thoroughly!)
You're welcome!!!
Best regards, the team Traders "Powerful Traders".

ETH USD - BEARTHEREUM!?Things are not looking the best for ETH USD in the short term. This is not a long term projection, but more of a short term hypothetical with increased probability. This is a hypothetical I'm willing to put some money on.
On the 4hr chart you can see that ETH has broken below the neckline of a (confirmed?) head and shoulders pattern. The volume on the breakout wasn't super convincing, but, looking at the hourly chart you can see that price has come back up to test the bottom of the neckline and met resistance. Neckline support is now neckline resistance. It is important to keep in mind that the price of bitcoin can quickly impact the price of ethereum, so a close back above the neckline will invalidate this pattern.
The blue horizontal dashed lines are targets and potential supports that will need to be broken on the way down. If you take a look at my recent Ethereum Classic Analysis, you will see that the price dropped almost precisely to my targets, where they found some resistance and consolidated for a few hours before breaking through to the next level. I was the only one calling BEAR on ETC when everyone else was shouting "TO THE MOON!". I got it right and plan to do more of that in the near future for you guys so please comment, like, follow, and so on. (I'm still in that trade btw and I think there's some more money to be made so check it out!)
Entry - $784 (Stop Loss - $810)
Targets -
773.86 (I will not be booking any profits here because I live on the edge)
724.63
After $724.63 there doesn't seem to be much support / resistance so a drop down to the next two targets could be fairly rapid.
654.08
598.79 (Head and Shoulders Target)
As always, this is my research and you should not make trades based on it. I share with you guys for educational purposes only and also to remain open to constructive criticism from other traders. Don't like what I have to say or disagree with my analysis? Tell me why! Maybe you're seeing something I'm missing.
Agree with my analysis or seeing something similar? Like, comment or follow.

Short ETH/BTC - H&S pattern completion with bearish TK crossShort ETH/BTC on the daily timeframe. Head and shoulders pattern completing as price reaches the bottom of the Ichimoku cloud, along with bearish TK cross. Wait for completion of pattern and price to drop through the bottom of the cloud to short - targets around 0.031.

Etherium target reached perfectly, prepare for another reversal!Etherium has dropped perfectly to our major support previously. We now forecast it to make a recovery to 910 resistance where another reaction could occur (Fibonacci retracement, horizontal overlap resistance, descending resistance momentum). Our major support is at 781 (Fibonacci retracement, Fibonacci extension, horizontal swing low support).
Stochastic (21,5,3) is seeing major resistance below 96% where a corresponding reaction could occur.
Trading CFDs on margin carries high risk.
Losses can exceed the initial investment so please ensure you fully understand the risks.

Warning signals for Ethereum possible sell off (4hr tf analysis)You can see the original post I made for Ethereum here:
Price action in Ethereum appears to be trapped in a channel ever since it made its high of ~$1424.00 on Jan. 13,2018.
Ethereum bullish price swing from the bottom of the channel at ~$569.49 should have tested the top of the channel at ~$1027.01, but failed to do so. This is a sign of weakness by the bulls. Instead, Ethereum turned back down to break Support 1. The top range of Support 2 was successfully tested at ~ $786.82.
A break below the bottom range of Support 2 at ~ $756.01 will confirm further weakness and could trigger a sell off in Ethereum to about $387.
The bottom of the channel as drawn shows a maximum target for the sell off to be around $321. However, it is also possible to start to see profit taking into the last 10% or 20% of the bottom of a channel so it all depends on the risk/reward ratio that is being used in the trade.
The safest areas to buy Ethereum that provide a great risk/reward ratio are :
(1) Going long ONLY after a clear breakout above the ~$977.43. A vertical projection of the width of the channel above the breakout point gives a price target of ~$1721.
(2) Wait to see if Support 2 is broken and to buy at the bottom 10% or 20% of the current channel. Somewhere in the low $330 and $360 should be monitored for possible areas to start to consider buying Ethereum should it sell off.
Selling screnario
The best bearish scenario for now would be to see if Support 2 is broken. If it is, sell the break below the bottom range of Support 2 at ~$756.01 and a stop loss can be placed just above the top range of Support 2 at ~$786.82. Doing this would also easily give a risk/reward ratio of greater than 3:1

Ethereum making a pullback to resistance, watch for reaction!Ethereum is starting to make a pullback to our breakout level. This is usually a sign of bigger players pushing price back up to get in at a good entry. Our 1st major resistance is at 910.21 (Fibonacci retracement, horizontal overlap resistance) and another reaction off this level could push price all the way down to 781 support (Fibonacci retracement, horizontal swing low support).
RSI (55) has broken below our 46% support-turned-resistance line signaling that we’re starting to see a bearish move.
Trading CFDs on margin carries high risk.
Losses can exceed the initial investment so please ensure you fully understand the risks.

Etherium dropping perfectly with good downside potential!
Etherium has started to drop perfectly after breaking our ascending support line as forecasted. Our 1st major resistance is at 910.21 (Fibonacci retracement, horizontal overlap resistance) and a further drop could occur to push price all the way down to 781 support (Fibonacci retracement, horizontal swing low support).
RSI (55) has broken below our 46% support-turned-resistance line signaling that we’re starting to see a bearish move.
Trading CFDs on margin carries high risk.
Losses can exceed the initial investment so please ensure you fully understand the risks.

Ethereum approaching major resistance and getting squeezed!Ethereum is approaching major resistance at 997.75 (Multiple fibonacci retracements, fibonacci extensions, horizontal overlap resistance).
We can also see an ascending support line squeeze price against the 997.75 ceiling signalling that a major break in either direction could be expected.
If price breaks the ascending support line, our next major levels of support would be 907.45 and 778.62.

Ethereum right on major resistance,prepare for a potential drop!Ethereum is now testing our 1st resistance at 784 (multiple Fibonacci retracement, horizontal overlap resistance) and a strong reaction could occur at this level to drive prices down to at least 564 (Fibonacci extension, horizontal swing low support).
Stochastic (34,5,3) is seeing major resistance at 96% where a corresponding reaction could occur.
Trading CFDs on margin carries high risk.
Losses can exceed the initial investment so please ensure you fully understand the risks.

Ethereum has broken major support, could lead to a big drop!Ethereum has broken major support at 756 (Fibonacci retracement, horizontal overlap resistance, bearish price action) and a strong drop could occur from this level towards 538 support (Fibonacci extension, Fibonacci retracement, horizontal overlap support).
RSI (34) sees an intermediate descending resistance line provide downside pressure on Ethereum.
Trading CFDs on margin carries high risk.
Losses can exceed the initial investment so please ensure you fully understand the risks.

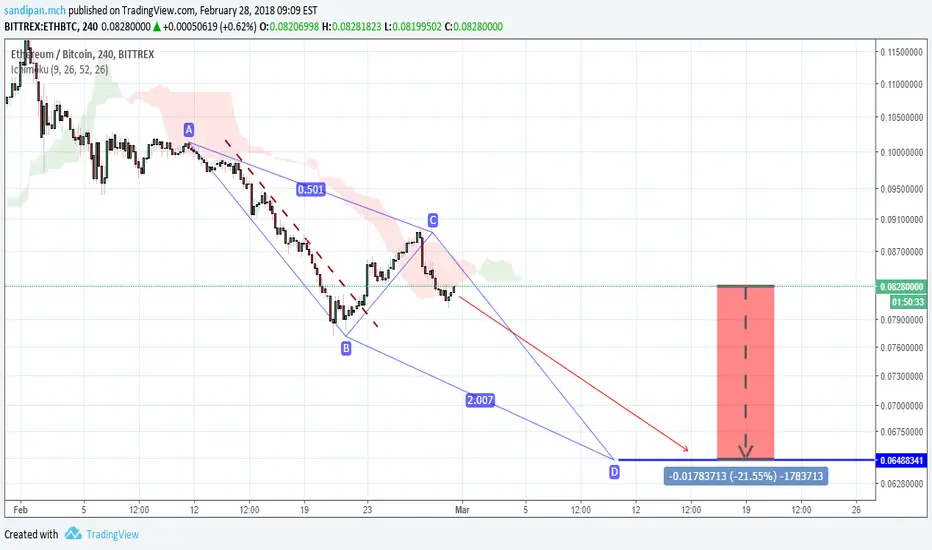
Ethereum Outlook Contains Bearish Sentiment with Advanced CountEthereum to Bitcoin pairing illustrates long-term bearish sentiment after completing a perfect Elliot Wave count that falls into the Basic Principals of the 3rd and 5th waves each containing an advanced count of sub-waves.
Typical ABC correction is impending through the distribution phase of Wyckoff Theory with mark-down.
Buy-in zone within the 50% retracement level and the .618 - .65 golden ratio of Fibonacci.
This is a long-term correction over the course of two months.

Ethereum has broken major support! Keep an eye out on this tradeEthereum has broken major support-turned-resistance at 995 triggering a bearish exit. Our 1st resistance is at 995 (Fibonacci retracement, horizontal pullback resistance, breakout level) where a strong drop could occur from pushing price all the way down to 769. We have to be careful about 931 support level as price has bounced off that area previously and it currently serves as intermediate support.
RSI (55) is seeing pullback resistance to our ascending support-turned-resistance line.
Trading CFDs on margin carries high risk.
Losses can exceed the initial investment so please ensure you fully understand the risks.

Ethereum approaching major resistance, watch for reversal!Ethereum is approaching major resistance at 1144 (Fibonacci retracement, horizontal overlap resistance, pullback resistance) and a strong reaction could occur at this level to drive price down to 927 support (Fibonacci retracement, horizontal swing low support). Do be aware that we’re seeing intermediate support at 1015.
Stochastic (34,5,3) is seeing major resistance at 98% where a corresponding reaction could occur.
Trading CFDs on margin carries high risk.
Losses can exceed the initial investment so please ensure you fully understand the risks.

Ethereum approaching major support, watch for break of key level
Ethereum is approaching our major support level at 995 (Fibonacci retracement, horizontal swing low support) and a clean break of this level could open a potential drop to 769 major support (Fibonacci extension, horizontal swing low support). We have to be careful of intermediate support at 931 (Fibonacci retracement, horizontal swing low support).
RSI (34) has made a bearish exit of our ascending support-turned-resistance line signaling that we’re likely to see massive bearish pressure.
Trading CFDs on margin carries high risk.
Losses can exceed the initial investment so please ensure you fully understand the risks.

Ethereum right on major support, watch for a potential bounce!Ethereum has dipped to our first major support nicely as expected. Support is at 1162 (Fibonacci retracement, horizontal pullback support) where a further rise could occur from to push price up towards 1282 resistance (Fibonacci extension, horizontal pullback resistance, elliott wave structure).
RSI (34) is seeing ascending support hold up price really well in this bullish run.
Trading CFDs on margin carries high risk.
Losses can exceed the initial investment so please ensure you fully understand the risks.

Ethereum has made a bullish exit,watch for more bullish momentumEthereum has made a bullish exit of our long term descending resistance-turned-support line triggering more bullish momentum. We’re seeing intermediate ascending support holding it up really nicely too. Our major support is at 1008 where a further bounce could occur towards 1164 resistance (Fibonacci retracement, horizontal swing high resistance).
RSI (34) has made a bullish exit of its long term descending resistance-turned-support line too signaling that we could be seeing much more bullish momentum.
Trading CFDs on margin carries high risk.
Losses can exceed the initial investment so please ensure you fully understand the risks.

Ethereum approaching major support, prepare for a bounceEthereum is approaching major support at 1008 (38.2% Fibonacci retracement, ABC Fibonacci extension, horizontal swing low support) and a strong bounce could occur at this level to potentially push price up to even 1258 resistance (61.8% Fibonacci extension, horizontal pullback resistance). We have to remain careful that Ethereum is in a bearish channel and would increase our conviction for a bounce if it breaks the upside resistance of this channel.
Stochastic (55,5,3) is seeing a bounce above 4.3% and also a recent break of a descending resistance-turned-support line signaling a potential change in momentum.
Trading CFDs on margin carries high risk.
Losses can exceed the initial investment so please ensure you fully understand the risks.

ETHEREUM - GLOBAL FORECAST 2018-2019yy.Hello Traders!
Glad to present 1variant of Ethereum cryptocoin priceaction.
We believe that the future price of this one will be near 1500.00 - 1700.00 for 2018y.
Obviously we can see 2000.00, but incredible 2600.00...)))
If you like ours EWA/EWP, then we'll show you 2-nd variant of approximately way of priceaction!
Please be aware that, trading craft is always risk!
Sincerely yours, team traders "Powerful Traders".

ETH short trendIf we touch 1381 and it holds we are expected to see a downward trend due to weak bullish volume atm. Check the yellow bases and see what happens... Good luck everybody and have a nice weekend! ;-)

Ethereum in an area of resistanceEthereum is now testing an area of resistance (Multiple 61.8% Fibonacci retracement, 76.4% Fibonacci retracement, Fibonacci extension, horizontal overlap resistance) and a strong reaction could occur at this area to push price down towards support level at 583 (Fibonacci retracement, horizontal swing low support).
Stochastic (55,5,3) is dropping nicely with good downside potential that could correspond to the drop in price too.
Trading CFDs on margin carries high risk.
Losses can exceed the initial investment so please ensure you fully understand the risks.

Ethereum testing major resistance area!Ethereum is now testing our major resistance area at 717 to 748 (61.8% Fibonacci retracement, 61.8% Fibonacci extension, horizontal overlap resistance area, bearish price action) and a strong drop could occur at this level to push price to at least 583 support (Fibonacci retracement, horizontal swing low support). Our next major level of resistance is at 809 (Fibonacci retracement, horizontal breakout resistance level).
Stochastic (34,5,3) is seeing strong resistance below 97% where a corresponding drop could occur.
Trading CFDs on margin carries high risk.
Losses can exceed the initial investment so please ensure you fully understand the risks.
