Ethereumshort

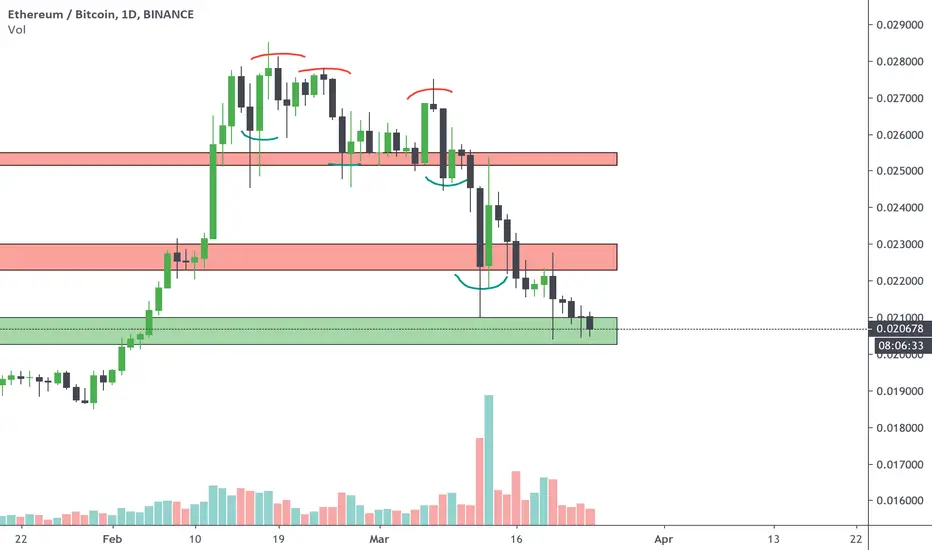
ETHBTC: Still doesn't look goodETHBTC keeps falling and does not show strength after it was rejected at resistance around 0.022 BTC.
Won't touch it near support for this time.
Information is just for educational purposes, never financial advice. Always do your own research.
Ethereum Re-Tests Major Support AreaETH is following a descending support line and has done so since July 2019. There is a strong support area at $85, which will soon coincide with the descending support line.
On March 12, the Ethereum price decreased significantly and reached a low of $101.2. Since then, it has made numerous attempts at retracing last week, most notably on March 20, when it reached a high of $153, but they have all ultimately been proved to be unsuccessful.Therefore, the short-term upside potential is limited, since the price has to flip numerous resistance levels in order to move upwards.
Rather, the price is expected to re-test the support line and support area, before possibly making another attempt at bouncing upwards.
Please leave a LIKE and/or a COMMENT if you enjoyed the analysis

ETHUSD SHORT - as BTC weakness continues so does the ALT leaderWhat is up everyone,
Clean bearish pennant developing on ETH as well as a variety of other altcoin setups.
Publishing this one as I think it could get the most visibility.
Major bearish pattern performed to target and I think we will see more downside here.
Pain for holders continues likely.
Take care,
Vlad The Crypto Trader

Ethereum SHORTwe can stop in this zone 0.38 fibonacci and continue towards the objective or complete the B wave in the marked area

Ethereum Sets To Complete A Simple Zigzag PatternEthereum sell-off from February high can be seen as a five-wave impulse pattern, labeled i-ii-iii-iv-v.
According to Elliot Wave rules, a three-wave correction follows every impulse wave. In ETHUSD's case, the rally from wave (a) low to wave (b) high unfolded as a three-wave a-b-c zigzag pattern.
The correction also terminated at a resistance zone that lined up with a descending trendline and 50% Fib. Once the correction is completed, the primary trend is resumes.
If this count is correct, a five-wave decline is expected in wave (c) to complete the simple zigzag pattern.
I will be looking for a retest of the channel support and weekly trendline for the target.
What's your view on ETHUSD?


ETH Scenario'sPossible scenarios for the future of ETH, i feel likely we will see a bounce off the 0.236 fib line or a return below to the nearest support line.

Ethereum Easy Short To $50While everyone is looking for a rally to the moon before halving, this is the time to look for bearish entries. Thanks to the whales and market makers we keep seeing these pumps. Just as you would dollar cost average your long entries, it may be the perfect opportunity to dollar cost average your short sell entries.
Ethereum is very unlikely to be the second largest coin during the next uptrend, if there is one. Please be warned that the next downtrend will not be the same as anything we have seen before. A major trend in Bitcoin dominance is about to reverse. The sole reason we saw all sorts of sh*tcoins rally in 2017 and onwards was because of a sharp decline in Bitcoin dominance. If you take a look at the BTC.D chart, you will notice that the trend is about to reverse and sh*tcoins are headed for the maximum pain scenario in the months ahead. I will not be surprised if most of the useless altcoins go belly up during the next downtrend. Stay safe, folks!

ETHUSDT - came to the resistance zone of the rising channel 200$Hello everyone, Ethereum has come to the upper zone of the rising channel, a possible wedge.
We have a big bearish divergence on the price and indicator of RSI.
Possible false breakdown and refund.
I look forward to a possible development of the fractal.
Since the risk-to-profit ratio is a good try short trade.
Entrance 200 - 204 $
Stop 206.5
Goals 188.2 and 176
This is just my opinion, and is not a call to action)
Looks good? Leave a like, share and leave a comment.
Thanks for visiting.

ETH/USD 12H (Bybit) Channel exited but about to enter back &downEthereum is going for 7 weeks without a red candle, it's going down pretty soon in my opinion!
Wasn't able to really break-out the parallel channel, I'm expecting a retracement near Fib. 0.236 (201.84) at least, but could bounce on EMA20 first, around 212.60 USD.
Look at how it got rejected on last high zone (~230ish) this is a sign it should totally enter back the channel this weekend or next week.
A stronger correction is also valid until support, maybe MA50 or even Fib 0.382 if (185.43) bears are back to the game. Set-up:
Entry range= 227.50 - 223.30 (Mark)
Take Profit= 212.70 | 203.05 | 193.50 (Index)
Stop Loss= 238.15 (Last)
Risk/Reward ratio= 1:1 | 1:1.75 | 1:2.5
Expected Profit= 5.63% | 9.92% | 14.15%
Possible Loss= -5.66%
Leverage= 5x | 10x | 15x
Fib. Retracement= 0.236 | 0.382

Ethereum : Double Bottom pattern.Ethereum : Double Bottom pattern.
Note: This is only for Educational purposes; this is not investment advice.
ETH retracing to 188 - 185Time to fall. Targets are 18800-18900 and 18500 - both levels are also Fibonacci 0.618 and 0.5, so price will surely find some support there. Besides EMA 200 is now at 18475m so that also add power to that support level.

ETH dead cat bounceEthereum dumped by almost 10% and bounced. IF you take a look at week timeframe, you will see that ETH never ended its downtrend. Just keep on falling and falling and falling. The only bullish moment it has, is that now price is near historical all time low with falling volume, which could be a sign for potential reversal, but certainly not a confirmation of it. And without confirmation better stay away from that coin.
If price will fall below 171 once again, ETH is dead. IF bounce above 173, there is a chance it will bounce to 179. Just monitoring it.

ETH 2020 Ethereum VS USDRoad to 1000+ ETH
Ethereum is the Web 3.0 but will it deliver
Strong developer growth and ETH 2.0 around the corner helps build the Ethereum supports the hype.
For these reasons, I am long-term bullish in Ethereum .

Ethereum (ETHUSD) Market Outlook | Daily Crypto Market BreakdownETH is definitely at a make it or break it point. It will be very interesting to see how the crypto market reacts this next week. Let's see how low ETH and the other ALT coins can go.

Ethereum - Support vs CapitulationAfter another sell-off earlier today, crypto markets have continued to fall, with the total market cap dropping to $220 Billions threshold.
Ethereum couldn't avoid taking a 6.57% hit driven by the overall bearish market sentiment.
Question:
What is the probability you see at $175 major bottom and support against , $175 failure ?
Looking forward your commend and would appreciate your like and engagement.
Thank you
Scrembo

ETHEREUM DAILY ANALYSIS - DOWNTREND?Hey traders,
From my analysis of the Daily charts I see that price has broke through to the downside of the orange trend line.
Price also formed a bearish pinbar signaling a rejection of the 2nd retest of this same line.
Using a simple 50 day moving average, we see that price is trying to break below this.
Daily trade analysis and ideas:
Telegram: t.me
Facebook: www.facebook.com
Twitter: forex_dojo
Instagram: www.instagram.com
Website: www.forexshinobi.com
Tiktok: @forexshinobi
ForexShinobi

Ethereum in TriangleAll oscillators show clear bearish divergence against price. Lets see what happens

ETHUSD SHORT 1 HR Support Resistance Trading and TrendtradingHello to all watching my charts.
Here i want to bring you some trading information
same as in my EURUSD blog
1. Trendchange
To check what is a trend you will find these more basics in my
ebook on my website soming soon.
Its always happens in these manner:
In the longer time review a trend is maybe still valid,
Butt the things which happens now counts always
NOT what has happens a few days or hors or minutes.... ago.
So long time review here is BLUE
HERE IT STARTS WITH LONG
IN the midtime review we do have a part of the long time trend shown
AND a part of the what happens now.
THAN IT CHANGES FROM LONG TO NEUTRAL - CHANNEL IS FLAT
So midtime review here is RED
HERE ITS NEUTRAL
And at least we get the chart information what happens really
NOW or the last.minutes / Hours
THAN IT CHANGES FROM NEUTRAL TO SHORT
Channel GREEN is SHORT (fallin down)
This points are in all timeframes and all datas same
Its either this procedure
LONG than
NEUTRAL than
SHORT
or the other way round.
2. Support and Resistance
In additon i have marked the fall below the last resistance at
ca 174.58
and now we are in short land.
To get again in a long trade we should climb above the green line
in these green arera.
Good trades
Renkotrade

191021 ETHUSD analysis. Fall in the medium term.Hello, my friends. It's Cryptoranger K.
Today was a day when I didn't see anything special on the chart. I looked in for a while, gave up and just rested. And I look at the chart again at night. I thought about why. And I concluded that it was because I had a lot of expectation that 'I want the bottom to come out quickly'.
Looking at the ETH 4 hour chart today, I found that the current price flow is drawing a falling wedge. And the four-hour candle seems to be rising. And again I saw the daily chart.

191015 ETHUSD analysis. it's good to watch the stochastic flow.Hello. It's Cryptoranger K.
The ETH flow so far is moving within the framework of the falling flag and the falling wedge. Personally, I think this is where the ETH price rises. It's exactly weighting up and down about 8:2. But if you look at the chart, it is unlikely that the price will rise right at this point. The reason is because of BTC.
