Ethereum Bulls Defending $3,500 Zone – Time to Rise?Today, I want to walk you through a quick 15-minute timeframe analysis of Ethereum ( BINANCE:ETHUSDT ), so stick around.
Right now, Ethereum is hovering near a Support zone($3,520-$3,348) and a Cumulative Long Liquidation Leverage($3,507-$3,460) .
From an Elliott Wave standpoint, it seems like Ethereum is wrapping up a microwave Y of the main wave 4.
Also, looking at the ETHBTC ( BINANCE:ETHBTC ) chart, Ethereum is in a favorable position there as well, which suggests that if Bitcoin ’s( BINANCE:BTCUSDT ) price increases, Ethereum might see an even stronger upward move.
My expectation is that in the coming hours, Ethereum can resume its bullish trend , push up toward the Resistance lines , and then aim for the next Resistance zone($3,726-$3,649) .
First Target: $3,631
Second Target: $3,665
Third Target: $3,707
Stop Loss(SL): $3,449
CME Gap: $3,513-$3,483
Cumulative Short Liquidation Leverage: $3,715-$3,671
Please respect each other's ideas and express them politely if you agree or disagree.
Ethereum Analyze (ETHUSDT), 15-time frame.
Be sure to follow the updated ideas.
Do not forget to put a Stop loss for your positions (For every position you want to open).
Please follow your strategy and updates; this is just my Idea, and I will gladly see your ideas in this post.
Please do not forget the ✅' like '✅ button 🙏😊 & Share it with your friends; thanks, and Trade safe.
Ethereumsignal

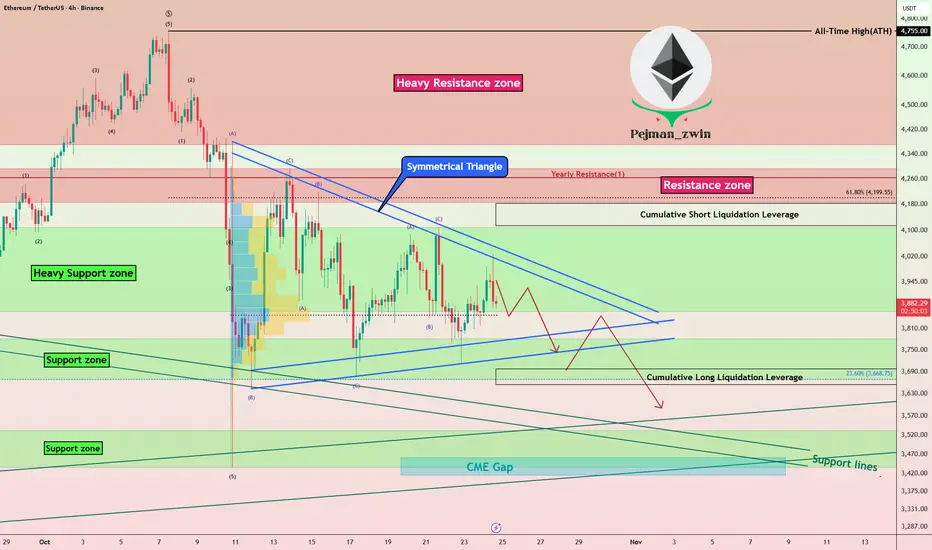
Ethereum in Symmetrical Triangle – Next Big Move Coming?Let’s take a look at Ethereum ( BINANCE:ETHUSDT ) on the 4-hour timeframe . Recently, Ethereum dropped by over -20% during the latest crypto market sell-off but has since started to recover. Right now, it appears to be in a corrective pattern, moving inside a Symmetrical Triangle Pattern .
Currently, Ethereum is testing a Heavy Support zone($4,107-$3,860) , and a break below that zone, confirmed by breaking the lower lines of the symmetrical triangle , could signal further downside.
Note: In general, a Symmetrical Triangle is a continuation pattern, and since the prior trend was downward, we might expect more downside if the broader crypto market continues to decline.
Before concluding, let’s also glance at the ETHBTC ( BINANCE:ETHBTC ) pair on the daily timeframe . It looks like ETHBTC has been in a downtrend and might revisit its support zone once more. That suggests if Bitcoin declines, Ethereum could see even more pressure .
In conclusion, I expect Ethereum to drop at least to its Support lines and Support zone($3,532-$3,436) after breaking the lower lines of the symmetrical triangle. There's also a CME Gap($3,461-$3,417) that might get filled.
Note: Keep in mind that weekend trading volumes are often lower, so the breakdown might not happen immediately. However, if tensions between the US and Venezuela escalate, we could see a sharper reaction even over the weekend.
First Target: $3,764
Second Target: $3,597
Stop Loss(SL): $4,044
Cumulative Short Liquidation Leverage: $4,182-$4,114
Cumulative Long Liquidation Leverage: $3,697-$3,3654
Please respect each other's ideas and express them politely if you agree or disagree.
Ethereum Analyze (ETHUSDT), 4-hour time frame.
Be sure to follow the updated ideas.
Do not forget to put a Stop loss for your positions (For every position you want to open).
Please follow your strategy and updates; this is just my Idea, and I will gladly see your ideas in this post.
Please do not forget the ✅' like '✅ button 🙏😊 & Share it with your friends; thanks, and Trade safe.
Ethereum Correction Ending? Next Bullish Wave Loading!In the previous idea , I was able to find the Ethereum price top at $4,788 . The question is, has the Ethereum correction begun, or is there still hope for the creation of a new All-Time High(ATH)?
Ethereum ( BINANCE:ETHUSDT ) is currently trading near the Support zone($4,240-$4,186) , Cumulative Long Liquidation Leverage($4,205-$4,158) , and important Support lines .
In terms of Elliott Wave theory , it seems that Ethereum has completed a corrective wave . The corrective wave has a Double Three Correction structure(WXY) . If the Resistance zone($4,410-$4,324) and Cumulative Short Liquidation Leverage($4,416-$4,375) are broken, we can confirm the end of the corrective wave .
I expect Ethereum to start rising from important support lines and rise to at least $4,373 .
Second Target: $4,484
Third Target: $4,607
Stop Loss: $4,097
Note: Today's Fed Chair Powell Speaks can create excitement in financial markets, especially crypto.
Please respect each other's ideas and express them politely if you agree or disagree.
Ethereum Analyze (ETHUSDT), 1-hour time frame.
Be sure to follow the updated ideas.
Do not forget to put a Stop loss for your positions (For every position you want to open).
Please follow your strategy and updates; this is just my Idea, and I will gladly see your ideas in this post.
Please do not forget the ✅' like '✅ button 🙏😊 & Share it with your friends; thanks, and Trade safe.
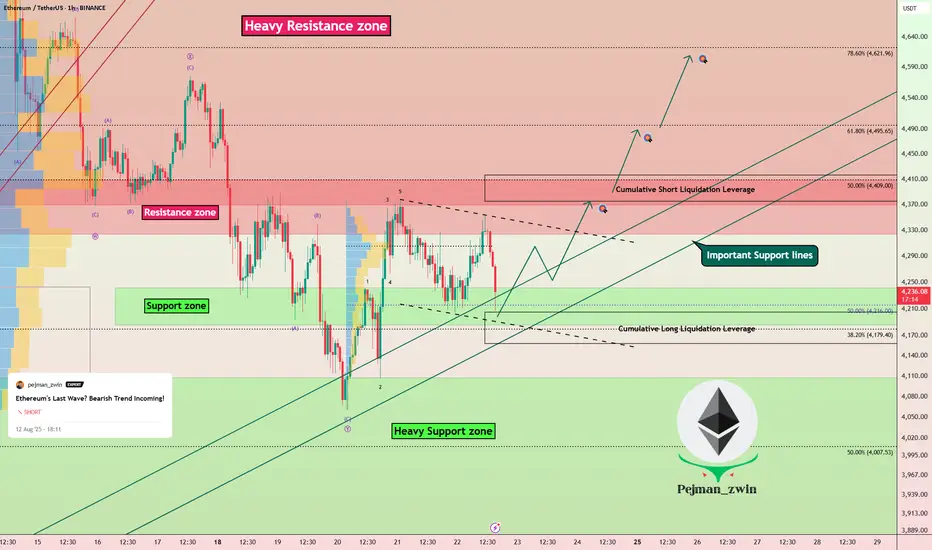
Ethereum's Last Wave? Bearish Trend Incoming!Ethereum ( BINANCE:ETHUSDT ) started to rise and pump as I expected in the previous idea .
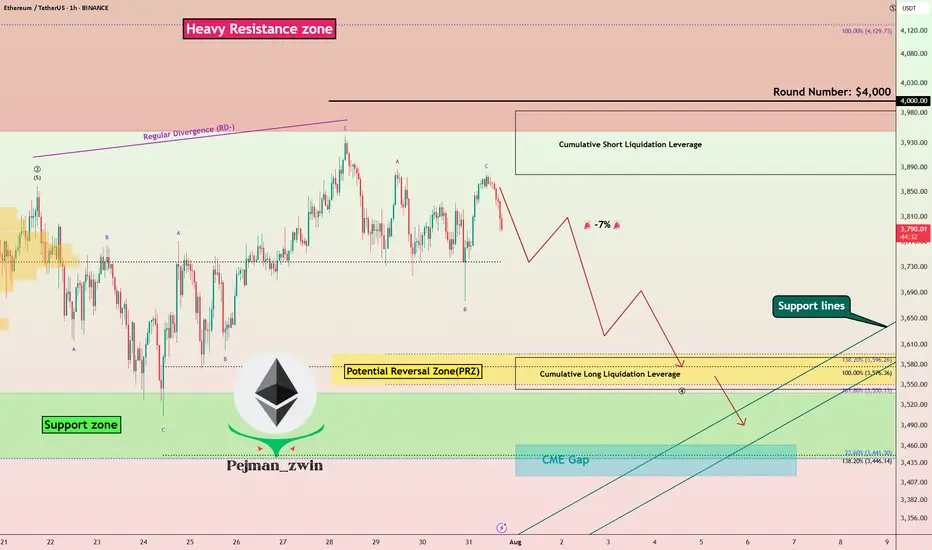
Ethereum is currently trading in a Heavy Resistance zone($4,868(ATH)-$3,977) near the Potential Reversal Zone(PRZ) , Cumulative Short Liquidation Leverage($4,527-$4,452) , and the upper line of the ascending channel(potential) .
In terms of Elliott Wave theory , Ethereum appears to be completing microwave 5 of main wave 5 . Main wave 5 could complete at the Potential Reversal Zone(PRZ) .
Also, we can see the Regular Divergence(RD-) between Consecutive Peaks .
Before any conclusions, let's take a look at the ETHBTC ( BINANCE:ETHBTC ) chart.
ETHBTC also indicates the end of the uptrend, and if the market falls , we can expect ETH and the tokens on the Ethereum blockchain to undergo a correction this time.
I expect Ethereum to bearish trend in the coming days and at least close the CME Gap($4,185-$4,080) .
One of the tokens that we can use for short positions alongside Ethereum is the ENS token ( BINANCE:ENSUSDT ). ENS is the decentralized naming system built directly on the Ethereum blockchain, simplifying crypto addresses into human-readable names .
Cumulative Long Liquidation Leverage: $4,145-$4,094
CME Gap: $3,461-$3,417
Note: Stop Loss: $4,780
Do you think Ethereum will create a new All-Time High(ATH) soon, or should we wait for a correction?
Please respect each other's ideas and express them politely if you agree or disagree.
Ethereum Analyze (ETHUSDT), 4-hour time frame.
Be sure to follow the updated ideas.
Do not forget to put a Stop loss for your positions (For every position you want to open).
Please follow your strategy and updates; this is just my Idea, and I will gladly see your ideas in this post.
Please do not forget the ✅' like '✅ button 🙏😊 & Share it with your friends; thanks, and Trade safe.

$ETH Breaks Confluence Barrier — Next Stop ATH? CRYPTOCAP:ETH has broken above a major confluence zone, where long-term resistance and trendline pressure have been holding price back. This breakout signals renewed bullish momentum and opens the door for a potential push toward the previous all-time highs.
The strong demand zone below continues to act as a solid foundation, and RSI momentum suggests buyers are still in control. As long as ETH holds above this breakout level, the bullish outlook remains intact.

Ethereum Ready to Attack Resistances — Time to Long ETH?Ethereum ( BINANCE:ETHUSDT ) fell to the Support zone($3,538-$3,442) and Support lines as I expected in the previous idea .
Ethereum is currently trading near the Support zone($3,538-$3,442) , Support lines , and Cumulative Long Liquidation Leverage($3,559-$3,524) .
In terms of Elliott Wave theory , it seems that Ethereum has completed the main wave 4 . The main wave 4 has an Expanding Flat structure(ABC/3-3-5) . To confirm the main wave 4, we must wait for the Resistance zone($3,771-$3,677) and Resistance lines to be broken.
I expect Ethereum to trend higher in the coming hours and attack the Resistance lines and Resistance zone($3,771-$3,677) .
Cumulative Short Liquidation Leverage: $3,672-$3,645
Note: Stop Loss: $3,450 =Worst
Please respect each other's ideas and express them politely if you agree or disagree.
Ethereum Analyze (ETHUSDT), 1-hour time frame.
Be sure to follow the updated ideas.
Do not forget to put a Stop loss for your positions (For every position you want to open).
Please follow your strategy and updates; this is just my Idea, and I will gladly see your ideas in this post.
Please do not forget the ✅' like '✅ button 🙏😊 & Share it with your friends; thanks, and Trade safe.
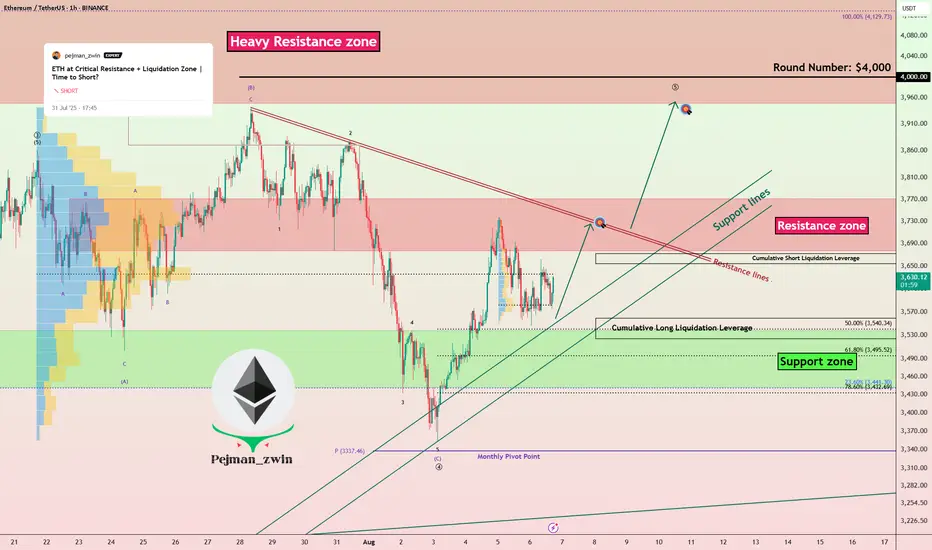
ETH at Critical Resistance + Liquidation Zone | Time to Short?Today I want to analyze Ethereum ( BINANCE:ETHUSDT ) on the 1-hour time frame . Is there a short position opportunity?
Please stay with me.
Ethereum is currently trading near a Heavy Resistance zone($4,390-$3,950) , Cumulative Short Liquidation Leverage($3,983-$3,878) and the $4,000 ( round number ). $4,000 could be a psychological number to sell .
In terms of Elliott Wave theory , Ethereum appears to have completed the main wave 3 at $3,860 and is currently completing the main wave 4 . The main wave 4 could have a Double Three Correction(WXY) or Expanding Flat(ABC/3-3-5) , with the Expanding Flat structure being more likely .
One of the reasons why shorting Ethereum could be better than shorting Bitcoin right now is that ETHBTC ( BINANCE:ETHBTC ) is currently trading above the ascending channel and is likely to correct to Fibonacci levels .
Also, we can see the Regular Divergence(RD-) between Consecutive Peaks.
I expect Ethereum to drop to at least the Potential Reversal Zone(PRZ) and attack the Support lines ( Second target ) .
Cumulative Long Liquidation Leverage: $3,591-$3,543
CME Gap: $3,461-$3,417
Note: Stop Loss: $4,023
Please respect each other's ideas and express them politely if you agree or disagree.
Ethereum Analyze (ETHUSDT), 1-hour time frame.
Be sure to follow the updated ideas.
Do not forget to put a Stop loss for your positions (For every position you want to open).
Please follow your strategy and updates; this is just my Idea, and I will gladly see your ideas in this post.
Please do not forget the ✅' like '✅ button 🙏😊 & Share it with your friends; thanks, and Trade safe.
Ethereum Stalls at $3,101.0FenzoFx—Ethereum broke past $2,880.0 but stalled near a bearish fair value gap. The daily chart shows a longwick bearish candlestick, signaling increased selling pressure.
With Stochastic at 90.0, ETH is short-term overbought. Resistance is at $3,101.0—if it holds, ETH may retreat to $2,880.0 or $2,638.0.
A close above $3,101.0 would invalidate the bearish outlook and pave the way toward $3,330.0.

Ethereum Analysis – Vitalik’s Gas Cap Proposal Adds PressureToday, I want to show you the possible moves for Ethereum ( BINANCE:ETHUSDT ) this week.
Please stay with me .
Let’s first take a look at the important news that has come for Ethereum in the last 24 hours :
Ethereum’s Gas Cap Proposal Sparks Concerns
Ethereum co-founder Vitalik Buterin recently proposed EIP-7983 , introducing a gas limit cap to prevent potential DoS (Denial of Service) attacks on the network.
Bearish Takeaways:
This proposal reveals a current vulnerability in Ethereum’s infrastructure. If gas limits grow unchecked, nodes may fail to sync, leading to possible network instability.
Imposing a gas cap could temporarily reduce transaction throughput, affecting DeFi protocols and NFT platforms that rely on Ethereum’s scalability.
The market tends to react cautiously to core protocol changes, and this uncertainty could trigger short-term selling pressure.
Bullish Counterpoints:
The cap aims to strengthen the network’s long-term stability against spam and DoS attacks.
It’s still in the proposal stage, with no immediate impact on users or network performance.
Conclusion:
While the long-term impact may be positive, the short-term uncertainty and exposed risks provide a bearish narrative for Ethereum, especially amid growing competition from alternative chains.
--------------------------------------
Now let's take a look at the Ethereum chart on the 4-hour time frame .
Ethereum is currently trading near the Heavy Resistance zone($2,929-$2,652) and Resistance lines , and is also trying to break the Support line .
In terms of the Elliott Wave theory , it seems that Ethereum has completed the Zigzag Correction(ABC/5-3-5) , so we can expect the next bearish wave .
I expect Ethereum to fall to at least $2,433 AFTER breaking the Support line, and if the Support zone($2,491-$2,323) is broken, we should expect further declines.
Second Target: $2,374
Note: Stop Loss (SL) = $2,689= Worst Stop Loss(SL)
Please respect each other's ideas and express them politely if you agree or disagree.
Ethereum Analyze (ETHUSDT), 4-hour time frame.
Be sure to follow the updated ideas.
Do not forget to put a Stop loss for your positions (For every position you want to open).
Please follow your strategy and updates; this is just my Idea, and I will gladly see your ideas in this post.
Please do not forget the ✅' like '✅ button 🙏😊 & Share it with your friends; thanks, and Trade safe.

ETH Momentum Builds Above Key SupportFenzoFx—Ethereum bounced from the $2,397.0 support and swept liquidity below the level, backed by a bullish FVG on the 4-hour chart. ETH is currently testing resistance at $2,500.0, and a breakout could lead to a retest of $2,539.0.
The bullish setup remains valid above $2,397.0; below that, $2,317.0 becomes the next support.

Ethereum Slides Toward $2,446 SupportEthereum was rejected at the $2,539.0 resistance and is falling toward $2,446.0 support. A hold here could launch a retest of $2,539.0, while a close below $2,446.0 may spark a decline to $2,397.0.

Ethereum Faces Resistance at $2,539.0Ethereum was rejected at the $2,539.0 resistance, a high-volume supply zone. If this level holds, ETH could drop toward $2,397.0, and a break below it may trigger further downside toward $2,192.0.
The bearish outlook is invalidated if ETH/USD closes above $2,539.0.

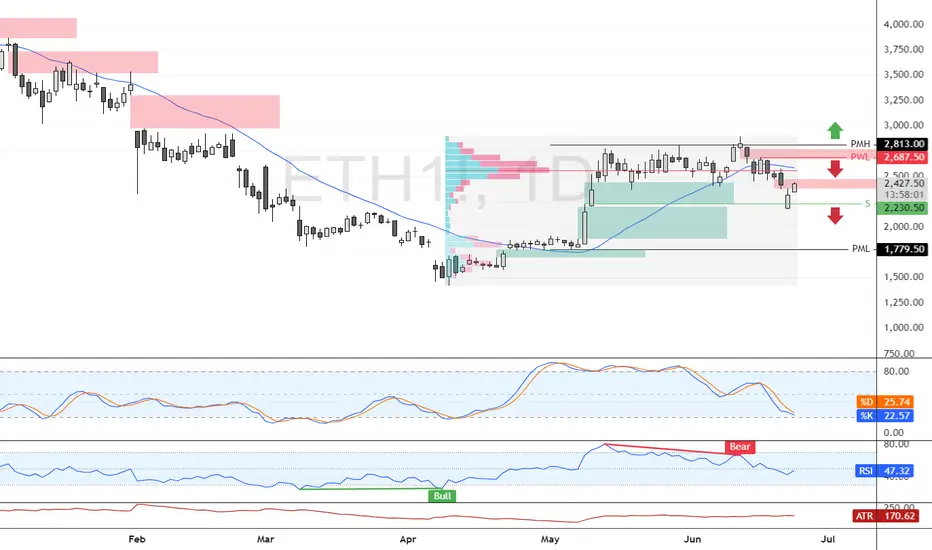
Bearish Wave Builds Below Key ETH Supply ZoneFenzoFx—Ethereum failed to break above $2,813.0 and is now trading around $2,430 after trimming nearly 5.0% of recent losses.
The $2,687.0 area, backed by the 50-period SMA, acts as a premium supply zone. A bearish wave could follow, targeting $1,779.0, supported by prior monthly lows and RSI divergence.
The bearish outlook is invalidated if ETH/USD closes above $2,813.0.
Ethereum at PRZ: Bullish Setup _ Short termEthereum ( BINANCE:ETHUSDT ) reacted from the Potential Reversal Zone (PRZ) around the confluence of key Fibonacci levels , the Important Support line and 50_SMA(Daily) .
From an Elliott Wave point of view , we can identify a Expanding Flat (ABC/3-3-5) structure ending right above the Support zone ($2,474-2,437) .
The structure also hints at the formation of a new upward leg , potentially leading ETH toward the Resistance zone ($2,564-$2,524) and the upper line of the Ascending Channel .
I expect Ethereum to test the 38.2%($2,531=First Target) - 50%($2,561) Fibonacci retracement levels on the way to a potential retest of the previous swing highs .
Note: Stop Loss (SL) = $2,451= Worst Stop Loss(SL)
Please respect each other's ideas and express them politely if you agree or disagree.
Ethereum Analyze (ETHUSDT), 15-minute time frame.
Be sure to follow the updated ideas.
Do not forget to put a Stop loss for your positions (For every position you want to open).
Please follow your strategy and updates; this is just my Idea, and I will gladly see your ideas in this post.
Please do not forget the ✅' like '✅ button 🙏😊 & Share it with your friends; thanks, and Trade safe.

Quasimodo Pattern + Validator Support = Bullish Signal for ETHToday I want to analyze Ethereum ( BINANCE:ETHUSDT ) for you, many tokens are on the Ethereum network , and the increase or decrease of Ethereum directly affects most tokens.
So please stay with me.
Ethereum is trading in a Heavy Resistance zone($2,929_$2,652) near the Resistance lines and 200_SMA(Daily) . It is worth noting that Ethereum is preparing itself for a third attack on 200_SMA(Daily).
In terms of Price Action Analysis , Ethereum could start to rise with the help of the Bullish Quasimodo Pattern and break out of 200_SMA(Daily) and Resistance lines .
In terms of Elliott Wave theory , Ethereum appears to have completed a main wave 4 near Important Support lines . The structure of the main wave 4 is a Double Three Correction(WXY) . By breaking the 200_SMA(Daily) and Resistance lines , we can confirm the end of the main wave 4 .
The ETHBTC ( BINANCE:ETHBTC ) chart conditions are bullish , so it seems like investing in Ethereum could be better than Bitcoin . At least if the market falls , Ethereum is likely to be less likely to suffer a decline .
Note : Over 150,000 Ethereum validators, representing approximately 15% of the network, signaled support for increasing the gas limit from 36 million to 60 million units. This proposed change aims to enhance network capacity, reduce transaction fees, and improve scalability. While this development could positively impact ETH's price by making the network more efficient, it's essential to monitor potential technical risks and ensure that decentralization is maintained.
Note: If Ethereum touches $2,547 , we can expect further declines.
Please respect each other's ideas and express them politely if you agree or disagree.
Ethereum Analyze (ETHUSDT), 1-hour time frame.
Be sure to follow the updated ideas.
Do not forget to put a Stop loss for your positions (For every position you want to open).
Please follow your strategy and updates; this is just my Idea, and I will gladly see your ideas in this post.
Please do not forget the ✅' like '✅ button 🙏😊 & Share it with your friends; thanks, and Trade safe.

Ethereum Consolidates Near the 50-SMAFenzoFx—Ethereum remains in a bull market above the 50-period simple moving average, though momentum slowed after testing resistance at $1,857.0. At the time of writing, it trades around $1,812.0, consolidating near the 50-SMA.
As long as the price stays above $1,690, the outlook remains bullish. A close above $1,857.0 could push ETH/USD toward the next resistance at $1,957.0.
Bearish Scenario: A break below $1,690.0 would invalidate the bullish outlook and could trigger a drop toward $1,538.0.
***
>>> No Deposit Bonus
>>> %100 Deposit Bonus
>>> Forex Analysis Contest
All at FenzoFx Decentralized Forex Broker

ETH Tests The $1,623 Level as SupportFenzoFx—ETH rebounded at the $1,623 support level, indicating potential for an uptrend toward $1,755.
If ETH/USD drops below $1,623, it may test the 50-period SMA near $1,600, aligned with the 50% Fibonacci retracement.
>>> No Deposit Bonus
>>> %100 Deposit Bonus
>>> Forex Analysis Contest
All at FenzoFx Decentralized Forex Broker

🚧Ethereum Analysis(Three Falling Peaks Pattern)🚧🎄Merry Christmas!
💫Happy Holidays! I hope all of your Christmas wishes come true.
✅ Ethereum(ETH) managed to form a Three Falling Peaks Pattern near the 🔴 Heavy Resistance zone($2,540_$2,300) 🔴 and 🟡 Price Reversal Zone (PRZ) 🟡.
📚What is the Three Falling Peaks Pattern❗️❓
🔸 The three falling peaks pattern consists of three peaks and two valleys of give or take equal size. The pattern has a downward slope meaning that each peak is lower than the last, and the same applies to the valleys.
🔸The three falling peaks pattern validly forms when, after the last peak, the price falls below the second valley signaling a market reversal and a large price drop.
🔨Also, Ethereum managed to break the Support line and 🟢Support zone($2,270_$2,245) 🟢.
🔔I expect Ethereum to continue its decline towards the next 🟢Support zone($2,167_$2,116) 🟢 after completing the pullback to the 🟢Support zone($2,270_$2,245)🟢 and Support line .
❗️⚠️Note⚠️❗️: An important point you should always remember is capital management and lack of greed.
Ethereum Analyze ( ETHUSDT), 1-hour time frame ⏰.
Do not forget to put Stop loss for your positions (For every position you want to open).
Please follow your strategy; this is just my Idea, and I will gladly see your ideas in this post.
Please do not forget the ✅' like '✅ button 🙏😊 & Share it with your friends; thanks, and Trade safe.

Ethereum forecast and signalPlease write any advice or suggestions.
Dear friends, request any cryptocurrency pair, currencies pair for forex, and any index that you want to be analyzed and ask any questions.
Thanks for your attention
Ethereum vs Tether ETHUSD/ ETHUSDT
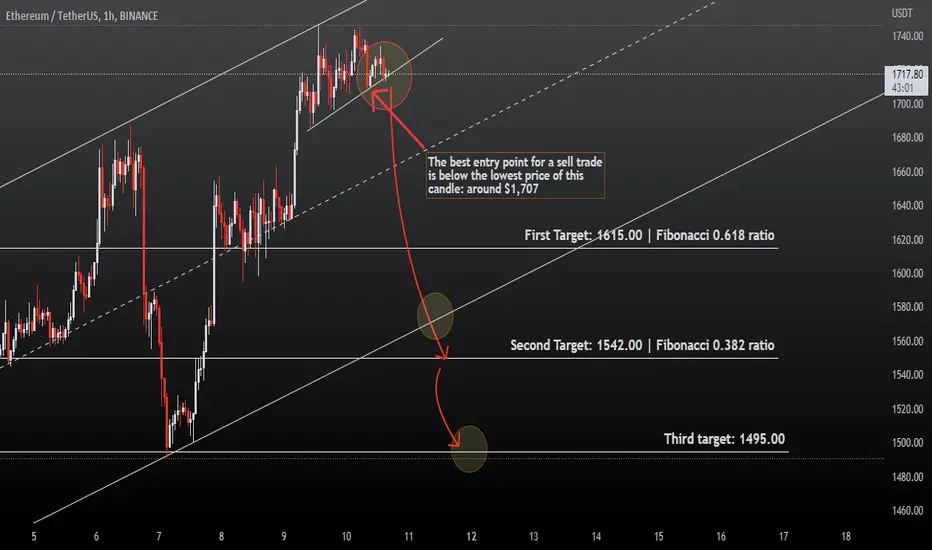
Scenario of changing the Ethereum trend !🧐After hitting the daily resistance, and also ending the trend in the daily time period, we see the price hitting the floor of the channel of the 1-hour time frame, more than 2 times.
After breaking the lower support line of the channel, a drop with price targets up to $1,500 can be expected.
In the 4-hour time frame, the bottom of the major ascending channel is in the price range of $1,550, which is the main and final target of the fall in the next 24 hours.
Then, after breaking the support of the 4-hour channel, it hits at least $1,500.
The completion of this scenario causes a downward trend and the formation of a continuation of the long-term downward trend in the daily charts.
To enter a sell trade, the best area is below the lowest price in the 1-hour and 2-hour candles in the past 6 hours, around $1707
And keep in mind that Bitcoin price uses the same scenario to drop the price, which causes the coins to drop more.
---------------------------------------------------------------
Please write any advice or suggestions.
Dear friends, request any cryptocurrency pair, currencies pair for forex, and any index that you want to be analyzed and ask any questions.
Thanks for your attention
Ethereum forecast and signalPlease write any advice or suggestions.
Dear friends, request any cryptocurrency pair, currencies pair for forex, and any index that you want to be analyzed and ask any questions.
Thanks for your attention

Ethereum forecast and ideaPlease write any advice or suggestions.
Dear friends, request any cryptocurrency pair, currencies pair for forex, and any index that you want to be analyzed and ask any questions.
Thanks for your attention

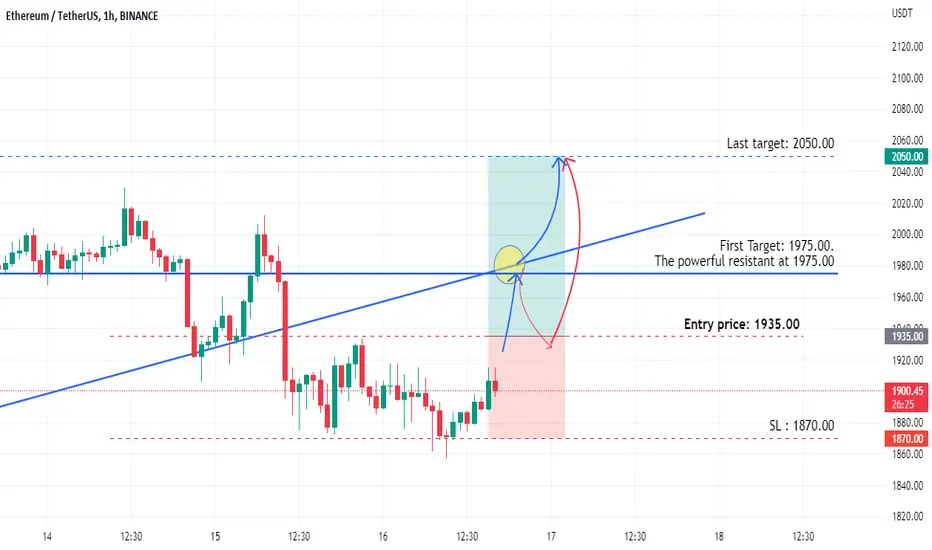
Ethereum forecast and signalLearn and Earn!
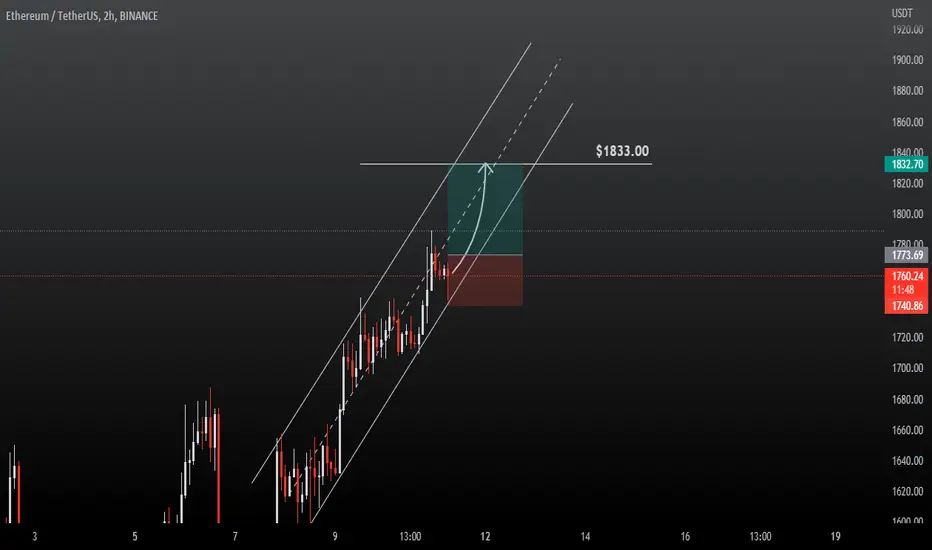
after reaching the resistance line ( first target ), we have two scenarios,
first: directly growing and hitting the last target.
two: pullback and reach the stop loss.
So after hitting the first target (which is a resistance line in this position too), close half of your trade and move the stop loss to the entry price.
---------------------------------------------------------
Pay attention!
First: Trades have a time term , and in this case, it's from now until the next 12 hours. (You can also see it in the diagram)
Second: You can see the entry price in the chart.
Before the price crosses the mentioned place, the trade position is not Active.
---------------------------------------------------------
Please write any advice or suggestions.
Dear friends, request any cryptocurrency pair, currencies pair for forex, and any index that you want to be analyzed and ask any questions.
Thanks for your attention