ETH Cell Opportunity - Ethereum Short Call Hello everyone, if you like my idea about Ethereum, do not forget to support with a like and follow. Here is the analysis for ETH, feel free to request any pair/instrument or ask any questions in the comment section below.
Best of luck!
Ethereumusd

Ethereum: Can we start going higher?!!Ethereum
Intraday - We look to Buy at 1933 (stop at 1717)
The downtrend seems to be slowing down. Preferred trade is to buy on dips. With signals for sentiment at oversold extremes, the dip could not be extended.
Our profit targets will be 2449 and 2600
Resistance: 2200 / 2400 / 2600
Support: 1900/ 1700 / 1500
Please be advised that the information presented on TradingView is provided to Vantage (‘Vantage Global Limited’, ‘we’) by a third-party provider (‘Signal Centre’) . Please be reminded that you are solely responsible for the trading decisions on your account. There is a very high degree of risk involved in trading. Any information and/or content is intended entirely for research, educational and informational purposes only and does not constitute investment or consultation advice or investment strategy. The information is not tailored to the investment needs of any specific person and therefore does not involve a consideration of any of the investment objectives, financial situation or needs of any viewer that may receive it. Kindly also note that past performance is not a reliable indicator of future results. Actual results may differ materially from those anticipated in forward-looking or past performance statements. We assume no liability as to the accuracy or completeness of any of the information and/or content provided herein and the Company cannot be held responsible for any omission, mistake nor for any loss or damage including without limitation to any loss of profit which may arise from reliance on any information supplied by Signal Centre.

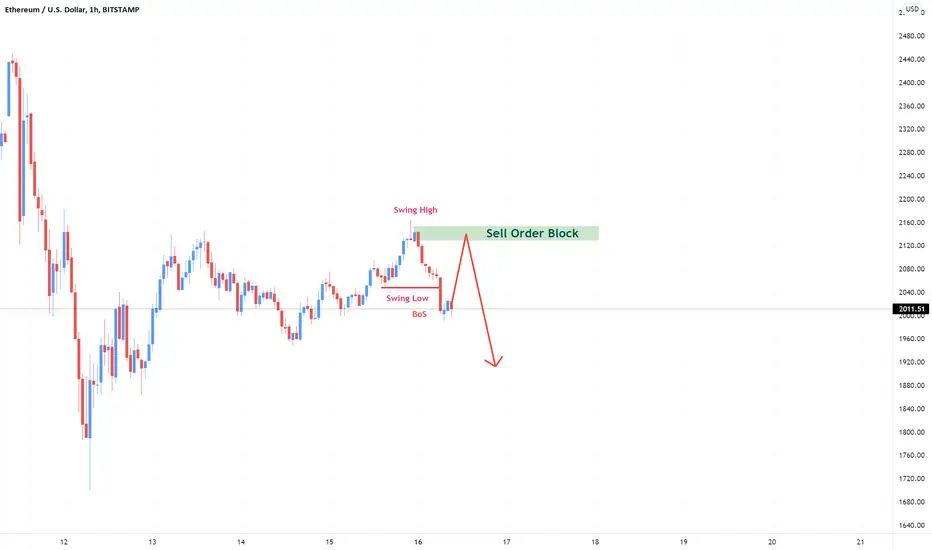
Ethereum Prediction H1Here is my view for ETHUSD on H1. The price could go down, you can put a pending order on the Order block or find an entry on LTF within OB Zone. Trade Safe!
ETH - will go below $1,000This weekly chart shows that the Weekly 20 EMA is about to cross below the 50 EMA, probably in the next few days this week.
So far we've hit all the targets on the weekly chart for ETH.
One more target left which takes us below $1,000 and I am expecting this to hit in the coming weeks.
At the time of writing this ETH is currently being rejected by the 1 Hour 20 EMA as well as being rejected by the 4 Hour 20 EMA.
The 1 Hour RSI is showing over bought and MACD is running out of gas and I am expecting ETH to continue the decline.

ETH Buy a break setup.Ethereum - Intraday - We look to Buy a break of 2141 (stop at 2059)
We are trading at oversold extremes.
Short term momentum is bullish.
A break of the recent high at 2140 should result in a further move higher.
20 4hour EMA is at 2141.
Our profit targets will be 2347 and 2397
Resistance: 2140 / 2250 / 2400
Support: 2050 / 1950 / 1900

ETHUSD - Testing New Indicators This indicator shows Fibonacci levels
Right now on ETHUSD we are bottomed at the same levels as late 2018 and 2020 COVID
See how it plays out

ETHUSD - Head and Shoulder Formations An idea exploring a repeating or comparable Head and Shoulders formation
The white rectangle is the comparable place in price
I don't think a moon shot as big as the 2016 will follow, simply because of the age of ETH compared to 2016
Growth will resume although.

ETH Buy a break setup.Ethereum - Intraday - We look to Buy a break of 2481 (stop at 2414)
Short term momentum is bullish.
Short term MACD has turned positive.
A break of the recent high at 2480 should result in a further move higher.
We are trading at oversold extremes.
Our profit targets will be 2648 and 2698
Resistance: 2480 / 2580 / 2700
Support: 2400 / 2300 / 2200

Ethereum buy the dip.Ethereum - Intraday - We look to Buy at 2321 (stop at 2244)
With signals for sentiment at oversold extremes, the dip could not be extended.
2300 has been pivotal.
We look to buy dips.
Our profit targets will be 2518 and 2578
Resistance: 2500 / 2580 / 2700
Support: 2400 / 2300 / 2160

ETHUSD - If the Bear Action ContinuesI have placed a good entry point at around ~1500 if price continues to decline
This correlates with two prior areas of resistance, which in turn provide a future support for price
HODL

ETH/Tether 1DDue to the recent decline of Bitcoin , if the market is bullish , it is possible for the trend to return and achieve the desired profit.

ETH Sell into the daily 20 EMA.Ethereum - Intraday - We look to Sell at 2935 (stop at 2983)
2981 has been pivotal.
Our short term bias remains negative.
Preferred trade is to sell into rallies.
20 1day EMA is at 2935.
Our profit targets will be 2812 and 2772
Resistance: 2850 / 2900 / 2980
Support: 2800 / 2760 / 2720

Ethereum sell a break of $2800.Ethereum - Intraday - We look to Sell at 2788 (stop at 2831)
Daily signals are mildly bearish.
Short term momentum is bearish.
A break of bespoke support at 2800, and the move lower is already underway.
Our profit targets will be 2672 and 2632
Resistance: 2880 / 2950 / 3030
Support: 2800 / 2760 / 2700

ETH Buy a break setup.Ethereum - Intraday - We look to Buy a break of 3041 (stop at 2993)
Price action is forming a bullish flag which has a bias to break to the upside.
A break of the recent high at 3037 should result in a further move higher.
Short term momentum is bullish.
Majority of the initial daily losses being recaptured.
Our profit targets will be 3166 and 3216
Resistance: 3040 / 3080 / 3150
Support: 2980 / 2950 / 2880

ETH Sell a break setup.Ethereum - Intraday - We look to Sell a break of 2976 (stop at 3024)
Short term bias is mildly bearish.
2977 has been pivotal.
A break of bespoke support at 2980, and the move lower is already underway.
Our profit targets will be 2851 and 2801
Resistance: 3080 / 3150 / 3200
Support: 2980 / 2950 / 2900

Ethereum ETH Price Targets and Stop LossETH/USDT
Entry Range: $2975 - 3120
Take Profit 1: $3360
Take Profit 2: $3545
Take Profit 3: $3740
Stop Loss: $2800
entry chart

ETHUSD Dominant Trendline and MA ContinuationConsider that the dominant trendline hasn't been broken yet
A bullish attempt has already been seen at this Trend Line
Also the wedge that the price has provided us is quite a large range, providing a possibility of a huge price increase, comparable to the one seen in 2021 May
The 200MA wouldn't have to curve much to begin to rise again
A great long entry point

ETH ichimoku positive signsHi guys, ETH is not that downtrend ichimuko-wise...
please make sure you don't ignore the positive signs...
It's not a buy setup. its a confirmation for more consevative downward strategies.
for example: do not open high leverage short positions unless you see ichimuko uptrend signals are failed.
Follow and comment your ideas.

Ethereum buy the daily 20 EMA.Ethereum - Intraday - We look to Buy at 3103 (stop at 3038)
Daily signals are bullish.
We look to buy dips.
We look for a temporary move lower.
20 1day EMA is at 3080.
Our profit targets will be 3278 and 3338
Resistance: 3300 / 3400 / 3500
Support: 3200 / 3100 / 3000

ETH Buy a break setup.Ethereum - Intraday - We look to Buy a break of 3072 (stop at 2998)
Bullish divergence is expected to support prices.
A break of 3070 is needed to confirm follow through bullish momentum.
Further upside is expected and we look to set longs in early trade.
A lower correction is expected.
Our profit targets will be 3258 and 3298
Resistance: 3100 / 3150 / 3200
Support: 3000 / 2900 / 2800

Ethereum (ETH) highly undervaluedThis chart image shows some historical data for Ethereum since her big breakout a little over a year ago. I have continued to believe that ETH will rise back up to my "Big Yellow Line" (the BYL) , eventually. When you have an overall positive trend within the 4H/daily resolution of a token, it will usually ride through ups and downs, and snap back to the trend eventually.
When a token drops far below that overall +trend --it's usually a very good indicator for anyone who wants a good jump on a long position.
♠️🤫🐿

Ethereum Update 6/4/22A conclusion can be drawn from the RSI that price is in a similar position as it was in 2017 (white circle)
This correlates with the bear market fibonacci circle which shows both periods of growth in the 2.618 fibonacci circle (2.618)
It also correlates with the 50MA, which is present in both scenarios
A big move is coming if the larger trendline drawn is now the dominant one

ETHUSD Daily Analysis 3/4/2022Ethereum has created a nice double bottom on a slight incline
This is similar to its last bull rejection
Expect in the coming days/week sharp growth as the larger pattern, including (green rectangle small) plays out in an inverted fashion
Bullish times!
