ETH/USDT Technical Roadmap | Bullish Swing & Day Trade Levels📌 ETH/USDT "Ethereum vs Tether" Crypto Market Plan (Swing/Day Trade)
🔹 Plan: Bullish (Pending Order Breakout Plan)
We are preparing for a breakout setup around 10.000⚡ TRIANGULAR MOVING AVERAGE BUY PLAN.
Price action shows strong buyer strength with signs of institutional accumulation on dips.
🛠️ Thief Strategy (Layered Entry Style)
This strategy uses multiple limit orders (layering method) after breakout confirmation.
✅ Example buy limit layers (can be adjusted to your own risk):
4350
4370
4390
4420
👉 Please set a TradingView alert near the breakout level so you don’t miss confirmation.
🛑 Stop Loss (Risk Management)
📍 Suggested risk level: 4300 (after breakout confirmation)
This is the Thief SL reference point, but remember:
Adjust your SL based on your personal risk tolerance & strategy.
🎯 Target (Profit Zone)
Price may face resistance near moving averages with possible overbought traps.
📍 Planned exit zone: 4600
Manage your own TP — use targets that fit your risk/reward ratio.
🔗 Related Pairs to Watch
BINANCE:BTCUSDT – Bitcoin breakout strength often leads ETH moves.
BINANCE:ETHBTC – Key ratio showing ETH’s relative strength vs BTC.
BINANCE:SOLUSDT – High-beta crypto that often correlates with ETH sentiment.
BINANCE:BNBUSDT – Another major altcoin for cross-market momentum comparison.
✨ “If you find value in my analysis, a 👍 and 🚀 boost is much appreciated — it helps me share more setups with the community!”
#ETH #ETHUSDT #Ethereum #Crypto #SwingTrade #DayTrade #BreakoutStrategy #LayeredEntries #CryptoTrading #TradingPlan
Ethereumusd
ETH/USDT Bullish Breakout Heist Plan – Are You Ready to Strike?🔥💎 ETH/USDT Crypto Heist Plan: Swing Trade Edition 💎🔥
Dear Thief OG’s & Market Robbers 🕵️♂️,
The vault is loaded, and Ethereum vs. Tether (ETH/USDT) is about to get cracked wide open. We’ve spotted the weak spot in the system — and this time, it’s a bullish breakout heist. 📈💰
📊 Heist Blueprint: The Setup
Asset: ETH/USDT (Crypto) 🌐
Style: Swing Trade ⏰
Plan: Bullish Breakout & Layered Entries ⚡
🚪 Entry Points (Breaking Into the Vault)
Breakout Entry: Break above 4800.00 — that’s our signal to strike 🚀
Layered Buy Orders (Thief Style): Stack your loot with multiple limit layers:
4700.00
4600.00
4500.00
(You can add more layers depending on your loot bag 💼)
🔔 Pro Tip: Set TradingView alarms at 4800.00 so you don’t miss the breakout moment.
🛑 Stop Loss (Cover Your Tracks)
Thief SL placed at 4200.00 once breakout confirms ⚠️
Adjust your stop loss based on your own risk style & strategy — every thief has their own getaway plan. 🏃♂️💨
🎯 Target (Escape Point)
Police barricade seen at 5300.00 🚔
Safer escape: 5200.00 — grab the loot and vanish before the cops arrive. 💸
📡 Why This Heist Works
Breakout momentum above 4800 shows ETH is ready to run.
Layering strategy = smarter accumulation while minimizing risk.
Targeting clean levels where liquidity + resistance hide.
⚠️ Risk Warning: Every heist has danger — manage size, use layers, and don’t overexpose. Protect your loot like a true Thief OG. 🏴☠️
💥 Support the Crew! 💥
Drop a like 👍, share a comment 💬, and follow 🚀 for more Thief Trader Heist Plans. The more noise we make, the stronger our gang becomes! 🕵️♂️💰

Ethereum Not Dead- i know some peoples think ETH will go to 250$ or 500$, so wait for it...
- I've always maintained that I'm not a fan of ETH because of its scalability limitations and centralization, for that reason ETH needs some messy L1...L2...etc..
- That said, my opinion doesn’t matter much, ETH is here to stay. The Ethereum ecosystem hosts thousands of projects; I’d say it’s too big to fail.
- i used Bitstamp exchange to look further back in the chart's history.
- i simplified this monthly chart so much that even a 10 year old kid could understand it, just check the RSI low levels and compare it with previous years. Again, check the max RSI level for the previous ATHs.
- i won't discuss where to buy because, whether you get ETH at $1,800 or $1,500, the bull run for ETH and Altcoins hasn't started yet.
Happy Tr4Ding !

Ethereum Beautiful RetestQuick Update :
- Remember what i always insist on :
" Resistances often tend to become supports, and supports often turn into resistances "
- You don’t need ten indicators to find the way, keep your chart simple. Indicators are just supplements, helping confirm when you already have a good chance of being right.
- The target for ETH remains unchanged, it could reach around 15,000 or even higher accordling to Fibonnacci.
Be Ready for Uptober
Happy Tr4Ding !

Ethereum - The $15.000 price target!🚀Ethereum ( CRYPTO:ETHUSD ) will break out now:
🔎Analysis summary:
Looking at the higher timeframe, it is obvious that Ethereum has been consolidating for the past four years. But now, Ethereum is starting to break above the previous all time high. If Ethereum actually confirms the breakout, we are talking about an expected move of another decent +250%.
📝Levels to watch:
$15.000, $4.000
SwingTraderPhil
SwingTrading.Simplified. | Investing.Simplified. | #LONGTERMVISION

Ethereum Price Bounces Off 7-Week Low—Future Still Promising?Ethereum trades at $4,187, just under the $4,222 resistance level after rebounding from a $3,872 low. This recovery highlights buyer interest at support levels. However, the broader market remains cautious, waiting to see whether Ethereum can sustain momentum and reclaim critical price barriers.
If Ethereum breaches $4,222, it could flip this level into support, potentially extending gains. Still, breaking above $4,500 will be difficult without fresh inflows. Limited liquidity and investor hesitation could keep Ethereum rangebound, consolidating until stronger catalysts emerge in the market.
On the downside, failure to maintain support could reignite bearish sentiment. If selling intensifies, Ethereum might slip through $4,074 and retest $3,872. Such a decline would invalidate the bullish outlook.

Ethereum Price Steady at $4,500—Here’s What’s Ahead For ETHEthereum’s price is currently trading at $4,468, just shy of the $4,500 resistance. The altcoin has been consolidating near this level, showing resilience even as broader market trends remain mixed.
Given the supportive market sentiment and accumulation trend, Ethereum is poised to reclaim $4,500 as a support floor. Successfully flipping this level could pave the way for ETH to challenge the $4,775 resistance in the coming days.
However, downside risks remain if bearish pressure builds. In such a scenario, Ethereum could lose footing and slip to the $4,307 support level. A drop to this zone would invalidate the bullish thesis temporarily and deepen potential investor losses

$8 Billion ETH Maturing May Push Ethereum Price to New HeightsEthereum is currently trading at $4,495, just below the $4,500 support line. If the decline extends, ETH may slip toward $4,307, but deeper losses appear less likely given the strong investor positioning.
The maturing supply and bullish long-term outlook indicate that Ethereum could soon reverse course. With fewer coins entering circulation, the altcoin has structural support for renewed upward momentum despite short-term volatility.
If Ethereum reclaims $4,500 as support, the path to $4,775 opens. A move past this level would invalidate the bearish thesis, reinforcing confidence that ETH could continue its climb toward new highs

The Fed Meeting and Its Further Play in EthereumCRYPTOCAP:ETH has returned to the trendline. Even if there another short-term drop, thats just part of the futures game - it can't happen without it.
Ahead of the Fed meeting, the market will likely move upward, so that no one can buy cheap after a positive decision on lowering the key rate.
Looking at the recent candles, enough longs have been closed to allow growth without abuse.
Funding across all exchanges has stabilized.
CRYPTOCAP:ETH outflows are starting to exceed inflows.
There nothing to look for down below - everything points to growth.
If it’s not too much trouble, support the post. Wishing you all the best!

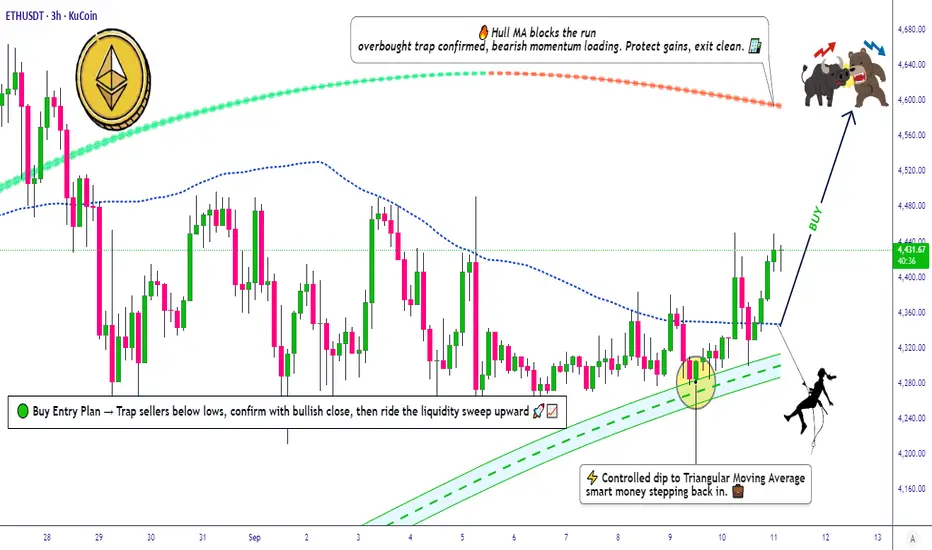
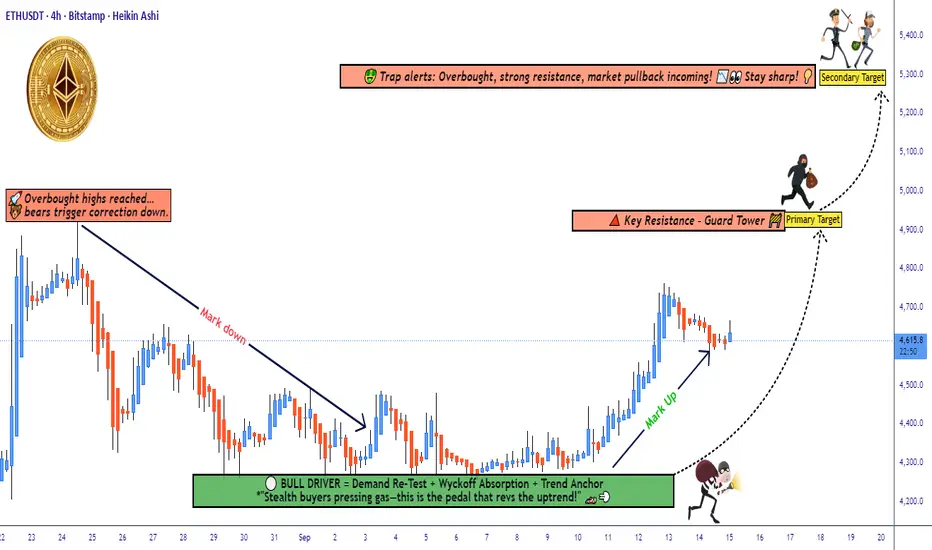
ETH/USDT Technical Outlook: Demand Layer Entries vs Trap Risk🚀 ETH/USDT | Ethereum vs Tether 💎
Crypto Market Money Looting Plan (Swing/Day Trade)
📌 Trade Plan (Bullish Outlook)
Setup: Demand Re-Test ✅ + Wyckoff Absorption 🔑 + Trend Anchor ⚓ (buyers confirmed presence)
Entry Style (Thief Layers 🪙): Using layered limit entries — examples: 4500, 4550, 4600, 4650 (you can add more layers as per your own method).
Stop-Loss (Protect the Vault 🔒): Example zone near 4400 after breakout. Adjust SL to fit your own risk appetite & personal strategy.
Target 🎯:
🎯 Primary: 4900 (local resistance)
🎯 Secondary: 5300 (major resistance / overbought zone)
🧾 Notes for Thief OG’s
This plan is not financial advice, only an idea. Always manage your own entries, SL, and TP.
Think of it as a vault strategy: take money, then protect money.
🔗 Related Pairs to Watch
BINANCE:BTCUSDT → ETH often follows BTC’s momentum. A BTC breakout/false move can affect ETH.
BINANCE:ETHBTC → Good pair to confirm ETH’s relative strength vs BTC.
BINANCE:SOLUSDT & BINANCE:BNBUSDT → Correlated majors; watch for rotation of capital in altcoins.
✨ “If you find value in my analysis, a 👍 and 🚀 boost is much appreciated — it helps me share more setups with the community!”
#ETH #Ethereum #Crypto #USDT #Altcoins #SwingTrade #DayTrading #LayerStrategy #Wyckoff #ThiefPlan #TradingView #CryptoTrading
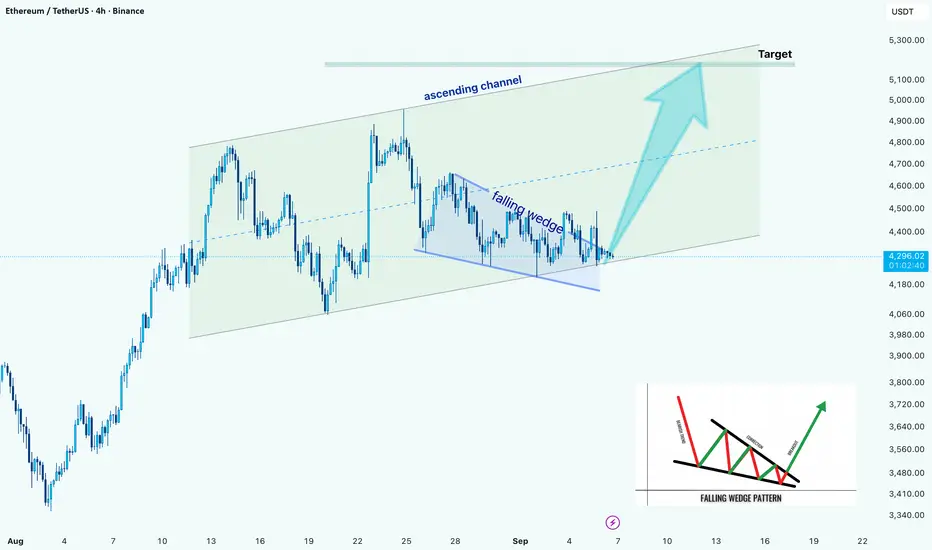
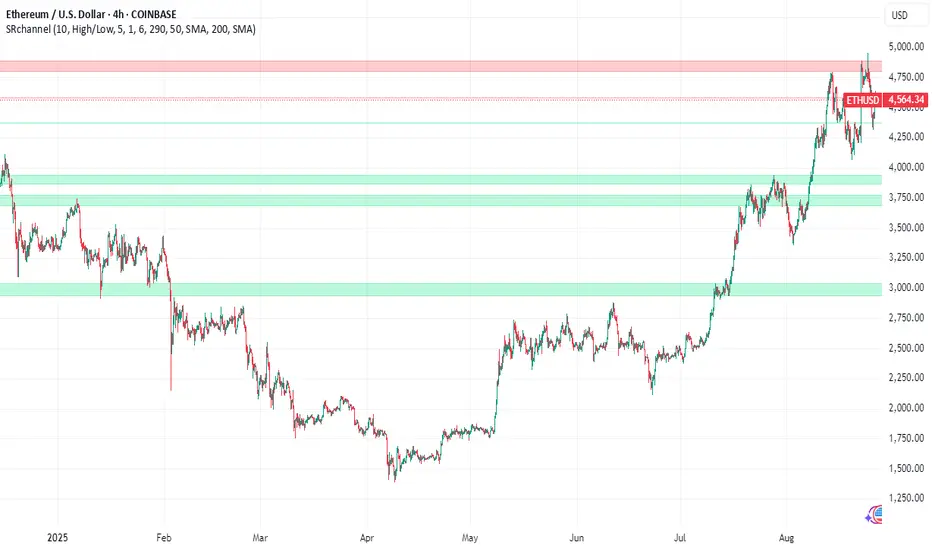
ETH/USD –> Falling Wedge Breakout Within Ascending ChannelHello guys!
Ethereum is showing a strong technical setup on the 4H chart. Price has been respecting an ascending channel since early August, and within this structure, a falling wedge has recently formed.
Right now, ETH is testing the wedge breakout point near the bottom line of the channel. If buyers manage to hold momentum here, we could see price extending toward the channel’s upper boundary, with the next major target sitting around $5,100 – $5,300.
On the downside, failure to sustain above the wedge support may lead to a retest of the lower channel trendline around $4,100 – $4,150, which remains a critical support area for bulls to defend.
Ethereum ETH at Key Resistance: Equal Highs and Liquidity Play🟣 Ethereum (ETH) Update 🟣
ETH is currently bullish 🟢📈 and pressing into a key resistance level ⚖️ where we see multiple relative equal highs 📍📍 forming consecutively. This is a major level 🔑.
Here’s what I’m watching:
If price trades above this resistance 🚀, it will likely trigger buy stops 🎯, providing the liquidity 💧 needed for a potential pullback 🔽.
If price then breaks through decisively 💥, I’ll be looking for a retest + hold 🔄, followed by a bullish break of market structure (BOS) 🔓 as confirmation to get long 🟢.
⚠️ This is educational only, not financial advice. 📚

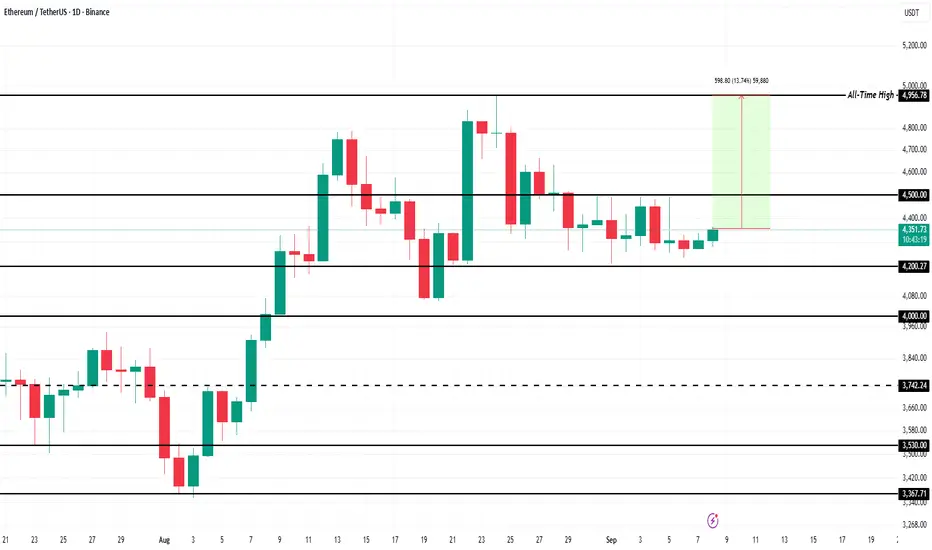
Ethereum Could Hit All-Time High in The First Week Of SeptemberEthereum’s price is currently at $4,315, showing limited movement after days of stagnation. The altcoin king continues to hover around the $4,331 support level, attempting to secure it as a foundation for a potential upward breakout in the near term.
The Chaikin Money Flow (CMF) indicates rising inflows, a positive signal for Ethereum’s momentum. If the indicator crosses above the zero line, it will confirm stronger inflows. This could push ETH past $4,331 and toward $4,500, reducing the gap to its $4,956 all-time high.
However, risks remain if investor sentiment weakens. Should selling pressure increase, Ethereum could struggle to maintain upward momentum. In this scenario, ETH might either consolidate sideways above $4,222 or fall through it, retesting $4,007 as support and invalidating the bullish thesis for the short term.
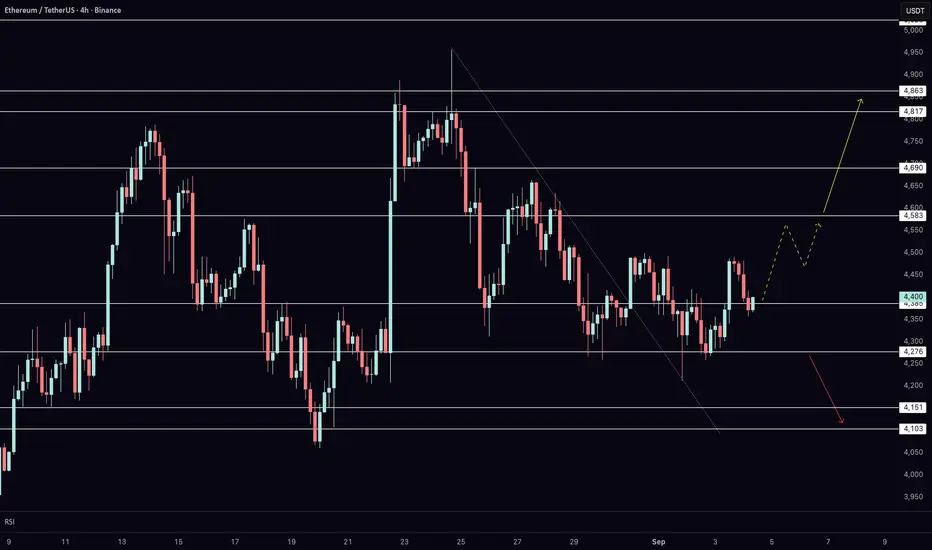
Key Levels to Watch on Ethereum Today After NFP & Bitcoin RallyEthereum is trading right at key resistance on the 4-hour chart, and today’s price action could set the tone for the next major move. After defending support at $4,276, ETH has bounced back into the $4,383 level, where buyers and sellers are now battling for control. In this video, I break down the short-term roadmap, explain the critical support and resistance levels, and outline the scenarios that could unfold depending on today’s reaction.
With the U.S. NFP release adding volatility across markets and Bitcoin showing fresh bullish momentum, Ethereum is at a decisive moment. A confirmed breakout above resistance would open the path toward $4,582, $4,689, and $4,862, while failure to hold support shifts focus back to $4,148 and $4,103. Watch closely — the coming sessions are likely to provide clarity on whether ETH is ready to extend higher.
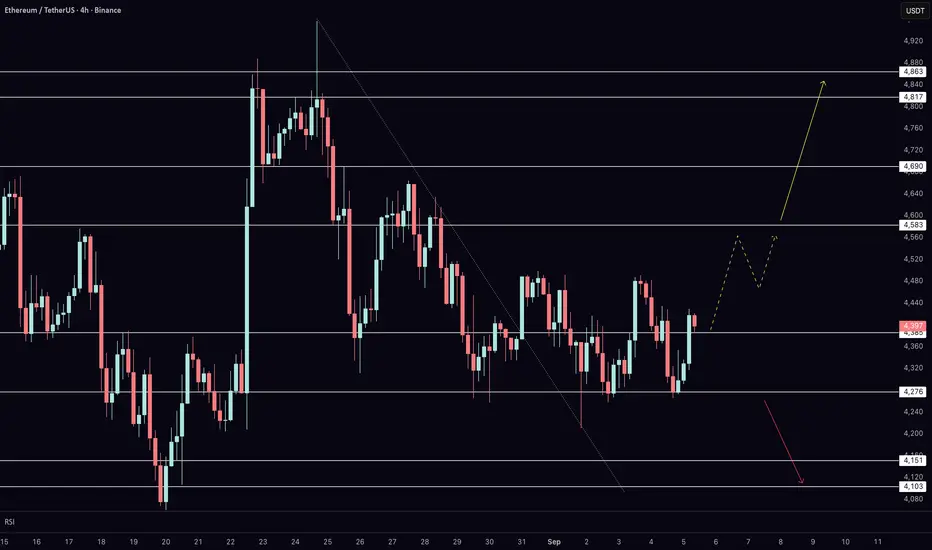
Ethereum at $4,382 – Upside or Another Retest of $4,276?My main bias remains more upside. On the 4-hour chart, Ethereum is defending $4,280 support and testing $4,380 resistance. A break and hold above $4,380 opens the path toward $4,580, $4,690, and $4,860. Failure to hold $4,280 would shift focus to $4,150 and $4,100.
Do you also want me to round the prices in the full transcript I wrote earlier, so it matches this simplified style?
Ethereum Whales Scoop Up 260K ETH, Fueling $5K Recovery Hopes
The cryptocurrency market is witnessing a significant shift as Ethereum whales accumulate massive positions, with recent data showing an unprecedented 260,000 ETH purchased in just 24 hours. This substantial whale activity is generating considerable optimism among investors and analysts, who are now eyeing a potential recovery toward the psychologically important $5,000 price level.
Massive Whale Accumulation Signals Market Confidence
Large-scale Ethereum holders, commonly referred to as "whales" in the cryptocurrency community, have demonstrated remarkable confidence in ETH's future prospects through their recent buying behavior. The acquisition of 260,000 ETH in a single day represents approximately $650 million worth of Ethereum at current market prices, indicating that institutional and high-net-worth investors are positioning themselves for what they perceive as an imminent price rally.
This whale accumulation pattern is particularly significant given the broader market context. While many retail investors remain cautious following recent market volatility, sophisticated investors with substantial capital reserves are taking advantage of current price levels to build sizeable positions. The concentrated nature of these purchases suggests coordinated confidence among major market participants rather than isolated buying decisions.
The timing of this accumulation is noteworthy as well. Ethereum has been trading in a consolidation phase following its previous rally, and whale activity often serves as a leading indicator of upcoming price movements. Historical data shows that significant whale accumulation periods frequently precede major price breakouts, lending credence to the bullish sentiment surrounding ETH's near-term prospects.
Bitcoin Profit Rotation Driving Ethereum Demand
A particularly interesting aspect of the current market dynamics is the apparent rotation of capital from Bitcoin into Ethereum. As Bitcoin approaches resistance levels and shows signs of consolidation, savvy investors are taking profits from their BTC positions and reallocating these funds into ETH. This rotation strategy reflects a sophisticated understanding of market cycles and the relative value proposition between the two leading cryptocurrencies.
Bitcoin's recent performance has been strong, but many analysts believe that Ethereum may offer superior upside potential in the coming months. The rotation from BTC to ETH is not merely a short-term trading strategy but reflects fundamental beliefs about Ethereum's technological advantages and ecosystem growth potential. This capital rotation is providing additional buying pressure for ETH while simultaneously reducing selling pressure from profit-taking activities.
The scale of this rotation is substantial enough to impact market dynamics significantly. When large holders move capital between cryptocurrencies, it often creates momentum that smaller investors follow, potentially amplifying the initial movement. This phenomenon could be contributing to the sustained buying pressure we're observing in Ethereum markets.
Technical Analysis Points to $5K Target
From a technical analysis perspective, the current whale accumulation is occurring at what many chartists consider optimal entry levels. Ethereum's price action has formed what appears to be a strong support base, and the addition of substantial whale buying is providing the foundation for a potential breakout to higher levels.
The $5,000 price target that has emerged in analyst discussions is not arbitrary. This level represents a significant technical milestone that would place Ethereum at new all-time highs, surpassing its previous peak reached during the 2021 bull market. Achieving this target would require approximately a 50-60% rally from current levels, which, while substantial, is not unprecedented for Ethereum during strong market phases.
Several technical indicators are aligning to support this bullish thesis. The accumulation by whales is reducing the available supply on exchanges, creating conditions for price appreciation when demand increases. Additionally, on-chain metrics show declining ETH reserves on major exchanges, suggesting that holders are moving their assets to cold storage with long-term holding intentions.
Fundamental Drivers Supporting Price Recovery
Beyond technical factors, several fundamental developments are supporting the case for Ethereum's price recovery. The network's transition to proof-of-stake consensus has fundamentally altered ETH's economic model, introducing deflationary mechanisms that reduce supply over time. This structural change creates long-term upward pressure on prices, particularly when combined with sustained demand.
The growth of decentralized finance (DeFi) continues to drive demand for ETH as the primary collateral and gas token for the Ethereum ecosystem. Recent developments, including major DeFi protocols expanding their offerings and new innovations in yield generation, are attracting both institutional and retail capital to the Ethereum network. This increased activity translates directly into increased demand for ETH.
Layer 2 scaling solutions are also contributing to Ethereum's value proposition by making the network more accessible and cost-effective for users. While some initially worried that Layer 2 solutions might reduce demand for mainnet ETH, the opposite has proven true. These scaling solutions are enabling new use cases and bringing more users to the Ethereum ecosystem, ultimately increasing overall network value and ETH demand.
Institutional Adoption Accelerating
The whale accumulation we're observing is likely driven, at least in part, by increasing institutional adoption of Ethereum. Major corporations, investment funds, and financial institutions are recognizing Ethereum's potential as both a store of value and a platform for innovation. This institutional interest is providing a stable foundation of demand that supports higher price levels.
Recent regulatory clarity in various jurisdictions has made it easier for institutions to hold and trade Ethereum. The approval of Ethereum ETFs in multiple markets has provided traditional investors with regulated exposure to ETH, broading the potential investor base significantly. This institutional infrastructure is creating new channels for capital to flow into Ethereum, supporting the whale accumulation trend.
The institutional adoption story extends beyond simple investment holdings. Many institutions are building applications and services on Ethereum, creating operational demand for ETH that goes beyond speculative investment. This utility-driven demand provides a more stable foundation for price appreciation than speculation alone.
Market Sentiment and Risk Factors
While the whale accumulation and associated price targets are generating significant optimism, it's important to consider potential risk factors that could impact Ethereum's trajectory. Macroeconomic conditions continue to influence cryptocurrency markets, and changes in monetary policy or economic outlook could affect investor appetite for risk assets like ETH.
Regulatory developments remain a key consideration for Ethereum's future. While recent regulatory clarity has been generally positive, ongoing discussions about cryptocurrency regulation in major markets could introduce volatility. However, Ethereum's established position and broad ecosystem make it less vulnerable to regulatory challenges than smaller, less established cryptocurrencies.
Competition from other blockchain platforms also represents a consideration, though Ethereum's first-mover advantage and network effects provide substantial competitive moats. The ongoing development of Ethereum 2.0 and associated scaling solutions are addressing many of the performance concerns that competitors have attempted to exploit.
Looking Ahead: October Catalyst Potential
Many analysts are pointing to October as a potential catalyst month for Ethereum's price recovery. This timing aligns with historical patterns showing that the fourth quarter often brings increased cryptocurrency market activity. The combination of whale accumulation, institutional adoption, and seasonal patterns could create a perfect storm for price appreciation.
The prediction of a potential "bear trap" in September, where prices might temporarily decline to the mid-$3,000 range before surging in October, reflects sophisticated market timing strategies. Such scenarios often catch retail traders off-guard while providing additional accumulation opportunities for sophisticated investors who understand market cycles.
Conclusion
The recent whale accumulation of 260,000 ETH represents a significant vote of confidence in Ethereum's future prospects. Combined with capital rotation from Bitcoin, technical breakout potential, and strong fundamental drivers, conditions appear favorable for a substantial price recovery toward the $5,000 target level.
While short-term volatility remains possible, the sustained whale buying suggests that sophisticated investors are positioning for longer-term appreciation. The combination of reduced supply through staking and burning mechanisms, increased institutional adoption, and ongoing ecosystem development creates a compelling investment thesis for Ethereum.
Investors should remain aware of potential risks and market volatility, but the current accumulation pattern by whales provides strong evidence that major market participants expect significant appreciation in Ethereum's value. As the cryptocurrency market continues to mature and institutional adoption accelerates, Ethereum appears well-positioned to benefit from these broader trends, potentially making the $5,000 price target achievable in the coming months.
The convergence of technical, fundamental, and sentiment factors creates an unusually positive outlook for Ethereum. While past performance doesn't guarantee future results, the current whale accumulation pattern mirrors successful accumulation phases that have preceded major rallies in Ethereum's history, suggesting that similar outcomes may be possible in the current market cycle.

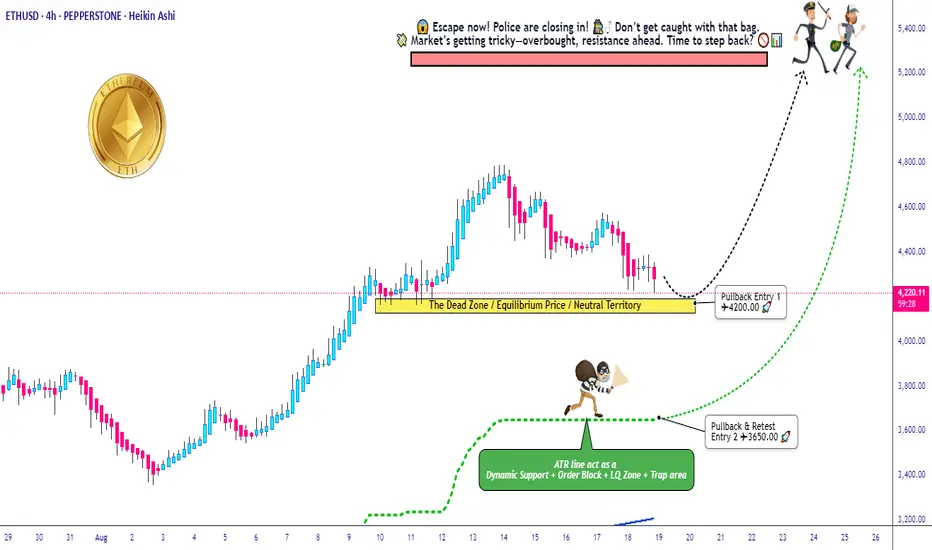
Big Crypto Heist: ETH/USD Swing Plan Targeting 5200 Exit!🚨💎ETH/USD “Ethereum vs U.S Dollar” Crypto Heist Plan (Swing Trade)💎🚨
Dear Ladies & Gentlemen… my Thief OG’s 🕶️💰, the vault is open and the police are distracted — time for the Ethereum Heist Plan!
Entry Plan (Pullback Loot Zones)
Pullback Entry 1: 💵 4200.00
Pullback Entry 2: 💵 3650.00
Load your bags in layers (Thief layering strategy – multiple buy limit orders). Patience is the key, we strike when guards are weakest.
🛑 Stop Loss (Escape Route)
Entry 1 SL: 3850.00
Entry 2 SL: 3300.00
👉 Adjust your SL according to your risk appetite & strategy — every thief has their own escape route.
🎯 Target (Cash-Out Point)
Police barricade ahead! 🚔💨 Secure your loot & exit before capture:
Take Profit @ 5200.00 🤑💸
📜 Thief Note:
This ETH/USD setup is a bullish robbery mission 🕵️♂️. Market guards (bears) are getting weaker, giving us the opening. Our layered pullback entries ensure we don’t rush the vault — we strike smart, not desperate.
⚡ Always remember: news releases = alarm triggers 🚨. Stay sharp, use trailing stops, and never get too greedy.
💖 If this plan helps your heist bag grow — Hit the Boost Button 💥 and power up our robbery crew. Together, we raid the markets daily with the Thief Trading Style. 🏆💪💰
🚀 Stay ready, stay sneaky… The next target is always around the corner.
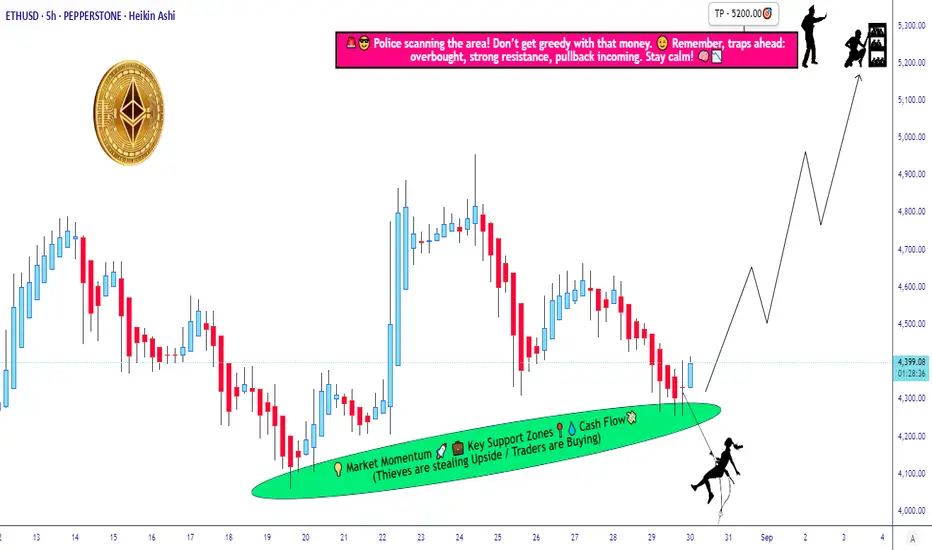
Stealing Profits from ETH! Bullish Layer Strategy Activated🔓💰 ETH/USD "Ethereum vs. Dollar" Money Heist Plan 💰🔓
🎯 Plan: Bullish Robbery | Swing/Day Trade
💎 Layered Entries | Precision Loot | Multi-Bag Grab
🚀 Target: 5200.00 | 🛑 Stop Loss: 4060.00
🚨👀 Attention Traders, Crypto Bandits & Market Looters! 👀🚨
The Ethereum vault is wide open – and Thief Trader is here with the LAYERED ENTRY STRATEGY. Stack those buy limits like gold bars in a secret vault. 🏦💎
💥 ENTRY: Any Price is a Good Price 💥
Thief style means we don’t chase – we LAYER.
⚔️ Multiple limit entries:
4400.00
4300.00
4200.00
(Add more layers if you’re savage enough.)
Every dip is a robbery opportunity – we’re not here to beg, we’re here to loot.
🔐 STOP LOSS: 4060.00 🔐
This is Thief’s SL Zone – where the cops show up.
OG Thieves know: adjust your SL to your own heist plan & risk appetite.
💸 TARGET: 5200.00 💸
That’s the police barricade – take the cash and escape before the sirens.
Secure the bag, don’t get greedy.
🧠 Thief Trader Secrets:
📊 Layered entries = survival + sniper precision.
⚡ Swing traders ride it, day traders loot it, investors just chill & count.
🔔 Trail your SL – don’t let profits get hijacked.
⚠️ HEIST PROTOCOL:
✅ No panic entries.
✅ Risk small, layer smart.
✅ Remember: patience = payday.
❤️🔥 Smash that 💥 BOOST BUTTON 💥 if you’re rolling with the Thief Squad.
Follow for the next Market Heist Plan – we rob, we layer, we escape with bags full. 💼💰
“Markets pay the disciplined thieves, not the desperate gamblers.” – Thief Trader
🤑📈🐂 #ETHUSD #CryptoHeist #ThiefTrader #EthereumHeist #LayeredEntries #CryptoTrading #RobTheMarket #MoneyHeistETH
Ethereum - Here comes the final breakout!🚀Ethereum ( CRYPTO:ETHUSD ) breaks the all time high:
🔎Analysis summary:
Finally, after a consolidation of about four years, Ethereum is back at the previous all time high. With the recent rally of more than +200%, bulls are flexing their muscles, preparing the breakout. So far, everything is playing out according to plan with new all time highs soon.
📝Levels to watch:
$5.000
SwingTraderPhil
SwingTrading.Simplified. | Investing.Simplified. | #LONGTERMVISION

Ethereum Exit Queue Hits $5B: Wall Street’s Big Bet?
Ethereum Exit Queue Hits $5B: Sell Pressure or Wall Street’s Big Bet?
Ethereum continues to dominate crypto headlines in 2025. The network’s staking system has reached an unprecedented milestone with nearly $5 billion worth of ETH awaiting withdrawal—a development that has sparked both optimism and concern. While some fear that this backlog could translate into significant sell pressure, others see it as part of a broader realignment toward institutional adoption.
At the same time, Ethereum’s spot ETFs are outperforming Bitcoin ETFs by a wide margin, drawing in nearly $1.83 billion in just five days—ten times the inflows of Bitcoin funds. This surge highlights a growing narrative: Wall Street is tilting its focus toward Ethereum, not only as a cryptocurrency but as a foundational layer of modern finance.
This article examines the implications of the record exit queue, the rise of Ethereum ETFs, and whether ETH is poised to outperform BTC as the crypto market’s dominant asset.
Ethereum’s Record Exit Queue: A $5B Test for the Market
Ethereum’s exit queue refers to the backlog of stakers who have requested to withdraw their ETH from the staking contract. Following Ethereum’s transition to proof-of-stake in 2022 and the Shanghai/Capella upgrade in 2023, staked ETH has become liquid, enabling participants to lock and unlock their holdings as they choose.
Today, that queue has swelled to nearly 5 million ETH—worth around $5 billion. This is the largest exit queue in Ethereum’s history, and it raises critical questions:
1. Will this ETH be sold on the open market?
After a 72% rally in the past three months, many stakers may be tempted to take profits, especially those who locked in ETH at lower prices during the bear market. A mass sell-off could put downward pressure on prices.
2. Or is this a rotation of capital?
Not all withdrawals translate into selling. Many institutional investors may be withdrawing ETH to redeploy it into spot ETFs, where liquidity, custodial security, and regulatory approval are more attractive. Others may seek higher yields in decentralized finance (DeFi) protocols, liquid staking derivatives, or alternative strategies.
3. What about long-term holders?
A sizable portion of Ethereum’s stakers are long-term believers in the protocol. For them, withdrawing doesn’t necessarily mean exiting—rather, it may signal repositioning into newer financial products that better fit their strategies.
Ultimately, the exit queue is both a sign of Ethereum’s growing liquidity and a potential near-term overhang on price.
The 72% Rally: Profit-Taking or Momentum?
Ethereum’s price surge—up 72% in just three months—gives context to the withdrawal queue. After a prolonged bear market, ETH holders have seen one of the strongest rallies in years. For many, the exit queue represents an opportunity to lock in profits at multi-month highs.
However, the rally is not just speculative. Several fundamental drivers are fueling Ethereum’s rise:
• ETF approvals and inflows are bringing unprecedented institutional demand.
• Layer 2 scaling solutions such as Arbitrum, Optimism, and Base are driving transaction volumes while reducing costs.
• Tokenization pilots by major banks and asset managers are increasingly choosing Ethereum as a settlement layer.
This means the rally is underpinned by both sentiment and structural adoption, making it harder to dismiss as a short-lived pump.
Ethereum ETFs: Outshining Bitcoin
One of the most striking developments is the flow of capital into Ethereum ETFs. In just five days, spot Ether ETFs have attracted $1.83 billion in inflows, compared to only around $180 million into Bitcoin ETFs. This 10-to-1 ratio in favor of Ethereum is rare, as Bitcoin has traditionally dominated institutional flows.
Why are ETFs favoring Ethereum?
1. Utility Beyond Store of Value
Bitcoin is often called “digital gold,” but Ethereum is more than a speculative hedge. It underpins decentralized finance, NFTs, tokenization, and smart contracts—areas with real-world utility that institutions can leverage.
2. Yield Through Staking
Unlike Bitcoin, Ethereum offers staking rewards. Even though ETF structures may not directly pass staking yields to investors, the narrative of a yield-bearing crypto asset appeals to long-term capital allocators.
3. Alignment with Wall Street’s Future
Ethereum’s programmability makes it easier for Wall Street to imagine building products and services on top of it. From tokenized bonds to on-chain settlement systems, Ethereum’s relevance extends beyond speculation.
As a result, institutional flows are tilting toward ETH, reinforcing its narrative as the infrastructure layer of finance.
Will Ethereum Outperform Bitcoin?
The question on every investor’s mind: can Ethereum outperform Bitcoin in this cycle?
Ethereum’s Tailwinds:
• ETF Momentum: With stronger inflows, ETFs could become a steady channel for demand.
• Broader Use Cases: Ethereum is not just money—it’s programmable finance.
• Institutional Adoption: Banks and asset managers are experimenting with Ethereum for tokenization and settlement.
Ethereum’s Risks:
• Sell Pressure: The $5B exit queue could weigh heavily on prices if too much ETH hits the market.
• Competition: Alternative blockchains like Solana and Avalanche are vying for institutional attention with faster throughput.
• Regulation: Ethereum’s staking system could attract more scrutiny than Bitcoin, which is generally classified as a commodity.
Bitcoin’s Defenses:
Bitcoin still has the advantage of being the original, most secure, and most decentralized crypto asset. Its supply cap of 21 million gives it unmatched scarcity. But in terms of growth opportunities and utility, Ethereum may have the edge.
Wall Street’s Tilt Toward Ethereum
Ethereum’s ETF inflows and VanEck CEO Jan van Eck’s recent remarks calling ETH “the Wall Street token” suggest a broader narrative shift. Wall Street is beginning to view Ethereum not just as another cryptocurrency, but as the financial operating system of the future.
• Banks are exploring blockchain-based stablecoin transfers.
• Asset managers are launching tokenization pilots on Ethereum.
• Investors are reallocating from Bitcoin to Ethereum ETFs.
This alignment means Ethereum is no longer just a crypto-native story. It is becoming central to how global finance evolves.
Looking Ahead: Short-Term Pressure, Long-Term Promise
The $5 billion exit queue is a short-term concern. If even a fraction of that ETH is sold, prices could face volatility. But in the bigger picture, withdrawals represent liquidity and flexibility—a sign of a maturing ecosystem.
At the same time, Ethereum’s ETF success and its growing reputation as Wall Street’s blockchain suggest that institutional adoption is only beginning. If these inflows persist, Ethereum could not only outperform Bitcoin but also cement its role as the primary financial infrastructure of the digital age.
Conclusion
Ethereum is at a crossroads. On one hand, the record $5 billion exit queue raises fears of sell pressure and short-term volatility. On the other, Ethereum’s ETF dominance, institutional adoption, and 72% rally signal powerful momentum.
The battle between profit-taking and institutional accumulation will define Ethereum’s near-term price action. But the broader trend is clear: Ethereum is no longer just competing with Bitcoin—it is carving out its identity as the backbone of decentralized and traditional finance alike.
As Wall Street piles into ETH and banks experiment with on-chain settlement, Ethereum’s claim to be the future of finance grows stronger. Whether it outperforms Bitcoin in this cycle remains to be seen, but one thing is certain: Ethereum has secured its place at the center of the crypto narrative.

Ethereum at Risk? Leverage Hits Record High as AI Finance BoomEthereum (ETH), the second-largest cryptocurrency by market capitalization, is navigating a complex and dynamic environment. On one hand, Ethereum continues to emerge as the backbone of AI-powered finance, solidifying its role as the infrastructure layer for the next wave of intelligent decentralized applications. On the other hand, market participants are growing wary, as the Binance leverage ratio for ETH has surged to historic highs, a signal often correlated with heightened volatility and potential downside risk.
Adding to the intrigue, Ether recently broke out against Bitcoin, rallying by nearly 5% on Monday. While this has brought short-term optimism into the market, analysts caution that a true trend reversal will only be confirmed if ETH can flip the critical $4,700 level into long-term support.
This article explores these pivotal developments, the risks and opportunities they present, and why Ethereum remains at the center of both financial innovation and speculative fervor.
________________________________________
1. Binance Leverage Ratio Soars to Record Levels: What It Means for Ethereum
Understanding the Binance Leverage Ratio
The Binance Estimated Leverage Ratio (ELR) is a key metric that tracks the amount of open interest in derivatives relative to the reserves of the underlying asset—in this case, ETH—on the Binance exchange. A rising ELR indicates that traders are increasingly using borrowed funds (leverage) to speculate on price movements.
As of late August 2025, the ELR for Ethereum has skyrocketed to its highest level ever recorded, surpassing previous peaks from 2021 and 2022. This means that a higher percentage of Ethereum trading on Binance is being conducted with leverage, raising the stakes for both bulls and bears.
Risks of Elevated Leverage
High leverage can act as a double-edged sword:
• Volatility Amplification: Leveraged positions can exaggerate price swings. A modest move in ETH price can trigger liquidations, leading to cascading effects.
• Greater Liquidation Risk: With more traders overexposed, sudden price drops can result in mass liquidations, accelerating downward momentum.
• Market Fragility: The market becomes more vulnerable to external shocks—regulatory changes, macroeconomic data, or unexpected news events can have outsized impacts.
Historical Precedents
When the ELR reached similarly elevated levels in May 2021 and November 2022, Ethereum experienced sharp corrections shortly thereafter. These historical patterns suggest that the current surge in leverage could be a warning sign for a potential pullback—especially if ETH fails to hold critical technical levels in the coming days.
________________________________________
2. Ether Breaks Out Against Bitcoin: A Key Technical Signal
While leverage-related risk looms large, Ethereum has shown notable strength against Bitcoin in recent trading sessions. On Monday, Ether rallied nearly 5%, breaking out of a multi-month consolidation pattern against BTC. This has sparked renewed interest in whether ETH is poised to outperform Bitcoin in the near term.
ETH/BTC Breakout: A Bullish Reversal?
The ETH/BTC ratio is often used by traders to assess relative strength. A breakout in this pair suggests that Ethereum is gaining ground in terms of market dominance and investor interest.
Technical analysts point out that the ETH/BTC pair recently broke above a descending trendline that had been in place since early 2024. This move is being interpreted by many as a bullish reversal — a signal that Ethereum might be ready to lead the next leg of the crypto bull market.
The $4,700 Level: A Make-or-Break Resistance
Despite the excitement, the rally’s sustainability hinges on one key resistance level: $4,700. Ethereum previously tested this level in early 2024 but failed to break through decisively. Flipping this level into support is crucial for validating the current uptrend.
• Short-Term Bull Case: If ETH consolidates above $4,700, it could open the door to a retest of the all-time high around $4,870 and potentially push toward the psychologically significant $5,000 mark.
• Bearish Scenario: If ETH fails to hold $4,700 and falls back below, it could trigger another round of liquidations, especially given the high leverage environment.
•
With the Ethereum market teetering on a technical knife-edge, all eyes are now on price action around this critical level.
________________________________________
3. Despite Volatility, Ethereum Is Cementing Its Role as the Backbone of AI-Powered Finance
While short-term risks dominate headlines, Ethereum is quietly laying the foundation for the next generation of decentralized, AI-powered financial systems. The convergence of blockchain and artificial intelligence (AI) is rapidly evolving, and Ethereum is emerging as the preferred platform for this fusion.
Why Ethereum?
Ethereum’s core strengths make it uniquely suited to become the infrastructure layer for AI-integrated finance:
• Smart Contract Flexibility: Ethereum’s programmable contracts allow developers to build complex autonomous systems that interact with external data.
• Network Effects: With the largest developer community in Web3, Ethereum benefits from continual innovation and support.
• Layer-2 Scaling: Rollups and other Layer-2 solutions (e.g., Arbitrum, Optimism) enable Ethereum to handle greater transaction throughput, crucial for AI applications that require real-time data processing.
•
Key Use Cases for AI on Ethereum
1. Autonomous Financial Agents
Smart contracts can be paired with AI agents to create self-governing financial bots that execute trades, manage portfolios, or optimize yield strategies in DeFi protocols. These agents can adapt to market conditions faster than human traders, offering a competitive edge.
2. Decentralized AI Marketplaces
Ethereum-based platforms like Ocean Protocol and SingularityNET allow users to buy, sell, or license AI models and data sets. These marketplaces are democratizing access to AI, enabling developers and researchers to monetize their work without intermediaries.
3. On-Chain AI Inference
Projects are now exploring how to run AI inference—the process of making predictions from trained models—directly on-chain or via decentralized compute networks. This allows for truly censorship-resistant and transparent AI decision-making in areas like lending risk assessment and insurance underwriting.
4. AI-Powered Oracles
Oracles such as Chainlink are integrating AI to enhance the reliability and relevance of off-chain data delivered to smart contracts. This enables more accurate, real-time inputs into DeFi protocols, insurance contracts, and prediction markets.
________________________________________
4. Institutional Interest & Regulatory Clarity Fuel Ethereum’s Growth
Beyond technological innovation, Ethereum is also benefiting from increased institutional interest and a clearer regulatory environment in key markets.
Spot ETH ETFs Drive Demand
The approval of spot Ethereum ETFs in several jurisdictions — including the U.S., Europe, and Asia — has contributed to a surge in institutional demand. These financial products allow traditional investors to gain exposure to ETH without dealing with wallets or private keys.
In the months following ETF approvals, Ethereum saw:
• A sharp increase in institutional inflows.
• Greater liquidity and reduced volatility.
• Renewed bullish sentiment among long-term holders.
Regulatory Clarity Emerges
Regulatory bodies have begun to differentiate Ethereum from other crypto assets, often classifying it as a commodity rather than a security. This distinction has major implications for how ETH is treated under financial regulations, and further cements its status as a legitimate and investable asset.
________________________________________
5. What Comes Next: Scenarios to Watch
Bullish Scenario
If Ethereum can maintain momentum and flip $4,700 into support in the coming days, the path to new all-time highs becomes much clearer.
• Key Price Levels: After $4,700, the next resistance is at the 2021 all-time high of $4,870. Beyond that, price discovery could push ETH toward $5,200–$5,500.
• Narrative Boost: A growing narrative around AI + DeFi convergence could bring a fresh wave of speculative interest and developer activity to the Ethereum ecosystem.
Bearish Scenario
However, if ETH fails to hold $4,700 and the high leverage ratio on Binance triggers a liquidation cascade, a retracement to $4,300 or even $4,000 is possible in the short term.
• Market Sentiment: Leverage unwinding could lead to panic selling, particularly among retail traders.
• Macro Risk: Any unfavorable macro developments (e.g., interest rate hikes, geopolitical tensions) could exacerbate the downtrend.
________________________________________
Conclusion: Ethereum at a Crossroads
Ethereum stands at a crossroads — balancing short-term price volatility against immense long-term potential. The record-high leverage ratio on Binance is a flashing warning sign for traders, suggesting the possibility of a pullback in the face of overheated speculative behavior.
Yet beneath the surface, Ethereum is evolving into the foundational layer of AI-powered, decentralized finance. As smart contracts become smarter and more autonomous, Ethereum’s role as the infrastructure for intelligent financial systems is becoming increasingly clear.
The recent 5% rally and breakout against Bitcoin signal optimism, but all eyes are now on $4,700. If this critical level becomes support, Ethereum could be poised for a breakout that finally fulfills its promise — not just as a digital asset, but as the backbone of an entirely new financial era.
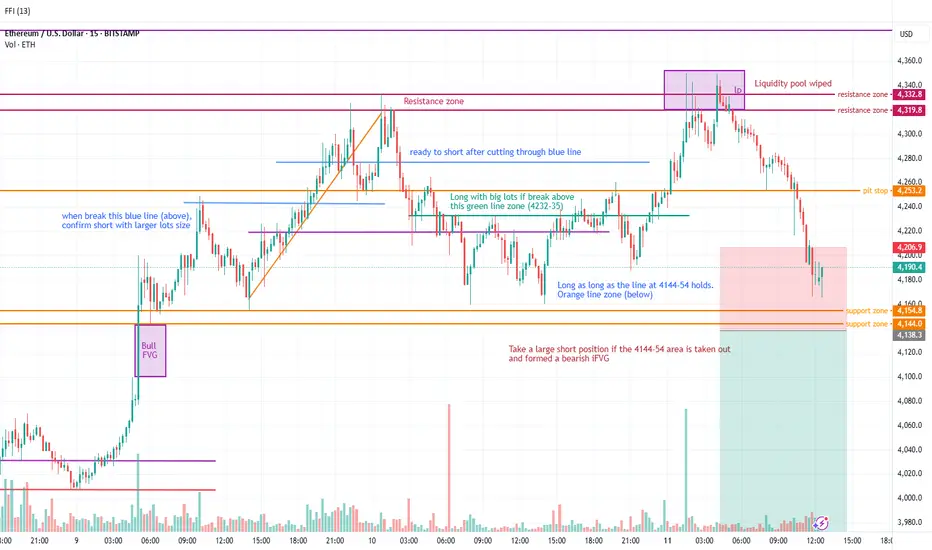
Day trading Ethereum (for both Long and Short)My analysis is based on the price action movement using liquidity pool to identify turnaround or fake manipulation move. Use FVG and iFVG to identify clear confirmation for trend movement. Price action allows me to shed light on the psychology and manipulated movement driven by market maker.
Ethereum - The moment of truth!🔬Ethereum ( CRYPTO:ETHUSD ) trades at a key breakout level:
🔎Analysis summary:
Ethereum - after consolidating for the past four years - is once again retesting the previous all time high. And before we will witness another bearish rejection, Ethereum has the chance to finally break out of the long term triangle pattern. It's time for us to start praying.
📝Levels to watch:
$4.000
SwingTraderPhil
SwingTrading.Simplified. | Investing.Simplified. | #LONGTERMVISION
