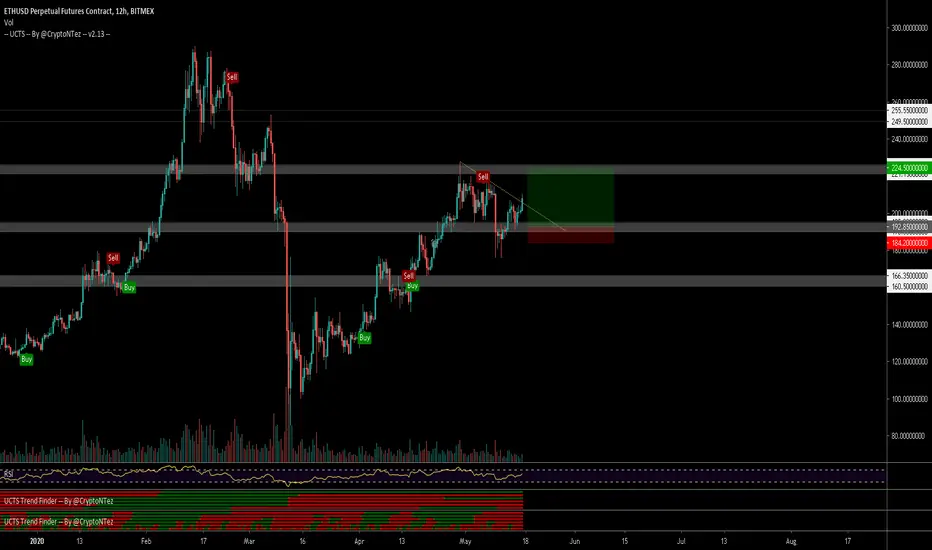
$ETH, Trying to break above descending trendline.. $ETH / #USD
Following our set up from May 14.
Trying to break above descending trendline on its way toward ~220$ resistance level (LL into HH into HL into HH 👌)
UCTS Buy signals on 8H & lower TFs
#ETH
Ethereumusd

ETHUSD Technical and Fundamental AnalysisBefore I start, I would like to welcome y'all to support by liking and following my page if you like what you see here : )
So far I have really enjoyed the experience here with the wonderful trading community, it is great to see the unbounded sharing of ideas by our fellow traders, so I thought of giving back as well.
Here are my two cents on ETHUSD:
H1 Timeframe shows a pretty obvious descending wedge, a (1) bullish flag with (2) Twice the formation of a bearish double top within the wedge, multiple times where it has touched the descending resistance line
Both times the formation of the double top has lead to a sell off to touch a major support level @ 198, thereby VALIDATING 198 AS A STRONG SUPPORT.
Technical indicators (1) MACD shows a greenish potential crossover to the positive side (2) Stoachastics show a 62 point, near the 80 buy zone
Short Term Opportunities to watch for:
- BREAKING OUT OF 209 would mean a retest of the nearest resistance level @ 212 and beyond that, targets for a BUY opportunity at TP1 @ 219 AND TP2 @ 226
- A SHARP REJECTION from the 208 descending resistance line would mean a SHORT opportunity to strong support line @ 198, breaking below this would bring us to the next 2 support lines @ 193 and @ 189
Long Term Fundamental Analysis:
Honestly I doubt ETHUSD could drop below 193 support which has been consistently validated from 25-29 April 2020. The long term outlook is currently BULLISH, with ETH 2.0 due for release in JULY 2020, which transits the current Proof of Work ethereum to a Proof-of-Stake Mechanism. This is very important to note, as instead of competing against each other to solve puzzles, users who accrue the most wealth, or stake, will be in charge of validating transactions in 2.0.
This definitely leads to a supply shock as users accrue ETH, possibly leading to a lock up of 30% of circulating ETH --> BUYING PRESSURE
Next, given a recent uptick in the number of addresses holding 32 ETH — the precise amount required for validators to stake in ETH 2.0 — demand, it seems, is already mounting. According to market intelligence firm Glassnode, there are currently over 116,351 Ethereum addresses containing 32 ETH or more — a figure up over 14% from last year.
My prediction: Price spike of ETHUSD is already partially priced in, with quite a number accumulating ETH for the staking in 2.0 release. The current ETH price flunctuations are likely short term position holders looking for quick buy and sell opportunities, with the majority holding for long. Once reaching the BTC sell-off post halving, some of the BTC holders may partially close LONG positions on BTC, taking profits, then putting more weight into ETH as the attention shifts to Ethereum 2.0 update. (Personally, I would only account maybe 30% ETH 70% BTC of my positions as I don't see ETH outperforming BTC in the long term, at least not by end 2020.)
Thank you for reading my two cents, feel free to comment your thoughts and feedback below!
Regards,
GolDRoger, a humble beginner trader

Don't miss the great buy opportunity in ETHUSDTrading suggestion:
. There is a possibility of temporary retracement to suggested support line (202.17). if so, traders can set orders based on Price Action and expect to reach short-term targets.
Technical analysis:
. ETHUSD is in a range bound and the beginning of uptrend is expected.
.The price is above the 21-Day WEMA which acts as a dynamic support.
. The RSI is at 50.
Take Profits:
TP1= @ 224.50
TP2= @ 245.00
TP3= @ 286.80
SL= Break below S2

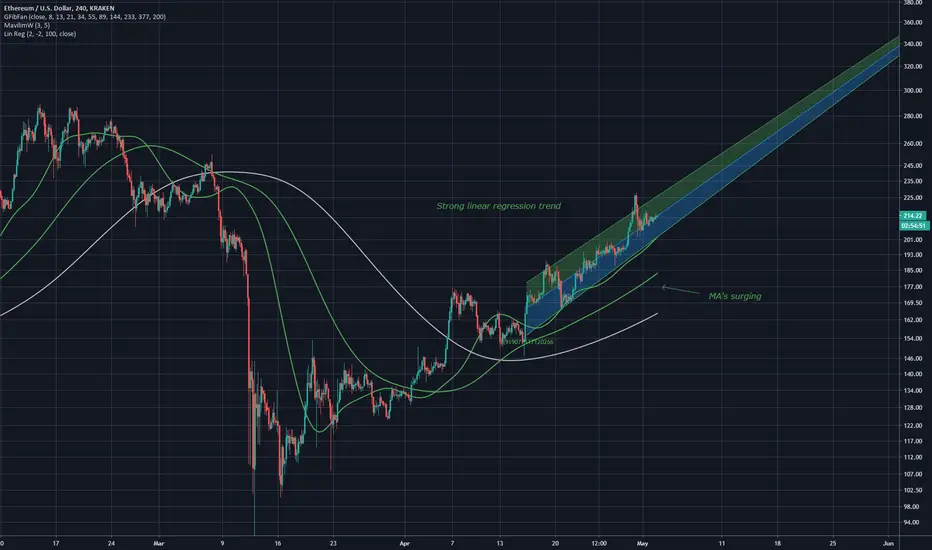
Vitaliks Monster. (ETH)Bounce up testing the Resistance after bouncing off support.
Stay sharp.
Ethereum..


Is Ethereum Going To Hit $10K Within Next Year???Descending triangle:
In my previous article we have already discussed that the price line of Ethereum is moivng in descending triangle. The support of this triangle is at $90. The priceline entered in this triangle in December 2018 and after hitting the support turned strong bullish and rallied more than 355%. And after June 2019 the Ethereum dropped down again. But this time the priceline did not hit at the support of this triangle. Because the the lower bands of the bollinger bands was above the support of the triangle therefore it played the role as a strong hurdle for the price action and stopped the priceline to reach the support of triangle. And this time in March 2020 we can again see that bollinger bands was moving with the support of the triangle therefore the price line had the capacity to reach up to the support and on the candlestick of 9th March 2020 we have seen that the priceline has reached the support at $90 and now is has turned strong bullish. Sofar the price line has rallied more than 152%
Here I have also placed the volume profile on the complete price action moving within this triangle and as result we can see that the trader’s interest is very low below $107 Its mean that the traders are less interested in trading close to the support of the triangle therefore we can when the priceline moved below this level it turned bullish and moving up.
Ethereum is bounced from the support that is not broken down since more than a year:
If we switch to the daily chart that we can observe that after that after strong bearish move of the month of March finally the price action has hit the support of $122. This is very strong support that is not broken down since more than a year therefore the priceline is not able to break down this support. From this support level the Ethereum took a powerful divergence and broke out the first resistance level at $149. And after breaking out this resistance level the priceline has re-tested this resistance as a support and moved up. At this time we can see that the price action is attempting to breakout the next resistance level of $224. If this resistance will be broken out then the priceline may re-test this resistance level as a support then it will move up to make an attempt to break out the next resistance level of $310.
Big bullish Gartley has started its job:
Here I would like to recall the big bullish Gartley pattern that we have discussed in previous article, that the Ethereum has form very big bullish Gartley pattern on the monthly chart same as like the Bitcoin has formed. The strong bearish move of the month of March has helped the price action of Ethereum to complete the final leg of the bullish Gartley pattern. Even the priceline has hit the spike beyond the potential reversal zone but on the same candlestick the priceline retraced back and re-entered in the potential reversal zone again. The buying zone of this pattern starts from $188 and ends up to $141 and as per Fibonacci sequence of harmonic Gartley pattern the price line should move up in the Fibonacci projection of A to D leg that starts from $245 and ends up to $315. The maximum extent of this sell zone or Fibonacci projection area $315 is almost at the same level where we have third resistance level. And that is on $310. Therefore this time there are strong chances that the priceline will hit $315 level to breakout this resistance.
This bullish indication is going to appear second time in the history of Ethereum:
Now I would like to discuss with you the most strongest indication that can lead the priceline of Ethereum to hit the $10,000. And that is the ichimoku cloud on the weekly chart if we see back in 2016 when the price action crossed up the ichimoku cloud then it Ethereum produced more than 12933% bullish rally. And after hitting the highest price the Ethereum turned bearish and on June 2018 the priceline crossed down the cloud. Since then Ethereum is not able to cross up this cloud again. And at this time we can see that the price action of a Ethereum is making third attempt to cross up this ichimoku cloud. Once the priceline will be able to cross up this cloud then this ichimokum bearish cloud will be turned bullish and it will become most strongest support for the price action of Ethereum. That can lead the priceline to hit higher than the previous highest price. Therefore there can be a possibility that it will hit $10,000 within next 2 years. The lagging span has already crossed up the candle sticks that is another bullish indication this will be helpful for price action to cross the candles.
Conclusion:
There are strong chances that the Ethereum will make an attempt to breakout $310 resistance. Incase of breaking out $310 resistance level the Ethereum can easily cross up the ichimoku cloud after that the price line can turn bullish and incline on long term.

Ethereum Spiral ResistanceSpiral resistance
Could be smashed through im long so i want that to happen but it is an important level.
Wedges can also be seen. The rising wedge can be seen to be breaking down, this may be the result of another falling wedge present.

ETH POSSIBLE FAKEOUT ! SHORT ITETH and BTC are pushing up and didn't make any correction in this up trend
This kind of uptrend ends with wilds movements
I expect a last push up to take all the stop loss + the liquidity above $200 and then a big drop

The Dominace Of Ethereum. (ETH)Nice wedge pattern developed.
We are testing the top of range.
Monthly is showing a potential turn for a big push up.
Bitcoin dominance continues to drop as ethereum dominance seems to show different signs.
We are getting some nice price movement on the weekly and 2 week on bitcoin but we are not out of the gate yet.
Monthly turns are the signs we want when looking for a long term entry.
Good luck.

ETH- 27 April 2020 - End of Bear Targetsall the elliott waves are drawn on the chart. Still expecting lower lows.

The Ethereum is ramping up volume for an uptrend ti reacg 214.61The ETHUSD next profit target at 214.61 and TP2 at 249.24 USD. Stop loss at 167.53.

$ETH, Sitting above support at around ~184$ (Bullish...$ETH / #USD
Sitting above support at around ~184$ (Bullish unless losses it)
Watching 2 different formations here as UCTS signals Buys across almost every LTF & daily
Ichi cloud almost crossed to the upside on the daily..
Willing to get green path but ready for yellow.
#ETH

Ethereum Rising WedgeRising Wedge formation
Bearish move expected as per chart pattern
However price is currently hovering over .382 so trade wisely
Chart for possible future bottoms (long term), ultra bullish of course

ETHUSD 182.10 -3.07% LONG IDEA Good Day Traders....
HERE'S A LONG IDEA OF ETHUSD
ETH PRICE IS SHOWING A LOT OF (+) SIGNS WITH A NEW HIGH NEAR $190 AND WE ARE CORRECTING LOWER OR RATHER RETRACING
LOOKING FOR A BOUNCE BACK ABOVE $178 & $175 SUPPORT LEVELS
THERE A RE STILL A LOT OF SIGNS OF CONTINUATION TO THE UPSIDE SO IF WE SEE A RISE TO ABOVE $190 WE'LL BE IN A STRONG UPWARD TREND WHICH WE'LL THEN TARGET $200 & $266
PERIOD - SWING TRADE
LOOKING FOR GOOD ENTRIES WITH THE BULLS
* IF YOU LIKE THIS IDEA KINDLY LEAVE A LIKE AND COMMENT... KINDLY FOLLOW AS WELL FOR MORE SWING AND DAY TRADE IDEAS, APPRECIATE IT.

Ethereum: Ascending Channel Analysis 1D (Apr. 21)X FORCE GLOBAL ANALYSIS:
Ethereum has been showing a slow and steady uptrend, creating higher lows and higher highs on the daily. In this analysis, we look at Ethereum (ETH)'s technicals to determine the bullish and bearish probabilities.
Bullish Evidence
- Prices have been creating a steady higher lows and higher highs on the daily
- The ascending bullish parallel channel remains intact
- We have broken through the 0.236 Fibonacci resistance, and the 0.382 Fib resistance
- The Relative Strength Index (RSI) also shows an ascending trend, with higher lows and higher highs, demonstrating trend strength
- The Moving Average Convergence Divergence (MACD) shows increasing bullish histograms as a sign of momentum to back bullish movement
Bearish Evidence
- However, We have been rejected by the 0.5 Fibonacci resistance
- While the bullish candles appear slow and steady, we have previously seen a huge bearish engulfing candle, demonstrating that bears are in control
- Because we are trading in an ascending channel after a drop, this could be a setup for a bearish flag
What We Believe
We believe that Ethereum is likely to continue its bullish uptrend, given that prices remain within the ascending channel. A break and close below the channel support could confirm the start of a new downtrend.
Trade Safe.


Something coolETHBTC
Price can be seen to be climbing nicely around the Fibonacci spiral
With a golden cross present
and no resistance in sight
this is very bullish
heres my previous analysis on ETHBTC forecasting a price

ETH Rising WedgePrice has broken out into a rising wedge, one of the gann band resistances has been broken in doing this. This new rising wedge can act as support for price, as can the fibonacci spiral.


Fib waves?Bullish and bearish fib waves
it can be seen that .236 is a bearish fib wave for ETHBTC pair
While 1.618 can be seen to overall be a bullish Fibonacci wave
These Fibonacci waves are movements within a Fibonacci circle
Very bullish pair

ETHEREUM : FELL IN LOVE💘💘💘Hey, guys!❤ I want to tell you a few words!😚
I'm glad of your feedback.💙 Your comments, private messages make me very happy. 😇 They charge me with energy, I, like a battery recharging and ready to work again and again !!!🔋🔋🔋 Thanks a lot!😚
Thats my last analysis for today!🤗 Let's consider ethereum.👁🗨
Take a look, it's a pleasure.😌
👀Look at the figure, that I marked on the chart👀 Yes, yes, this is Adam and Eve ... such mercy))))💘💘
Now the price is rising, so let it be )))🤗
😍😘Guys, thank you for your suppor !!! I love you!🥰
Everyone, who has recently folloed me - welcome 🌞!!! I'm very glad to see you!😘
✔Stay with me!✔
Your Rocket Bomb🚀💣
