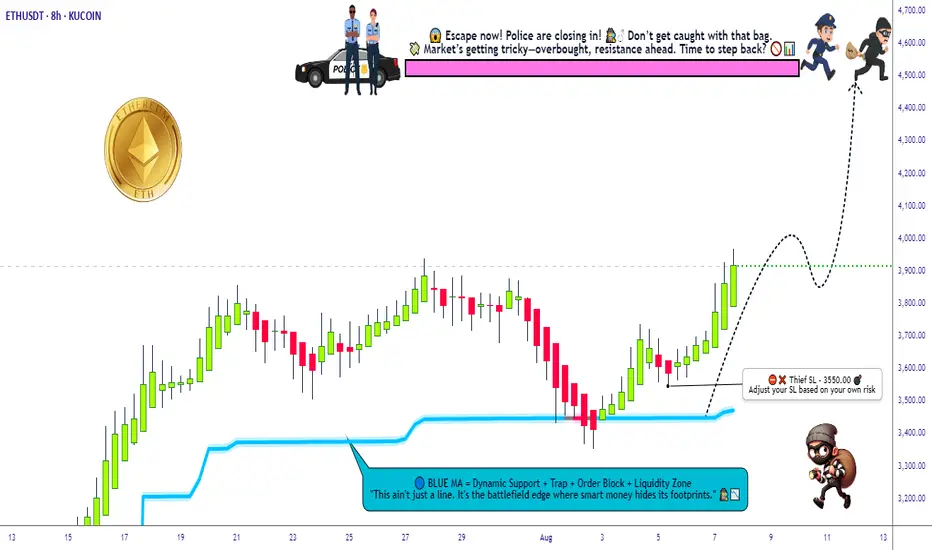
ETHUSD Momentum Building! MA Breakout Keeps Bulls in Control📘 **ETHUSD “Ethereum vs U.S. Dollar”
Crypto Market Opportunity Blueprint (DAY Trade)**
🚀 Plan Overview
A bullish continuation scenario is active following a clear Moving Average breakout and clean retest. This structure builds a favorable environment for controlled entries backed by momentum confirmation.
🎯 Entry
👉 You can enter at any price level once your personal confirmation aligns with the ongoing MA structure.
The breakout + retest provides the core framework.
🛡️ Stop Loss Strategy
📍 This is the Thief SL @ 3050 Dear Ladies & Gentleman (Thief OG’s)
Adjust your Stop Loss based on your own strategy, risk tolerance, and trade model.
⚠️ Place the SL only after the MA breakout confirmation, not before.
📝 Note:
Dear Ladies & Gentleman (Thief OG's) I am not recommending that you use only my SL. It’s your own choice; you can make money then take money at your own risk.
🎯 Target
The SuperTrend ATR line is acting as a strong resistance, and current conditions suggest:
📈 Overbought signals building
Trap zones developing
📌 Smart exit required
👉 Our target: 3600
📝 Note:
Dear Ladies & Gentleman (Thief OG’s) I am not recommending that you set only my TP. It’s your own choice; you can make money then take money at your own risk.
🔍 Related Pairs to Watch (Correlation & Key Notes)
1. BITSTAMP:BTCUSD (Bitcoin vs USD)
ETHBTC correlation remains high during MA-driven moves.
BTC’s trend strength often dictates crypto-wide volatility.
Strong BTC breakout boosts ETH’s bullish follow-through potential.
2. BINANCE:ETHBTC (Ethereum vs Bitcoin)
Great pair to measure Ethereum’s relative strength.
Rising ETHBTC = ETH outperforming BTC → supports the bullish ETHUSD narrative.
Useful for detecting early reversals before USD-pairs show it.
3. CRYPTOCAP:TOTAL2 (Altcoin Market Cap)
Represents overall altcoin strength excluding BTC.
If TOTAL2 breaks resistance with volume, ETH usually moves aggressively.
Helps confirm whether the market supports a broad-based ETH rally.
4. COINBASE:SOLUSD (Solana vs USD)
Competes for capital rotation with ETH.
When SOL pumps aggressively, ETH sometimes lags before catching momentum.
Watching SOL gives early hints of altcoin capital flow.
5. TVC:DXY (US Dollar Index)
Inverse correlation with major crypto assets.
Weak DXY = supportive environment for ETHUSD upside.
Strong DXY = caution for crypto longs.
Ethereumusdt

Ethereum 1st Spot Buy Target has been reachedMarkets like to reverse at low volume nodes or fair value gaps, so as you can see, we have reached one of the lowest volume areas of this year so this can act as my personal buy target for Ethereum.
2nd and 3rd are noted as well.
Wish you all the best trading.


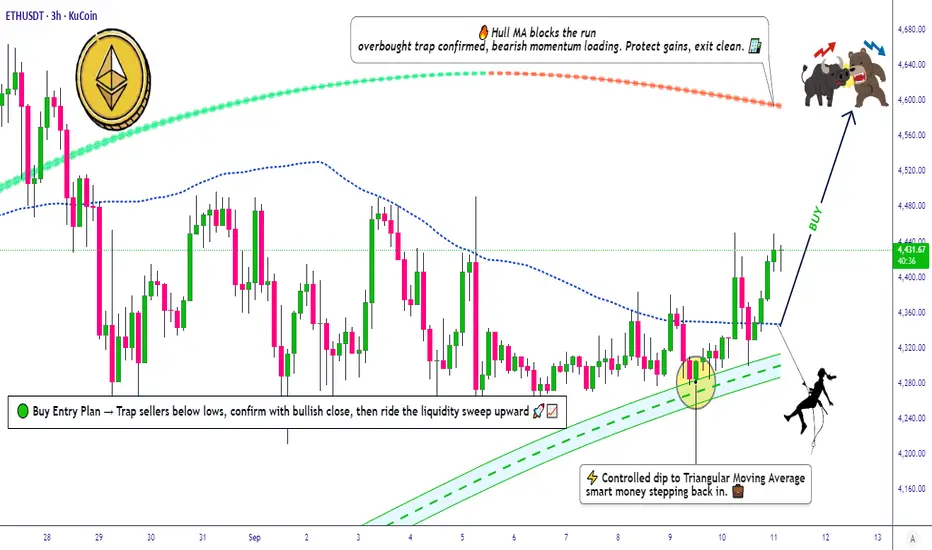
ETH/USDT Technical Roadmap | Bullish Swing & Day Trade Levels📌 ETH/USDT "Ethereum vs Tether" Crypto Market Plan (Swing/Day Trade)
🔹 Plan: Bullish (Pending Order Breakout Plan)
We are preparing for a breakout setup around 10.000⚡ TRIANGULAR MOVING AVERAGE BUY PLAN.
Price action shows strong buyer strength with signs of institutional accumulation on dips.
🛠️ Thief Strategy (Layered Entry Style)
This strategy uses multiple limit orders (layering method) after breakout confirmation.
✅ Example buy limit layers (can be adjusted to your own risk):
4350
4370
4390
4420
👉 Please set a TradingView alert near the breakout level so you don’t miss confirmation.
🛑 Stop Loss (Risk Management)
📍 Suggested risk level: 4300 (after breakout confirmation)
This is the Thief SL reference point, but remember:
Adjust your SL based on your personal risk tolerance & strategy.
🎯 Target (Profit Zone)
Price may face resistance near moving averages with possible overbought traps.
📍 Planned exit zone: 4600
Manage your own TP — use targets that fit your risk/reward ratio.
🔗 Related Pairs to Watch
BINANCE:BTCUSDT – Bitcoin breakout strength often leads ETH moves.
BINANCE:ETHBTC – Key ratio showing ETH’s relative strength vs BTC.
BINANCE:SOLUSDT – High-beta crypto that often correlates with ETH sentiment.
BINANCE:BNBUSDT – Another major altcoin for cross-market momentum comparison.
✨ “If you find value in my analysis, a 👍 and 🚀 boost is much appreciated — it helps me share more setups with the community!”
#ETH #ETHUSDT #Ethereum #Crypto #SwingTrade #DayTrade #BreakoutStrategy #LayeredEntries #CryptoTrading #TradingPlan
ETH/USDT Bullish Breakout Heist Plan – Are You Ready to Strike?🔥💎 ETH/USDT Crypto Heist Plan: Swing Trade Edition 💎🔥
Dear Thief OG’s & Market Robbers 🕵️♂️,
The vault is loaded, and Ethereum vs. Tether (ETH/USDT) is about to get cracked wide open. We’ve spotted the weak spot in the system — and this time, it’s a bullish breakout heist. 📈💰
📊 Heist Blueprint: The Setup
Asset: ETH/USDT (Crypto) 🌐
Style: Swing Trade ⏰
Plan: Bullish Breakout & Layered Entries ⚡
🚪 Entry Points (Breaking Into the Vault)
Breakout Entry: Break above 4800.00 — that’s our signal to strike 🚀
Layered Buy Orders (Thief Style): Stack your loot with multiple limit layers:
4700.00
4600.00
4500.00
(You can add more layers depending on your loot bag 💼)
🔔 Pro Tip: Set TradingView alarms at 4800.00 so you don’t miss the breakout moment.
🛑 Stop Loss (Cover Your Tracks)
Thief SL placed at 4200.00 once breakout confirms ⚠️
Adjust your stop loss based on your own risk style & strategy — every thief has their own getaway plan. 🏃♂️💨
🎯 Target (Escape Point)
Police barricade seen at 5300.00 🚔
Safer escape: 5200.00 — grab the loot and vanish before the cops arrive. 💸
📡 Why This Heist Works
Breakout momentum above 4800 shows ETH is ready to run.
Layering strategy = smarter accumulation while minimizing risk.
Targeting clean levels where liquidity + resistance hide.
⚠️ Risk Warning: Every heist has danger — manage size, use layers, and don’t overexpose. Protect your loot like a true Thief OG. 🏴☠️
💥 Support the Crew! 💥
Drop a like 👍, share a comment 💬, and follow 🚀 for more Thief Trader Heist Plans. The more noise we make, the stronger our gang becomes! 🕵️♂️💰

Ethereum Not Dead- i know some peoples think ETH will go to 250$ or 500$, so wait for it...
- I've always maintained that I'm not a fan of ETH because of its scalability limitations and centralization, for that reason ETH needs some messy L1...L2...etc..
- That said, my opinion doesn’t matter much, ETH is here to stay. The Ethereum ecosystem hosts thousands of projects; I’d say it’s too big to fail.
- i used Bitstamp exchange to look further back in the chart's history.
- i simplified this monthly chart so much that even a 10 year old kid could understand it, just check the RSI low levels and compare it with previous years. Again, check the max RSI level for the previous ATHs.
- i won't discuss where to buy because, whether you get ETH at $1,800 or $1,500, the bull run for ETH and Altcoins hasn't started yet.
Happy Tr4Ding !

ETH/USDT Grid Plan » Bullish Loadout » Stealing the Top🚨ETH/USDT Crypto Heist Plan 🔓💰
Asset: ETH/USDT "Ethereum vs Tether"
Plan: 🟢 Bullish – Multi-Layered Entry Grid
Strategy: Thief-style limit orders (GRID / DCA stacking)
Entry: Any Dip is a Heist Opportunity 💸
Stop Loss: 🔻 3550.00
Target: 🎯 4500.00
👋 Hey Thieves & Money Makers!
Get your gear ready – it's time to loot the Ethereum Vault 💎🚀
🔥Thief Trader's ETH/USDT Master Robbery Blueprint🔥
This ain’t your average plan — we break in with layered entries, lock in on breakout volatility, and ride the bullish train to the moon 🌕.
💼 Entry Strategy:
No need to overthink. Any dip = loot zone!
Stack multiple limit orders like a pro (15M–1H level).
We're playing the grid game. The more dips, the bigger the stash! 🧱🪙
🚨 Stop Loss:
Set SL at 🔻3550 or under recent swing lows.
Adjust by risk appetite and how many entries you stack.
Thieves don’t chase – they calculate risk.
🎯 Target Zone:
We're eyeing the 4500 mark. But remember – exit before the vault shuts if momentum slows. 🏃♂️💨💰
🔁 Scalpers Alert:
Only long. Only bullish. Only profit. 🧲💥
Stack it, trail it, and let it run with a sniper's precision. 🎯🧠
📊 Market Context:
ETH bulls gaining control post-accumulation.
Strong on-chain metrics, solid macro tailwinds.
Bears trapped in the shadows – we move in daylight. 🐂🆚🐻
📰 Warning – News Bombs Ahead!
💣 Avoid fresh positions during high-impact events.
🎯 Use Trailing SLs to protect your loot.
Smart robbers never get caught unguarded.
💥BOOST This Idea if you're part of the robbery crew 🔐💰
Every boost powers our next move.
Let's rob the crypto market together – one breakout at a time! 🏴☠️📈🤑
Thief Trader™ – Locking Targets. Looting Charts.
💎🕵️♂️📊 #CryptoHeist #ThiefStyle #ETHBreakout #GridGang #BullMode
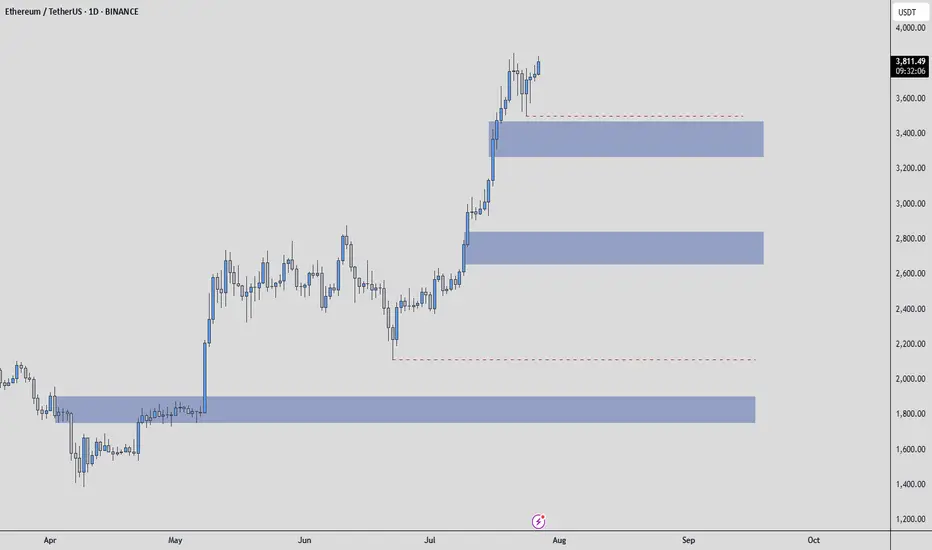
Ethereum - Possible Zones / How to use them ? Hello everyone, and special greetings to my dear friends who follow me, I hope you're happy that I helped you buy Ethereum at $2200.
Let's get to today's situation. There are many areas for Ethereum. The first blue box is the one I'd want to be the first buyer in.
I might want to be a buyer in the other blue boxes as well, but there will be increases even before these areas are reached.
I think the bottom blue box could be the one in the event of a Q3 correction.
What is a Q3 correction? All risk-on markets typically experience significant corrections in the third quarter of the year and struggle to recover from this correction until the end of the year.
The first blue box would be the first area I'd want to be in for any increases leading up to this correction.
HOW DO I GET INVOLVED!! THIS IS IMPORTANT BECAUSE SOME OF YOU LOSE MONEY WHEN BLUE BOXES ARE PULLED AWAY. THIS SHOULD NOT HAPPEN!!
When the price reaches the blue box, the transition is made to the 1-hour timeframe. Here, an upward breakout is sought, and during this breakout, the CDV is expected to be positive and rising. If these conditions are met, then RISK is taken. However, the entire amount of money isn't spent; it simply means that the conditions necessary to spend one bullet are met. One bullet is an amount that won't upset you too much; this varies for everyone.
I hope you use this analysis beneficially and profitably, because I want you to make a lot of money. Best wishes to you all, UmutTrades.
ETHUSDT – Eyes on the Green Line!ETHUSDT – Eyes on the Green Line!
“Momentum is building, and all signs point to the next key level—the green line is in play!”
🔥 Key Insights:
✅ Trend Remains Strong – No reason to fade the move.
✅ Green Line = Next Target – That’s where liquidity & reactions will matter.
✅ Pullbacks = Buying Opportunities – No FOMO, we wait for strategic entries.
💡 The Smart Plan:
Look for Dips to Load Up – Volume & CDV should confirm strength.
LTF Breakouts = Strong Entry Signals – Follow structure, not emotions.
Green Line = First Major Resistance – Expect reactions, manage risk accordingly.
“If momentum holds, Ethereum is headed straight for the green line—watch closely!” 🚀🔥
A tiny part of my runners;
💼 STMXUSDT: 2 Buying Areas
🐢 TURBOUSDT: Buy Zones and Buyer Presence
🌍 ICPUSDT.P: Massive Upside Potential | Check the Trade Update For Seeing Results
🟠 IDEXUSDT: Spot Buy Area | %26 Profit if You Trade with MSB
📌 USUALUSDT: Buyers Are Active + %70 Profit in Total
🌟 FORTHUSDT: Sniper Entry +%26 Reaction
🐳 QKCUSDT: Sniper Entry +%57 Reaction

ETH BullThis looks like the perfect moments for sideliners to go in. Also the ones that have sold the previous local top to reenter.

Ethereum ethEthereum is a decentralized open-source blockchain system that features its own cryptocurrency, Ether. ETH works as a platform for numerous other cryptocurrencies, as well as for the execution of decentralized smart contracts.
pls check previous eth posts

ETH (Ethereum): Approaching SupportTrade setup : Price broke below its 200-day moving average, which signaled downtrend. It bounced off $2,100 support and reached $2,800 resistance where it got rejected. Momentum is fading (MACD Histogram declining ). We would be buyers if price dips to $2,100 support again. The recent launch of nine ETH Spot ETFs could also boost demand for ETH. Learn to trade chart patterns in Lesson 8 and set Stop Loss levels in Lesson 9.
Pattern : Price is Approaching Support, which is a level where it could pause or reverse its recent decline, at least temporarily. Support is often a level where price has bounced up in the past, or potentially prior Resistance level that was broken. (concept known as polarity). Once price breaks below support, it can move lower to the next support level. Learn to trade key levels in Lesson 7.
Trend : Short-term trend is Strong Down, Medium-term trend is Strong Down and Long-term trend is Strong Down.
Momentum is Bullish but inflecting. MACD Line is still above MACD Signal Line but momentum may have peaked since MACD Histogram bars are declining, which suggests that momentum could be nearing a downswing. Price is neither overbought nor oversold currently, based on RSI-14 levels (RSI > 30 and RSI < 70).
Support and Resistance : Nearest Support Zone is $2,400.00, then $2,100.00. Nearest Resistance Zone is $2,620.00, then $2,850.00.

ETH (Ethereum): Approaching ResistanceTrade setup : Price broke below its 200-day moving average, which signaled downtrend. However, it got oversold (RSI < 30) near $2,400 support and bounced up. Also notice the unusually high volume, which also suggests that a lot of sellers have already exited. Momentum is inflecting bullish again (MACD Histogram rising) and price could reach $2,850 resistance. This is a riskier trade setup because it’s a trend reversal not a trend continuation setup. It’s against the overall downtrend. The recent launch of nine ETH Spot ETFs could also boost demand for ETH. Learn to trade chart patterns in Lesson 8 and set Stop Loss levels in Lesson 9.
Pattern : Price is Approaching Resistance , which is a level where it could pause or reverse its recent advance, at least temporarily. Resistance is often a level where price got rejected in the past, or potentially prior Support level that was broken. (concept known as polarity). Once price breaks above resistance, it can advance higher to the next resistance level. Learn to trade key levels in Lesson 7.
Trend : Short-term trend is Strong Down, Medium-term trend is Strong Down and Long-term trend is Strong Down.
Momentum : Price is neither overbought nor oversold currently, based on RSI-14 levels (RSI > 30 and RSI < 70).
Support and Resistance : Nearest Support Zone is $2,400.00, then $2,100.00. Nearest Resistance Zone is $2,620.00, then $2,850.00.

Brief ETH Analysis | Bearish Trend? Key S & R Levels 1D TFThe 1D TF chart for Ethereum shows a consolidation period following a significant uptrend. Key events include the publication of the U.S. Consumer Price Index (CPI) on May 12 and circulating news about the upcoming approval of the Ethereum spot ETF, which caused heightened market activity. On May 20, Ethereum's price surged by 21% in a single day, a significant movement compared to the typical 9 - 11% increases. This sharp rise was driven by speculative news and positive sentiment surrounding the potential ETF approval and favorable CPI data.
After this spike, the price entered a range, characterized by increased trading volumes but low volatility candles, indicating market indecision. Recently, an "Inside Bar" pattern has formed: the middle candlestick is a small bearish candle enclosed within the previous large bullish candle, with a potential bullish candle forming today. This pattern highlights market indecision and suggests a potential breakout in either direction.
Currently, Ethereum is testing a critical resistance level around $4K. A breakout above this level, accompanied by increased volume, could signal further upward movement. Conversely, failure to break this level might lead to a pullback towards the support zones.
The current chart analysis shows that ETH is approaching a significant resistance level around $4K, marked by a descending trend line. This resistance has been tested several times, underscoring its importance.
The volume profile indicates consolidation between key support and resistance levels:
◼️ Resistance Levels: Around $3.9K and $4.1K.
◼️ Local Support Levels: Around $3.7K and $3.5K.
◼️ Bullish Scenario: A breakout above $3.9K, accompanied by increasing trading volumes, could signal the continuation of the bullish trend towards the next resistance level around $4.1K.
◼️ Bearish Scenario: If the price fails to break through the resistance and falls below the $3.5K support level, it could indicate a potential bearish reversal or an extended consolidation phase.
Monitoring trading volumes and price movements around these key levels will be critical in predicting the next significant move.
Disclaimer: Content for seasoned traders only. Not financial advice. You bear sole responsibility for trading outcomes. ➖ DYOR 🧠 💡

ETH: Approaching SupportTrade setup : Price is in an Uptrend. Following a bullish breakout from a Descending Triangle pattern, price spiked up 25% and reached our near-term target of $4K. However, it got overbought (RSI ~ 70) and is pulling back on some profit taking.
Now we look for the right entry opportunity in Uptrend. We wait for price to either 1) break above $4K to signal continuation of uptrend, with +17% upside potential to its ATH of $4,700, or 2) pull back near $3,200 support for another swing trade entry in Uptrend with upside potential back to $4K. Learn to trade chart patterns in Lesson 8 and set Stop Loss levels in Lesson 9.
Pattern : Price is Approaching Support , which is a level where it could pause or reverse its recent decline, at least temporarily. Support is often a level where price has bounced up in the past, or potentially prior Resistance level that was broken. (concept known as polarity). Once price breaks below support, it can move lower to the next support level. Learn to trade key levels in Lesson 7.
Trend : Short-term trend is Up, Medium-term trend is Strong Up and Long-term trend is Up.
Momentum is Bullish but inflecting. MACD Line is still above MACD Signal Line but momentum may have peaked since MACD Histogram bars are declining, which suggests that momentum could be nearing a downswing. Price is neither overbought nor oversold currently, based on RSI-14 levels (RSI > 30 and RSI < 70).
Support and Resistance : Nearest Support Zone is $3,200.00, then $2,930.00. Nearest Resistance Zone is $4,000.00, then $4,800.00.

ETH: Approaching ResistanceTrade setup : Price is in an Uptrend. Following a bullish breakout from a Descending Triangle pattern, price spiked up 25%, broke above $3,700 resistance and is approaching our near-term target of $4K. It's a bit overbought (RSI ~ 70). Now we look for the right entry opportunity in Uptrend. We wait for price to either 1) break above $4K to signal continuation of uptrend, with +17% upside potential to its ATH of $4,700, or 2) pull back near $3,750 key level for another swing trade entry in Uptrend with upside potential back to $4K . Learn to trade chart patterns in Lesson 8 and set Stop Loss levels in Lesson 9.
Pattern : Price is Approaching Resistance , which is a level where it could pause or reverse its recent advance, at least temporarily. Resistance is often a level where price got rejected in the past, or potentially prior Support level that was broken. (concept known as polarity). Once price breaks above resistance, it can advance higher to the next resistance level. Learn to trade key levels in Lesson 7.
Trend : Short-term trend is Strong Up, Medium-term trend is Strong Up and Long-term trend is Up.
Momentum is Bullish but inflecting. MACD Line is still above MACD Signal Line but momentum may have peaked since MACD Histogram bars are declining, which suggests that momentum could be nearing a downswing. Price is Overbought currently, based on RSI-14 levels (RSI > 70).
Support and Resistance : Nearest Support Zone is $3,200.00, then $2,930.00. Nearest Resistance Zone is $4,000.00, then $4,800.00.

ETHUSDT#ETH #Ethereum chart shows a perfect Falling Bullish Wedge formation. It has broken the resistance and maintained above it, confirming the bullish momentum. All we need to do is buckle up. The rise of Ethereum typically signals a revival in altcoins as well.

ETH: Channel Down PatternTrade setup : Trends are mixed but price remains above 200-day moving average, which keeps the long-term uptrend intact. It’s now trading in a Channel Down pattern. With emerging patterns, traders who believe the price is likely to remain within its channel can initiate trades when the price fluctuates within its channel trendlines. With complete patterns (i.e. a breakout) – initiate a trade when the price breaks through the channel’s trendlines, either on the upper or lower side. When this happens, the price can move rapidly in the direction of that breakout. Learn to trade chart patterns in Lesson 8.
Trend : Neutral on Short- and Medium-Term basis and Uptrend on Long-Term basis.
Momentum is Mixed as MACD Line is above MACD Signal Line (Bullish) but RSI ~ 50 (Neutral).
Support and Resistance : Nearest Support Zone is $2,960 - $3,040, then $2,700. The nearest Resistance Zone is $3,600, then $4,000 and $4,800.

ETH: Pullback in UptrendTrade setup : After getting rejected 3x at $2,400 resistance, ETH finally had a bullish breakout from Sideways Channel ($2,150 - $2,400), which signals resumption of uptrend, with upside to $2,750 next. Price has now pulled back to retest that breakout level. Stop Loss (SL) at $2,270 (5% below breakout level). ETH is likely to benefit from upcoming launch (May 2024) of Ethereum Spot ETF.
Trend : Uptrend across all time horizons (Short- Medium- and Long-Term).
Momentum is Bullish but inflecting. MACD Line is above MACD Signal Line and RSI is above 55 but momentum may have peaked since MACD Histogram bars are declining, which suggests that momentum is weakening.
Support and Resistance : Nearest Support Zone is $2,400 (previous resistance), then $2,150. The nearest Resistance Zone is $2,750.

ETH: Sideways Channel BreakoutTrade setup : After getting rejected 3x at $2,400 resistance, ETH finally had a bullish breakout from Sideways Channel ($2,150 - $2,400), which signals resumption of uptrend, with upside to $2,750 next. Stop Loss (SL) at $2,270 (5% below breakout level). ETH is likely to benefit from upcoming launch (May 2024) of Ethereum Spot ETF. Which related altcoins will benefit?
Trend : Uptrend across all time horizons (Short- Medium- and Long-Term).
Momentum is Bullish (MACD Line is above MACD Signal Line and RSI is above 55).
Support and Resistance : Nearest Support Zone is $2,150 (previous resistance), then $2,000. The nearest Resistance Zone is $2,400, which it broke, then $2,750.

ETH: Approaching ResistanceTrade setup : Following a bullish breakout from Ascending Triangle pattern, above $2,150 key level, price has reached our target of $2,400 resistance. Now we wait for price to either 1) break above $2,400 to signal continuation of uptrend, with upside to $2,750 next, or 2) pull back near $2,150 support for a swing trade entry in Uptrend with upside potential back to $2,400.
Trend : Uptrend across all time horizons (Short- Medium- and Long-Term).
Momentum is Mixed as MACD Line is below MACD Signal Line (Bearish) but RSI ~ 50 (Neutral).
Support and Resistance : Nearest Support Zone is $2,150 (previous resistance), then $2,000. The nearest Resistance Zone is $2,400, then $2,500.

🚧Ethereum Analysis(Three Falling Peaks Pattern)🚧🎄Merry Christmas!
💫Happy Holidays! I hope all of your Christmas wishes come true.
✅ Ethereum(ETH) managed to form a Three Falling Peaks Pattern near the 🔴 Heavy Resistance zone($2,540_$2,300) 🔴 and 🟡 Price Reversal Zone (PRZ) 🟡.
📚What is the Three Falling Peaks Pattern❗️❓
🔸 The three falling peaks pattern consists of three peaks and two valleys of give or take equal size. The pattern has a downward slope meaning that each peak is lower than the last, and the same applies to the valleys.
🔸The three falling peaks pattern validly forms when, after the last peak, the price falls below the second valley signaling a market reversal and a large price drop.
🔨Also, Ethereum managed to break the Support line and 🟢Support zone($2,270_$2,245) 🟢.
🔔I expect Ethereum to continue its decline towards the next 🟢Support zone($2,167_$2,116) 🟢 after completing the pullback to the 🟢Support zone($2,270_$2,245)🟢 and Support line .
❗️⚠️Note⚠️❗️: An important point you should always remember is capital management and lack of greed.
Ethereum Analyze ( ETHUSDT), 1-hour time frame ⏰.
Do not forget to put Stop loss for your positions (For every position you want to open).
Please follow your strategy; this is just my Idea, and I will gladly see your ideas in this post.
Please do not forget the ✅' like '✅ button 🙏😊 & Share it with your friends; thanks, and Trade safe.

Ethereum: Perfect PlayETH is nicely following my plan. Price touched my resistance level and dropped. To complete my main ideas we just need a little retest of the main trendline, that means a bounce from here. I will not enter long, because my plan is to short the bounce at trendline
