Healthy Pullback or Trend Breakdown? Market Context & Structure
BTC has delivered a strong impulsive rally, shifting market structure decisively bullish on the H1 timeframe. After the vertical expansion, price is now transitioning into a corrective phase, consolidating between a clearly defined resistance zone above and a higher demand area below. This behavior is typical of post-impulse digestion rather than trend failure.
Despite recent volatility and sharp wicks, the broader structure remains constructive as long as price continues to respect higher lows. The current price action reflects a battle between short-term profit-taking and medium-term trend continuation.
Technical Confluence
Price is currently trading between the rising EMA cluster, which continues to act as dynamic support, and a supply-heavy resistance zone where selling pressure previously emerged. The fast EMA has started to flatten, while the slower EMA remains positively sloped, suggesting momentum cooling but not yet reversing.
The highlighted support zone aligns closely with EMA support and prior breakout structure, reinforcing it as a key area for buyers to defend if the bullish trend is to remain intact.
Key Levels
Resistance:
94,400 – 94,900 (supply / rejection zone)
Support:
91,300 – 91,700 (demand zone)
90,400 (major horizontal support)
EMA / Dynamic Level:
EMA cluster around 92,000–92,400
Scenarios
➡️ Primary Scenario:
Rejection from the resistance zone leads to a controlled pullback into the 91.3k–91.7k support area. If price forms a higher low and shows bullish reaction within this zone, continuation toward the 94.8k resistance — and potentially a breakout toward 96k+ — becomes the higher-probability outcome.
⚠️ Risk Scenario:
A clean breakdown below the support zone with acceptance under the EMA cluster would invalidate the bullish continuation setup. In that case, downside extension toward the 90.4k level is likely, signaling a deeper corrective phase rather than a shallow pullback.
Etherum

Ethereum Is Losing Momentum — Distribution Before a PullbackPrice is currently stalling below the key resistance zone around 3,260–3,300, showing clear signs of bullish exhaustion after a strong impulsive rally. Repeated rejections from this area suggest distribution rather than continuation.
A failure to hold above 3,240–3,250 keeps the short-term bias bearish, opening room for a corrective move toward the first support at 3,210–3,190, where price may attempt a temporary bounce.
If selling pressure persists and price breaks below the EMA50 and 3,190 support, the correction could extend deeper toward 3,150 → 3,130, with a worst-case liquidity target near 3,080. Only a strong reclaim and close above 3,300 would invalidate the bearish pullback scenario and revive upside continuation.

Ethereum at a Structural Pivot: Continuation Reload 📊 MARKET STRUCTURE & PRICE ACTION OVERVIEW
Ethereum remains in a broader bullish market structure, characterized by higher highs and higher lows following a strong impulsive advance. After the expansion leg, price transitioned into a range-bound consolidation, reflecting temporary equilibrium between buyers and sellers rather than trend exhaustion.
Multiple attempts to push higher were met with sharp reactions, suggesting active supply near the highs, yet downside momentum has remained limited. This behavior indicates that sellers are reacting, but have not taken control of structure.
The market is now coiling within a defined support–resistance box, preparing for its next expansion phase.
🟦 SUPPLY & DEMAND – KEY ZONES
Key Resistance Zone:
The 3,300–3,310 area acts as a clear supply cap, where prior bullish momentum stalled and aggressive selling emerged. This zone represents institutional selling pressure and remains the level bulls must reclaim for continuation.
Primary Demand / Support:
The 3,240 zone is a critical demand area, aligning with:
Previous breakout structure
Horizontal support
Rising EMA (dynamic demand)
Secondary Demand:
Below that, 3,215–3,220 serves as deeper demand and structure protection. A move into this area would still be considered corrective unless followed by acceptance below.
🎯 CURRENT MARKET POSITION
Currently, ETH is trading near the lower boundary of its consolidation range, sitting directly above demand. This places price at a decision point, where buyers are expected to defend structure if the bullish trend is to remain valid.
The absence of strong bearish follow-through on recent pullbacks suggests selling pressure is corrective, not impulsive.
🧠 MY SCENARIO
As long as Ethereum holds above the 3,240 support zone, the broader bullish structure remains intact, and current price action can be treated as a corrective pullback within an uptrend. A sustained bounce from demand would likely lead to another test of the 3,300–3,310 resistance, and acceptance above this zone could open the door for continuation toward higher highs.
However, a clean breakdown and hourly acceptance below 3,240 would weaken bullish control and signal a deeper retracement toward the 3,215 demand zone. Only a failure to hold that lower demand would suggest a more meaningful structural shift.
For now, Ethereum remains in compression, not reversal.
⚠️ RISK NOTE
Price is sitting at a critical structural level. Wait for confirmation, respect key zones, and always manage your risk.

ETH Is Consolidating — Continuation Still Favored.Price remains in a bullish structure after a strong impulsive leg up. Recent candles show range-bound consolidation above support, not a breakdown.
Price Behavior / Momentum
Pullbacks are contained and shallow, with buyers defending the support zone. No aggressive rejection from highs → momentum is cooling, not reversing.
Key Levels
Resistance / Target: 3,260 → 3,310
Support Zone: 3,190 – 3,200
Invalidation: Below 3,180
Scenarios
➡️ Primary: Holding above the support zone opens continuation toward 3,260, then 3,310.
⚠️ Risk: A clean break below 3,180 would signal deeper correction and delay the bullish scenario.
Conclusion
Bias remains bullish, as long as price holds above the support zone.

SHOCKING ETHUSD Update: The 3,200 Level is a Powder KegHello traders! Here’s a clear technical breakdown of ETHUSD (1H) based on the current chart structure.
Market Structure: Ethereum has been in a sustained bullish trend, characterized by aggressive impulse moves followed by shallow consolidations. Price action is consistently making higher highs and higher lows, supported by a steep rising trendline.
Price Action and Support: After the most recent vertical expansion, the market has entered a consolidation phase. Price is currently hovering just above a newly established Support Zone around the 3,200 level. This zone is critical as it aligns with the previous breakout structure and is being reinforced by the blue EMA, which is acting as dynamic support.
Key Levels: The immediate floor is the Support Zone between 3,200 and 3,210. On the upside, the recent local high serves as the first resistance target, with the psychological level of 3,300 being the broader objective if the trend continues.
My Scenario: As long as ETHUSD remains above the 3,200 Support Zone, the bullish bias is firmly intact. I expect a period of sideways accumulation here before another leg higher to test new local highs. However, a decisive break and close below this support would suggest a deeper correction toward the secondary trendline or the red EMA.
Manage your risk!

Ethereum Compresses Below Major Supply On the 1H timeframe, Ethereum is trading within a well-defined sideways range, capped by a strong resistance zone around 3,050–3,080 and supported by a demand area near 2,900–2,920. Price has repeatedly failed to establish acceptance above the upper boundary, confirming that this zone remains a dominant supply area rather than a breakout level.
The sharp impulsive rally into resistance earlier in the session was followed by an immediate rejection, forming a classic stop-run and distribution reaction. This behavior indicates that liquidity above prior highs was absorbed by sellers, not followed by continuation. Since then, price has rotated back into the range, reinforcing the market’s balance condition rather than trend expansion.
From a structural perspective, Ethereum is currently printing overlapping candles and shallow pullbacks, characteristic of range-bound price action. The 34 EMA and 89 EMA are flattening and converging, which further supports the view that momentum is neutral and that the market is waiting for a catalyst to resolve the range.
On the downside, the support zone around 2,900–2,920 has been respected multiple times. Each test has produced a reaction, suggesting the presence of responsive buyers. However, these bounces lack strong follow-through, highlighting that demand is defensive rather than aggressive at this stage.
From a macro and sentiment standpoint, Ethereum remains highly correlated with broader crypto risk appetite and liquidity conditions. With no immediate macro shock or strong risk-on impulse, price action favors mean reversion within the range rather than a sustained directional move.
In summary, Ethereum is in a clear consolidation phase between major supply and demand. A clean breakout above 3,080 with acceptance and volume would be required to shift the structure bullish. Until that occurs, rallies into resistance and dips into support should be viewed as range rotations, not trend signals.

thereum Is Not Trending — It’s Being NegotiatedCOINBASE:ETHUSD is currently trading inside a well-defined sideways range, with price repeatedly oscillating between a strong resistance zone near 3,050–3,080 and a support zone around 2,900–2,920. The chart clearly shows that neither buyers nor sellers have been able to establish sustained control, resulting in rotational price behavior rather than a directional trend.
From a price action standpoint, the recent impulsive rally into the upper resistance zone was met with immediate and aggressive selling pressure. The sharp rejection from this area confirms that supply remains dominant at higher prices, and the market has not yet accepted value above this resistance. Importantly, the rejection was followed by a fast retracement back into the range, a classic sign of failed continuation rather than a healthy breakout.
Structurally, COINBASE:ETHUSD continues to form overlapping highs and lows, which is characteristic of consolidation. There is no clear sequence of higher highs or lower lows on the 1H timeframe. Instead, price is rotating around the mid-range equilibrium near 2,940–2,960, where liquidity is actively exchanged. This reinforces the idea that the market is in a balance phase, not a trend phase.
The moving averages (EMA 34 and EMA 89) further support this neutral bias. Both averages are flattening and converging, with price frequently crossing above and below them. This behavior typically reflects compression and indecision, not momentum. Until price can hold decisively above the EMAs with expansion, or break below them with follow-through, directional conviction remains weak.
On the macro side, COINBASE:ETHUSD is currently lacking a strong catalyst. BITSTAMP:BTCUSD is consolidating, U.S. yields are relatively stable, and there is no immediate Fed driven volatility pushing risk assets decisively in one direction. As a result, COINBASE:ETHUSD is trading more on technical liquidity levels than on macro narrative, which explains the repeated range-bound reactions.
In summary, COINBASE:ETHUSD remains neutral and range-bound, capped by strong resistance overhead and supported by a well-defended demand zone below. The market is waiting for acceptance outside the range, not reacting to anticipation. Until a clean breakout or breakdown occurs with volume and follow-through, COINBASE:ETHUSD should be approached as a mean-reverting market, where patience and level-based execution matter more than directional bias.

Ethereum Isn’t Pulling Back — It’s Building the LaunchpadETHEREUM (ETHUSD) – 1H
1. Market Structure
ETH remains in a broader bullish structure, with price holding well above the major support zone (~2,760–2,800).
The recent decline from the local high is corrective, not impulsive — showing controlled profit-taking.
Current price is stabilizing around 2,960–2,980, forming a higher low relative to the previous swing.
➡️ This is a bullish pullback inside an uptrend, not a reversal.
2. Key Zones
Support Zone: 2,900–2,940
→ Buyers are actively defending this area.
Resistance Zone: ~3,160
→ This is the next major liquidity target and prior supply zone.
Price is compressing between support and mid-range — a classic pre-expansion structure.
3. Price Path Scenarios
Primary Scenario (Bullish Continuation):
Hold above 2,900
Push back toward 3,040 → 3,100
Final breakout attempt toward 3,160 resistance
If liquidity above 3,160 is taken → continuation toward higher highs
Invalidation Scenario:
Clean acceptance below 2,880
Would open downside toward 2,820–2,780 support
Only then would structure turn neutral
4. Momentum & Context
No signs of aggressive selling or distribution.
Pullback shows overlapping candles, indicating sellers lack conviction.
ETH is still tracking Bitcoin’s range behavior, suggesting synchronized expansion when BTC breaks.
➡️ Market conditions favor patience + positioning, not panic.
🧠 Final Takeaway
Ethereum is not rejecting resistance it’s absorbing it.

ETH Isn't Chasing— It’s Building Pressure for the Next ExpansionETHEREUM (ETHUSD) – 1H TECHNICAL & MACRO UPDATE
Technical Structure
Price is printing higher highs and higher lows, confirming short-term bullish structure.
The support zone around 2,910–2,920 is holding firmly → buyers are defending pullbacks.
Current price is consolidating above the prior breakout level, a classic continuation setup.
Target 1 (~3,060) acts as the first liquidity objective.
Target 2 (~3,160) aligns with the next major supply zone if momentum persists.
No bearish reversal pattern is present unless price loses the highlighted support zone decisively.
Macro Context
USD strength has stalled, reducing downside pressure on risk assets.
U.S. yields are stabilizing, allowing capital to rotate back into crypto.
Broader market sentiment favors risk-on accumulation, especially for large-cap crypto like ETH.
No negative macro catalyst currently strong enough to invalidate the bullish structure.
Summary
Bias remains bullish while above support.
Expect shallow pullbacks → continuation toward Target 1, then Target 2.
Strategy favors buying pullbacks, not chasing breakouts.
ETH is advancing with structure and macro alignment this is controlled expansion, not excess.

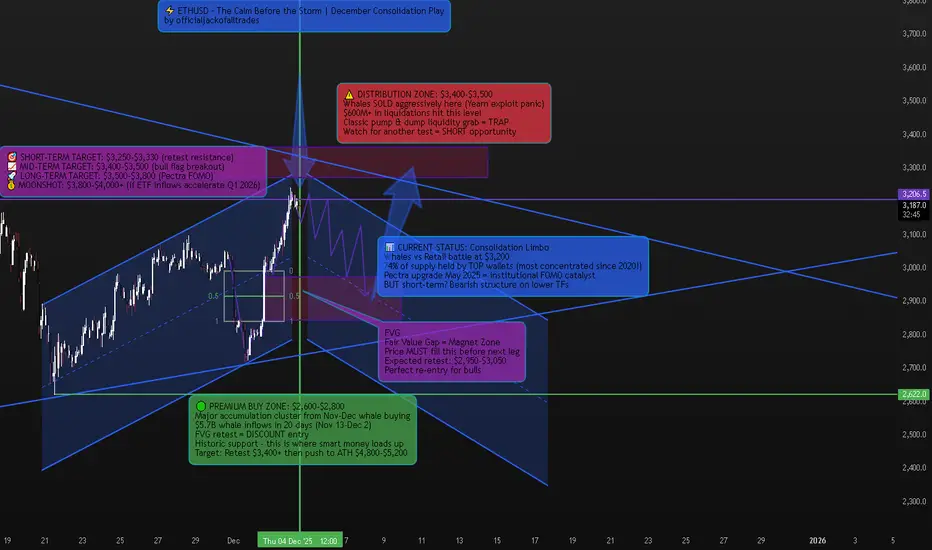
ETHUSD – The Calm Before the Storm | December's Most Misundersto📈 Market Context – Why Everyone's Wrong About ETH Right Now
Ethereum is sitting at one of the most deceptive price levels in crypto right now. Most traders see the recent dump from $3,762 on December 2 and think "it's over." Others see the consolidation around $3,208 and think "dead cat bounce."
They're both missing the bigger picture.
Here's what ACTUALLY happened: A 2015 Ethereum ICO wallet that had been inactive for a long time moved 40,000 ETH suddenly, worth around $120 million. Crypto Twitter panicked. But then Lookonchain verified that it was for internal transfer, and not a liquidation. Classic FUD.
What REALLY tanked ETH? A Yearn Finance exploit that happened at the worst possible time, when the market was stretched by leverage and rising speculative positioning. More than $600 million in crypto liquidations hit the market. This wasn't an organic selloff—this was a leveraged washout.
But here's the kicker: While retail was panic-selling, whales were accumulating like it's 2020 all over again.
🔎 Technical Framework – The Deceptive Calm
Current State:
Ascending broadening wedge inside rising channel—classic volatility compression before explosive move
Key Liquidity Zones:
🔴 Distribution Liquidity Zone (SHORT Opportunity):
$3,550 - $3,650 (recent spike high + whale distribution cluster)
This is where whales moved 40,000 ETH at $120 million valuation before the "transfer" narrative
Since December 2024, aggressive selling by whales has been evident in the rise of average market order sizes
🟢 Accumulation Liquidity Zone (BUY ORIGIN):
$2,900 - $3,000 (FVG retest + November-December whale buy zone)
From November 13 to December 2, whales acquired a total of 1,702,835.5 ETH at an average price of $5.7 billion
In early 2025, large holders acquired over 330,000 ETH, valued at approximately $1.08 billion
⚖️ Chop Zone (NO TRADE ZONE):
$3,100 - $3,400 (current consolidation limbo)
This struggle between institutional investors and retail traders could define Ethereum's price action in the coming weeks
🐋 WHALE ACTIVITY – The REAL Story Nobody's Talking About
While everyone's focused on the dump, let me show you what the ACTUAL data says:
The Accumulation Phase (That Everyone Missed):
Ethereum whale wallets have recorded positive netflows in each of the last 20 trading days, dating back to November 13
The highest single-day inflows of 2570 ETH came on November 14 when Gensler's exit was confirmed
Ethereum ETFs attracted $2.63 billion in inflows in December 2024, led by the Fidelity Ethereum Trust
The Concentration Effect (This is MASSIVE):
Over the past four months, Ethereum's Gini coefficient increased from 0.7563 in September to 0.7630 in December 2024—a clear sign of growing ownership concentration. Translation? Whales are consolidating control.
Even crazier: Addresses holding 10,000+ ETH now control 74.47% of Ethereum's circulating supply. Compare that to Bitcoin where large holders control only about 15%—ETH is FIVE TIMES more whale-controlled than BTC.
This is why ETH moves are so violent and why large transfers or sales by a tiny fraction of holders can rapidly sway Ethereum's price and sentiment.
The Distribution Signal:
But here's where it gets interesting: Since December 2024, there has been an increase in aggressive sell orders, particularly from whales, with rising average market order sizes suggesting they are offloading holdings.
So what gives? Are whales accumulating or distributing?
BOTH. They're accumulating at discount levels ($2,900-$3,050) and distributing at premium levels ($3,550-$3,650). This is classic smart money behavior—they're range-trading the volatility while retail gets chopped.
🚨 Recent Developments – The Catalyst Stack
Pectra Upgrade – May 7, 2025 (GAME CHANGER)
The Pectra upgrade went live in May 2025, introducing batch transactions, gas payment in any token, and doubling blob capacity for Layer 2s.
Key improvements:
Account Abstraction enables gas payments using multiple tokens like USDC and DAI, with third-party fee sponsorship
EIP-7691 doubles Ethereum's blob throughput from three blobs with a maximum of six to six with a maximum of nine
With the Pectra upgrade, Ethereum's data capacity significantly increases to about 420 TPS from 210 TPS
Translation: ETH just became TWICE as fast for Layer 2s. This is MASSIVE for scalability and will drive institutional adoption.
ETF Inflows – The Silent Accumulation
Ethereum ETFs attracted substantial institutional interest, with inflows reaching $2.63 billion in December 2024. This is institutional money positioning for the next leg up—they don't buy at tops, they buy at bottoms.
Gary Gensler Exit – Regulatory Tailwind
The impending exit of SEC chairman Gary Gensler enhanced investor confidence in the altcoin sector, putting Ethereum in prime position to deliver superior performance relative to BTC.
Staking Explosion
Staking activity reached near-all-time highs, with 36.19 million ETH locked in validators—a 4.5% increase since October 2024. That's $115+ BILLION locked away, reducing circulating supply.
DeFi TVL At $90 Billion
Total Value Locked in Ethereum protocols surged to $90 billion, driven by renewed interest in yield-bearing DeFi products. Institutional money is FLOODING into ETH DeFi.
🎯 Trade Plans – High-Probability Setups
🟢 BUY ETHUSD: $2,900 - $3,000 | SL $2,820
Thesis: FVG retest at proven whale accumulation zone + November-December $5.7B whale buying cluster = institutional re-entry point
Entry Rules (MUST WAIT FOR CONFIRMATION):
Price dips into $2,900-$3,000 FVG zone
Bullish CHoCH (Change of Character) + BOS (Break of Structure) on H1-H4
Strong bullish rejection wick with volume spike (100K+ ETH volume on 4H)
Ideally on Order Block retest after initial bounce
BONUS CONFIRMATION: Check whale netflow data on IntoTheBlock—if showing positive inflows, ADD to conviction
Targets:
$3,350 - $3,400 (mid-channel retest, quick 12-15% gain)
$3,600 - $3,750 (previous high retest + distribution zone, 23-28% gain)
$4,200 - $4,500 (bull flag breakout + Pectra FOMO begins, 42-50% gain)
$5,200 - $5,800 (ATH retest + full bull market confirmation, 75-95% gain)
Moonshot: $6,500+ (if ETF inflows accelerate post-Pectra like BTC did)
Risk Management:
Position size: 3-5% of portfolio (this is a HIGH-CONVICTION setup)
Scale in 40% at $3,000, 30% at $2,950, 30% at $2,900
Trail stop to breakeven after hitting Target 1
Take 30% profit at Target 2, let rest ride with trailing stop
🔴 SELL ETHUSD: $3,550 - $3,650 | SL $3,750
Thesis: Premium liquidity retest at proven whale distribution zone—classic "return to scene of crime" before deeper correction
Entry Rules (WAIT FOR CONFIRMATION):
Price pumps into $3,550-$3,650 zone (previous spike high)
Bearish CHoCH + MSS (Market Structure Shift) + BOS down on H1-H4
CRITICAL: Check CryptoQuant whale-to-exchange flow—if showing HIGH exchange inflows (whales moving ETH to exchanges to sell), this is your GO signal
Heavy volume spike on bearish candle (150K+ ETH on 4H)
Entry after FVG fill or Order Block retest post-initial rejection
Targets:
$3,200 - $3,250 (first support retest, quick 8-12% gain)
$3,050 - $3,100 (mid-channel support)
$2,900 - $3,000 (FVG zone—BUY setup reactivates here!)
Risk Management:
This is a COUNTER-TREND trade—use tighter stops
Position size: 2-3% max (smaller than long setup due to higher risk)
Take 50% profit at Target 1, move SL to breakeven
Exit FULLY at Target 3 and flip to LONG setup
⚠️ Risk Management & Critical Notes
The #1 Mistake: Trading inside the $3,100-$3,400 chop zone without confirmation. The struggle between institutional investors and retail traders in this range creates whipsaw conditions this is where retail accounts get DESTROYED.
Whale Flow Monitoring is NON-NEGOTIABLE: High leverage remains with funding rates indicating very high risk-taking activities and markets still inclined towards speculative long positions. Use Glassnode or IntoTheBlock to monitor whale exchange inflows BEFORE entering trades.
Volatility Warning: This concentrated ownership structure means large transfers or sales by a tiny fraction of holders can rapidly sway Ethereum's price. Set alerts for 10,000+ ETH whale movements on Whale Alert.
Macro Headwind: Japan has indicated tightening, and U.S. real interest rates remain high. Under low liquidity conditions, even minor shocks can trigger significant price changes. If SPX dumps 5%+, ETH follows—be ready to cut positions.
Position Sizing: Given the extreme whale concentration, never go all-in. Scale positions at key levels. This isn't a casino—it's warfare against billion-dollar players.
📊 The Bottom Line – Why This Time Is Different (Or Isn't)
Let me give it to you straight: ETH is at a crossroads.
The Bull Case (What I'm Leaning Toward):
✅ $5.7 billion in whale accumulation over 20 days since November 13
✅ $2.63 billion in ETF inflows in December 2024
✅ $90 billion TVL in DeFi protocols institutions are building
✅ Pectra upgrade doubled transaction throughput to 420 TPS
✅ 36.19 million ETH staked = reduced supply
✅ Gary Gensler gone = regulatory tailwind
✅ Technical structure: Rising channel still intact, FVG below = perfect retest setup
The Bear Case (What Keeps Me Up at Night):
⚠️ Aggressive whale selling since December with rising average market order sizes
⚠️ Even as Bitcoin and Solana hit all-time highs after Trump's election, Ether topped out at $4,000 in December, well short of its 2021 high of $4,800
⚠️ High leverage with funding rates indicating very high-risk speculative long positions
⚠️ Global liquidity tightening from Japan and high U.S. real interest rates
⚠️ 74.47% of supply controlled by whales = extreme manipulation risk
⚠️ Price underperforming BTC and SOL = capital rotation away from ETH
My Take:
The $5.7 billion whale accumulation since November 13 tells me smart money is positioning for a move. But the aggressive whale selling at premium levels tells me they're range-trading, not accumulating for a straight pump to $10K.
Here's the play:
Short-term (Dec-Jan): Expect consolidation with violent swings. Trade the range: buy $2,900-$3,000, sell $3,550-$3,650.
Medium-term (Feb-April): After Pectra hype builds + ETF inflows accelerate, we get the push to $4,200-$4,800.
Long-term (Mid-2025+): If ETH breaks $4,800 ATH with volume, we're going to $5,800-$7,000+.
BUT: If ETH breaks below $2,850 with volume, the bull case is dead and we're heading to $2,600-$2,400 to fill lower FVGs.
🔥 Strategy Summary – How I'm Trading This
Phase 1 (NOW - January):
Wait for dip to $2,900-$3,000 FVG zone
Scale in long position (3-5% of portfolio)
Target: $3,600-$3,750 for 25-30% gain
Take 30% profit, trail stop on rest
Phase 2 (If we hit $3,600+):
Watch whale exchange inflows
If HIGH inflows (distribution signal) → SHORT at $3,550-$3,650
If LOW inflows (holding) → add to longs, target $4,200-$4,500
Phase 3 (Post-Pectra Hype, March-May):
If ETH holds above $3,600 and Pectra adoption is strong → go HEAVY long
Target: ATH breakout to $5,200-$5,800
This is the "generational wealth" move IF it plays out
Invalidation:
Close ALL longs if ETH closes below $2,850 on daily
Flip bearish, target $2,600-$2,400
💡 Final Word – The Truth About ETH Right Now
ETH isn't "dead." But it's not "mooning tomorrow" either.
Critics have blasted developers' decision to focus on Layer 2 blockchains, arguing those chains siphon value from ETH. That's a real concern. ETH isn't pumping like BTC or SOL because value is flowing to L2s.
But here's the counterargument: With the Pectra upgrade, this will double L2 performance out of the gate, leading to lower costs and faster transaction times. If L2s explode in adoption, ETH benefits as the base layer. It's like owning the toll road, not the cars.
The Question: Will the $2.63 billion in ETF inflows and $5.7 billion in whale accumulation be enough to push ETH to new ATHs? Or will whale distribution at premium levels and high leverage markets cause another violent shakeout first?
My bet: One more shakeout to $2,900-$3,000 (FVG retest), THEN the real pump begins. But I'm not holding through a breakdown below $2,850. That's where I cut and flip bearish.
Trade the structure. Follow the whales. Protect your capital.
Drop a 🔥 if you're watching that $2,900-$3,000 FVG like a hawk. This is where fortunes are made or lost.
ETHUSDT /// 2DECEthereum lately has been showing signs of weakening after losing the support area around $3400–$3600. With this break, the market structure has shifted toward a more bearish tone, meaning the asset may continue forming lower highs and lower lows as long as downward momentum remains dominant.
At the moment, price reactions around the $3000 zone suggest that supply is still relatively strong. If this structure continues, several potential bearish paths remain valid.
⸻
Possible scenarios toward the $2000 region
Scenario 1
If the $3000 area acts as a local high, Ethereum could continue its downward trajectory toward the $2000 zone.
In such a case, the price might develop smaller corrective upward movements within the broader bearish leg.
⸻
Scenario 2
Another possibility is that the $2800 area generates a short-term bullish reaction.
Such a move could push the price toward the $3600–$3800 range before facing renewed selling interest.
If that happens, a continuation toward the $2000 zone could remain on the table.
⸻
General outlook
In both scenarios described above, a revisit of the $2000 area is one possible development based on the current technical structure.
This outlook is purely scenario-based and may change if the market structure shifts.
⸻
About the possibility of $1000 ETH
Reaching the $2000 zone does not automatically imply deeper downside.
However, the manner in which price approaches that area could provide clues:
• A sharp, capitulation-type decline toward $2000 might suggest that a local bottom has formed.
• A slow, corrective decline could indicate weakening momentum, in which case observing price behavior after reaching $2000 becomes important.
If bearish continuation patterns appear at that stage, lower levels — including the $1000 region — cannot be ruled out as long as the downtrend structure persists.
Once price interacts with the $2000 zone, I will share an updated analysis based on the new market structure.

EthereumETHUSD
- Bullish Channel as an corrective pattern in Short Time Frame
- Break of Structure
- RSI - Divergence
- Order Block
- S / R Level

ETH/USD – Bulls Ready for the Next Leg Up?Ethereum is showing a clean retrace into the rising trendline and POC/ VWAP zone — classic setup for a continuation move.
As long as price holds above $3,950, bulls remain in control with targets at $4,733 and beyond.
Momentum is cooling but structure stays bullish. Is this just the calm before the next breakout? 👀
💬 What’s your plan here — riding the trend or waiting for confirmation?

Ethereum 1H Analysis – Key Battle at $4,278 Resistance | D1👋 Hey everyone! Hope you’re doing great!
💥 Welcome to Satoshi Frame — today we’re diving into the 1-hour Bitcoin analysis. Stay tuned and follow along!
👀 1-hour timeframe of Ethereum, and we can see that Ethereum, after the heavy drop it experienced, broke down from the 4278$ area and moved toward its lower support levels. A major support level has formed around the 3692$ area, where we saw strong buyer support, and they pushed the Ethereum price upward. After the upward movement and buyer support, as Ethereum approached its resistance in the 4278$ area, the buying volume decreased, and then buyers’ strength ended. Sellers, with strong momentum and multiple red candles, pushed the price down toward the 3941$ support, where the price was supported again. Now a higher low has formed compared to the 3941$ bottom, and the price is moving toward its key resistance area at 4278$.
🧮 We can see in the RSI oscillator that there is a key level around 70, which is the OverBuy boundary. If the fluctuation limit passes this area, Ethereum can break its resistance around 4278$.
🕯 Regarding volume, there is an educational note that when the price approached the 4278$ resistance, it faced a decrease in buying volume and was rejected from this area with many red candles. Now that the price is moving toward this resistance, if it is accompanied by an increase in buying volume, it increases the probability of breaking this resistance for us.
🧠 For the Ethereum position, a breakout of the 4278$ area is needed, and now if the price moves toward this area, it will form our second touch and create several scenarios for us.
↗️ First scenario for long position: breakout of resistance accompanied by an increase in volume and setting the trigger at 4278$, which gives us a large stop size and reaches its risk-to-reward ratio later.
↗️ Second scenario for long position: wait for the price to have a reaction to the 4278$ area and then create a higher high and higher low for us, and we can enter on the created higher low and place our stop below that same low.
❤️ Disclaimer : This analysis is purely based on my personal opinion and I only trade if the stated triggers are activated .

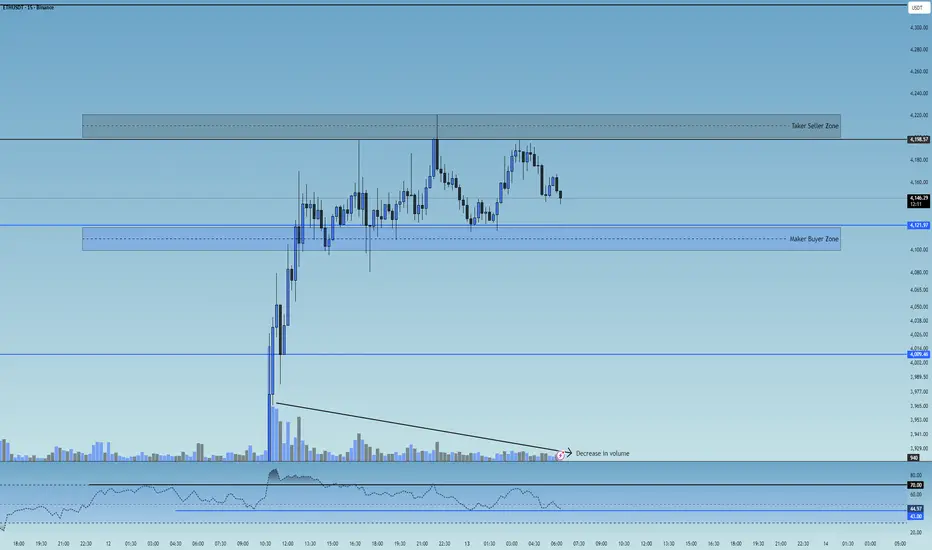
ETH 15M Analysis - Key Triggers Ahead | Day 33☃️ Welcome to the cryptos winter , I hope you’ve started your day well.
⏰ We’re analyzing ETH on the 15-Minutes timeframe .
👀 On the 15-minute timeframe for Ethereum, we can see that after an impressive 10% rally, ETH showed one of the strongest recoveries in the market compared to other major coins — managing to climb above $4,100 and form a new trading range early in the week. Currently, Ethereum is consolidating within a range between $4,200 (top) and $4,121 (bottom). A breakout from this range could create either a long or short setup. Keep in mind that following this strong bullish move, trading volume has started to decline inside this range.
🧮 Looking at the RSI oscillator, we can see that after the recent surge, ETH’s momentum is now fluctuating between 43 and 70. A breakout above or below this RSI range would likely increase volatility and accelerate Ethereum’s next move — potentially with fewer candles but stronger momentum.
🕯 The size and volume of recent candles during Ethereum’s rally have been exceptional. Major buyers and institutional players have added substantial ETH positions to their portfolios. The large, high-volume bullish candles leading up to the current range reflect Ethereum’s strong momentum. Now, while the price is oscillating inside the range with reduced volume, a clear volume expansion is expected once the range breaks.
🧠 As Ethereum remains trapped inside this trading range, a breakout will require increased volume and RSI confirmation beyond the defined thresholds. This setup gives us two potential scenarios:
↗️ Long scenario: If Ethereum breaks above $4,200, which acts as a taker-seller resistance, and RSI pushes above 70 (Overbought zone), ETH could launch another bullish leg early in the week — showing an even stronger recovery compared to the rest of the market.
📉 Short scenario: If Ethereum breaks below $4,121, which is a maker-buyer support, and RSI drops under 43 toward the Oversold zone, it could continue its downward correction. However, given ETH’s strong bullish momentum, this bearish scenario would likely require negative market fundamentals to fully play out.
❤️ Disclaimer : This analysis is purely based on my personal opinion and I only trade if the stated triggers are activated .
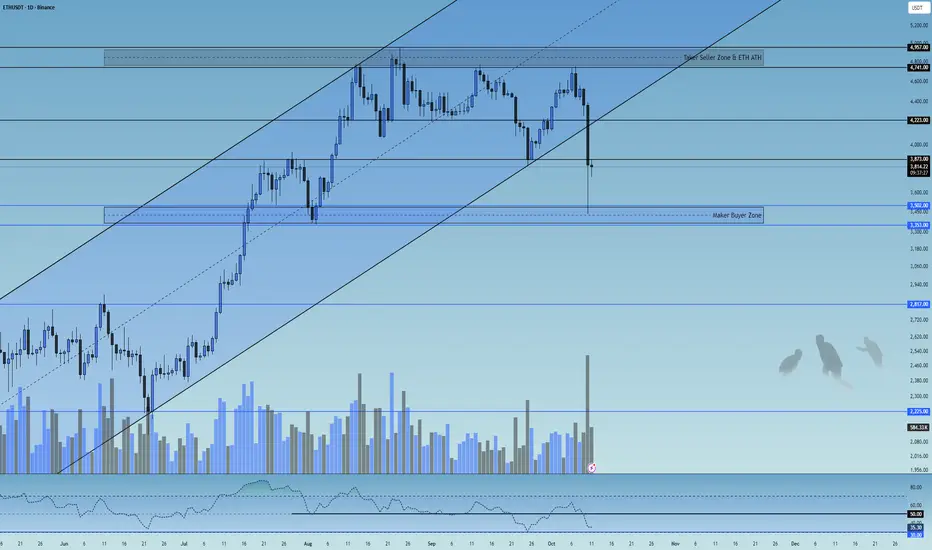
ETH 1D Analysis - Key Triggers Ahead | Day 32☃️ Welcome to the cryptos winter , I hope you’ve started your day well.
⏰ We’re analyzing ETH on the 1-Day timeframe .
👀 On the Ethereum daily timeframe, we can see that after the historic economic war between the U.S. and China, Ethereum broke its ascending channel with a high-volume whale candle and has now managed to stabilize below this channel. Currently, Ethereum is in a critical decision-making zone, with two key resistance levels at $3,873 and $4,223.
A break and confirmation above these zones, especially $4,223, could lead to a bullish continuation; otherwise, a breakdown below the channel support may trigger a deep correction and cause Ethereum to enter a risk-off phase on the higher timeframe (weekly).
🧮 Looking at the RSI oscillator, after crossing down from the 50 level, it is now heading toward the 30 and oversold region. These two zones — 50 and 30 — are our key RSI levels, and when volatility crosses these zones, it can be accompanied by a significant increase in trading volume.
🕯 The recent daily candle of Ethereum has shown a massive amount of sell volume, with an open around $4,400 and a close below $3,900 (ignoring the shadow). This indicates strong selling pressure — if buyers fail to hold Ethereum above $4,200, we could see further correction and selling pressure ahead.
🧠 Currently, there’s no specific trigger for Ethereum, but a trading range will likely form in this zone until the end of the week.
A break of either the top or bottom of this range across multiple timeframes could give us a potential long or short position.
❤️ Disclaimer : This analysis is purely based on my personal opinion and I only trade if the stated triggers are activated .
ETH - UPDATE - MASTERCLASSCRYPTOCAP:ETH - 22/09 vs today: Update - MASTERCLASS 🔥
"Still bullish medium/long term, but a further correction is very possible before liftoff!
Bulls need to hold $3780. Below = trouble…Above = game still on for ATH attempts later. 📉"
Insane setup shared if you followed! 3800$ liquidities grab ✅
Prices is up 23%+ from this zone mentionned! 🔥
Are we ready to fly toward 5000$ now??
I'll let you discover on the next analysis Im working on!
Life if you want to see it! 👍

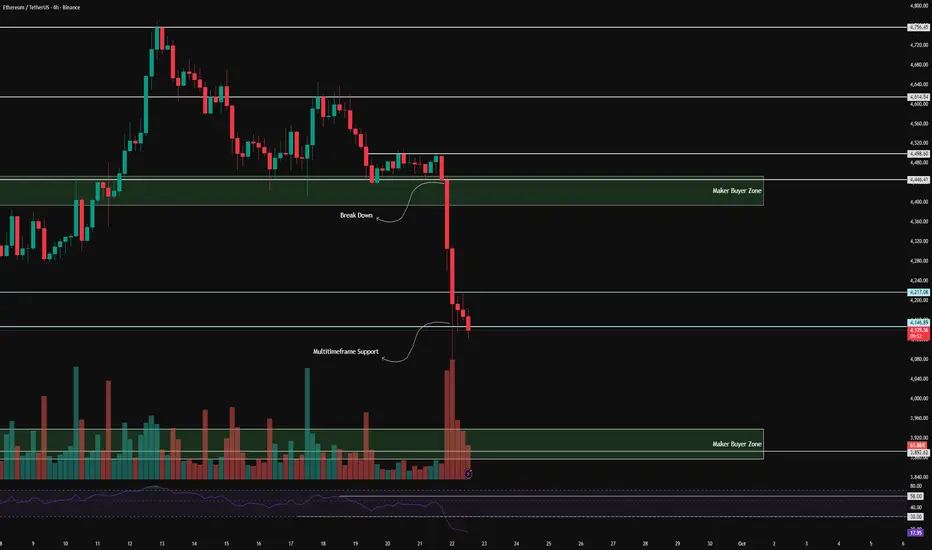
ETH 4H Analysis - Key Triggers Ahead | Day 25😃 Hey , how's it going ? Come over here — Winter got something for you!
⏰ We’re analyzing ETH on the 4-Hour timeframe.
👀 On the 4H timeframe for Ethereum, we can see that after breaking below its maker-buyer zone, ETH moved down toward lower support levels, experiencing a **7% drop** — an unexpected move that even pushed major holders to sell. Ethereum is now sitting at a **multi-timeframe support zone**, and if this level is lost, it could head toward the next lower maker-buyer area, where we’ll need to observe how price reacts.
🧮 The **RSI oscillator** shows ETH deep in the **oversold zone** with heavy selling pressure. Buyers have yet to step in, meaning that with more sell-side momentum, Ethereum could remain oversold for an extended period.
🕯 The **size and volume of red candles** have increased sharply in a short span of time. This fast move down with fewer candles signals **strong selling sentiment**, while price itself looks uncertain about its next direction.
💸 Looking at **ETHBTC**, the pair experienced a sharp drop and deep correction with the start of the new week. It is also resting at a multi-timeframe support zone. If that breaks, Ethereum could face a further correction.
🧠 As for positioning, it’s still early. We’d prefer to wait for the market to build a stronger structure and possibly a wider range before entering. A **short position below the 4147 support** is possible with low risk, but since RSI remains heavily oversold, we must also consider the potential for a **price rebound**.
❤️ Disclaimer : This analysis is purely based on my personal opinion and I only trade if the stated triggers are activated .
ETH - 17/09 VS TODAY - MASTERCALL AGAIN! 🏆 #ETH - 17/09 vs Today - Update 🔄
Medium-Term Outlook: “Insane Plays Ahead!” 🔥
🎯Targets hit: $4,000–$4,050 liquidity zone ✔️
Current TA:
🔸Price rejected sharply; H4 looks bearish, RSI is highly oversold.
🔸Short-term: potential for a relief bounce!
🔸Possible scenario: Retest of the $4,300–$4,350 former support ahead? 📈
Weekly Structure
🔹Bias stays bullish long-term.
🔹BUT: Structure reminds me a lot of #BTC right before its massive run!
🔹Are we about to see an extra dip towards $3,700- $3,800 before the next moon mission? (Check chart for context!)📉💣
Short-Term Bias
🔹Price action = Neutral & tricky.
🔹Bulls want a reclaim above $3,780 to keep the upper hand.
🔹Big risk: If we break below $3,780 → likely drop to $3,300–$3,200 range!⚠️
Local Support Zones
$4,070
$4,000
💡Summary
Still bullish medium/long term, but a further correction is very possible before liftoff!
Bulls need to hold $3,780. Below = trouble…Above = game still on for ATH attempts later. 📉

ETH.D (Ethereum Dominance) Weekly TF 2025
Summary:
Ethereum Dominance (ETH.D) has likely bottomed after retracing to its 78.6% Fibonacci level (~6.59%) and is showing early signs of a structural reversal. With institutional inflows, growing staking adoption, and key upcoming Ethereum upgrades, ETH.D may reclaim significant market dominance over the next 12–18 months. Our chart anticipates a bounce-pullback-rebound structure, aiming for 3 target zones: TP1 (23.5%), TP2 (30.8%), and TP3 (39%).
Contextual Market Alignment:
This ETH.D bullish bias aligns strongly with our broader market outlook:
TOTAL Market Cap Analysis → Bullish breakout structure, indicating overall crypto expansion.
TOTAL2 (Altcoin Market Cap Ex-BTC) → Bullish retracement completion and extension targets active.
BTC.D (Bitcoin Dominance) → Bearish confluence zone, suggesting Bitcoin may underperform versus ETH and altcoins, freeing up dominance space for ETH.D to rise.
Chart Context:
This weekly ETH.D chart uses a Fibonacci retracement from the top (~30.81%) to bottom (0%) to identify potential reversal zones. The dominance hit a key support area at the 78.6% Fib retracement (6.59%), showing a reaction that may develop into a reversal. The roadmap includes:
Rebound toward TP1 (23.54% = 23.5%)
Minor correction or consolidation
Breakout continuation toward TP2 (0.0% = 30.8%)
Extension leg targeting TP3 (–27% = 39%)
Key Technical Observations:
Support Levels:
78.60% = 6.59% (bottom support)
88.60%=3.5%
Possible Resistances:
61.80% = 11.77%
48.60% = 15.84%
38.20% = 19.04%
Resistance & TPs:
TP1: 23.54% (23.6% Fib)
TP2: 30.81% (Full retrace = 0%)
TP3: 39.13% (–27% extension)
Current level: ~9.36%
Clear bullish structure with a “bounce–pullback–rebound” sequence
Indicators:
Fibonacci retracements from ~30.81% to 0%
Structural pattern: rounded bottom / double bottom
Hidden bullish divergence forming on weekly timeframe
Fundamental Context:
Institutional Inflows & ETF Dynamics:
Since July 2024’s launch of spot Ether ETFs, inflows have been strong with a 15-day streak totaling approximately $837 million (~25% of total net inflows).
Recently, the SEC approved options trading on spot ETH ETFs (e.g., BlackRock, Grayscale), deepening liquidity and offering hedging mechanisms.
BlackRock is now pushing to add staking functionality allowing yield generation within an ETF wrapper. If approved, this could markedly increase demand.
Staking Growth & On-Chain Supply Dynamics:
27% of ETH is already staked, and ETF inflows could lift that by >10%.
A staking ETF would institutionalize ETH staking: more capital locked, less circulating supply → supply constraints could support dominance and valuation.
Ethereum Backbone in DeFi & RWA:
Ethereum still leads the Real-World Asset (RWA) space: over 50% market share and ~$5–6 billion in assets tokenized on-chain.
Its core infrastructure underlies the majority of DeFi, smart contracts, and stablecoins, reinforcing ETH.D’s structural resilience.
Network Upgrades & Tech Progress:
The Pectra upgrade (mid-2025) is on the horizon, introducing EIP-7251/7702, improving validator flexibility and network usability.
Combined with recent Dencun improvements, Ethereum is becoming cheaper and more efficient, boosting adoption in L2 ecosystems.
Price action & on-chain indicators:
ETH price has surged ~46% in the past 30 days, driven by ETF demand; some analyst forecasts target $3,000–5,000 year-end.
The withdrawal of ~$1.2 billion ETH from exchanges suggests increasing long-term holdings and less selling pressure.
Integrating with Your Technical Setup:
Level: 78.6%–61.8% bounce zones (6–11%)
Fundamental Support: Institutional re-entry via ETFs often begins with accumulation near support.
Level: TP1 at 23.6% (23.5%)
Fundamental Support: Could coincide with ETF inflows + early vesting of staking narratives.
Level: TP2 (~30.8%)
Fundamental Support: Full retrace driven by mass ETF adoption, options trading, and upgrade momentum.
Level: TP3 >39% (–27% ext.)
Fundamental Support: If staking ETF and yield-bearing structures go live, ETH.D could reach new dominance highs.
Summary of Fundamental Catalysts:
Spot ETH ETF inflows (~$800 M), with options exposure adding liquidity.
Upcoming staking ETF (BlackRock, Grayscale) with >10% locked-up supply implications.
Ethereum remains the DeFi and RWA backbone, sustaining structural demand.
Protocol upgrades (Pectra, Dencun) enhance scalability and adoption.
On-chain withdrawal trends show growing holder conviction.
Narrative / Bias & Strategy Implication:
ETH.D has likely completed its correction and is primed for a staged bullish reversal, mirroring prior cycles. The chart forecasts a rally toward TP1, where some short-term profit-taking and rotation to alts may occur (Alts season). Following that, a retrace may set up the next impulsive move to reclaim lost dominance and eventually challenge prior highs.
Time Horizon: Mid-2025 to late 2026

ETH 1H Analysis - Key Triggers Ahead | Day 24😃 Hey , how's it going ? Come over here — Winter got something for you!
⏰ We’re analyzing ETH on the 1-Hour timeframe.
👀 On the 1-hour timeframe for Ethereum, we can see that after testing its major buyer zone, ETH bounced and entered a consolidation phase. This sideways movement is mainly due to the weekend slowdown. I’ve highlighted the range boundaries — a breakout above or below will provide us with trading opportunities. ETH is one of the few coins that has managed to hold its ground at a solid price level, showing strong potential for further growth.
🧮 Looking at the RSI oscillator, we’ve identified two key levels 30 (oversell) & 58 (local RSI ceiling) If ETH breaks these levels, it could trigger a breakout from this tight range and start a stronger move.
🕯 Currently, the green candles are larger in size and volume, but since it’s the weekend, ETH has been mostly off traders’ watchlists. We need to wait for the new weekly open to see how market participants will react.
💸 On the ETHBTC pair (1H timeframe), we’re seeing a similar setup to ETHUSDT. A breakout above or below the current range could start the next move. Adding this pair to the watchlist can provide confirmation for Ethereum setups.
🧠 For a long position on ETH, it’s important that the coin enters a clear buying phase — similar to the strong pumps we’ve seen before. Recently, however, ETH has faced profit-taking and sharp sell-offs after rallies. The coming week will show us whether this pattern continues or a stronger bullish move emerges.
❤️ Disclaimer : This analysis is purely based on my personal opinion and I only trade if the stated triggers are activated .

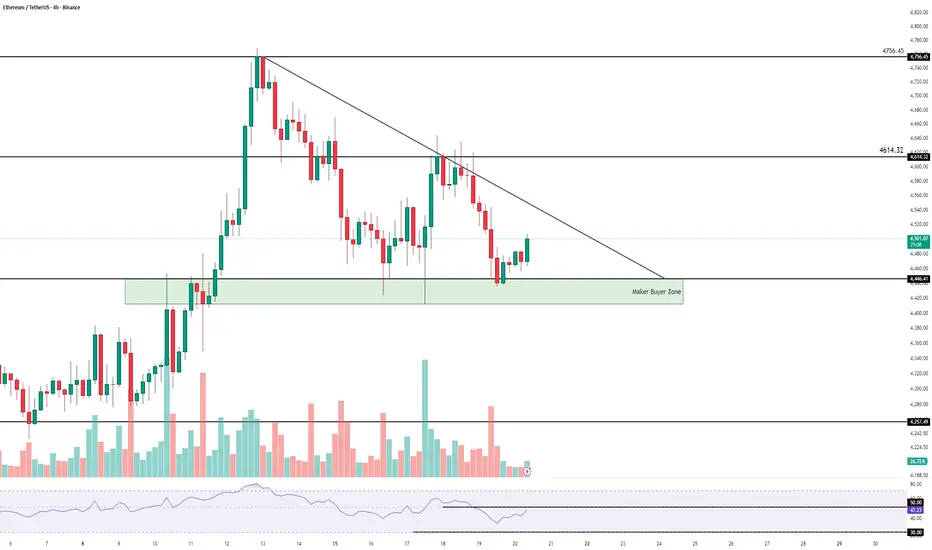
ETH 4H Analysis - Key Triggers Ahead | Day 23😃 Hey , how's it going ? Come over here — Winter got something for you!
⏰ We’re analyzing ETH on the 4-Hour timeframe.
👀 On the 4H timeframe of Ethereum, we see that after touching the maker buyer zone, ETH is bouncing upward. There’s a downtrend line ahead, and we need to watch how price reacts if it reaches that line today. The main long triggers are at 4614 and 4756 – once price breaks and holds above these levels, we can look to open a long position.
🧮 The RSI oscillator is moving up from below 50, heading toward this static resistance. If RSI crosses above 50, ETH could gain momentum to the upside and potentially break the downtrend line.
🕯 In the recent leg, the size, volume, and number of red candles increased, but once price hit the maker buyer zone, sellers were absorbed. Buyers stepped in, preventing further correction – showing strong demand for cheaper ETH. The current 4H candle also has healthy volume; if it closes strong in the next 30 minutes, ETH could push toward resistance and test it.
💸 On the 1H ETH/BTC chart, we can see price sitting at a strong resistance zone. If we get a confirmed candle close above it, ETH’s multi-timeframe trend could turn bullish again. Volatility is increasing on the 1H chart, and if the resistance level on RSI is crossed, momentum for ETH/USDT could also turn upward.
🧠 For a long position, it’s better to wait for the downtrend line to break, which gives us a higher-probability setup to follow through with a long trade.
❤️ Disclaimer : This analysis is purely based on my personal opinion and I only trade if the stated triggers are activated .
ETH 1H Analysis - Key Triggers Ahead | Day 22😃 Hey , how's it going ? Come over here — Winter got something for you!
⏰ We’re analyzing ETH on the 1-Hour timeframe.
👀 On the 1-hour chart, we can see that Ethereum lost an important support level at $4,571 and then moved downward, finding support around $4,513. Two consecutive 1-hour candles have closed above this level. Currently, price is trading between $4,513 and $4,571, and a breakout of either zone could lead Ethereum toward the next support or resistance level.
🧮 The RSI oscillator is hovering around 50–30, indicating that a breach of these levels could trigger momentum toward the target zones.
🕯 The size and volume of red candles increased as price reached $4,621 after a short range, and the market then reversed downward. A significant support level was broken, accompanied by a large red “whale” candle reflecting strong selling pressure.
Ethereum may attempt to move toward resistance next, and it’s important to monitor the type and volume of candles forming in this area.
💸 On the ETH/BTC pair, we can see that after breaking its previous low, price moved downward but then found support around 0.0384 and is now moving upward. We need to monitor how far this pair can continue, as there is a resistance level at 0.03931. A breakout above this resistance could trigger a renewed upward move.
Additionally, the pair has formed a higher low compared to its previous bottom, providing the first confirmations of a bullish trend for ETH relative to BTC. This signals a potential long opportunity on this trading pair.
🧠 It’s better to wait for a clearer structure before opening new positions.
If you want to trade sooner, a break of resistance at $4,621 could offer a long position.
Another resistance level at $4,571 can also provide a potential long entry with lower risk, though the win probability is slightly lower — consider this a riskier trigger.
❤️ Disclaimer : This analysis is purely based on my personal opinion and I only trade if the stated triggers are activated .
