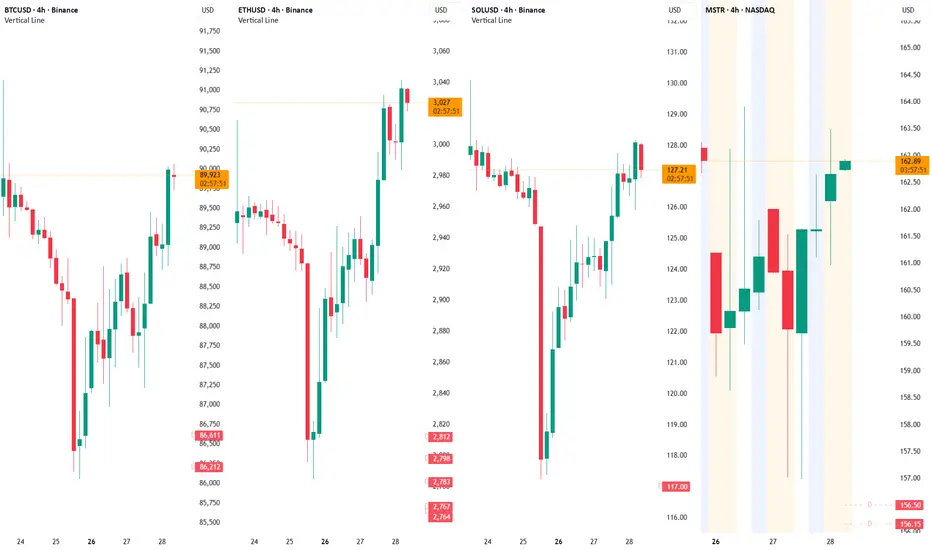
BTC ETH SOL MSRT ¡WARNING! This Could The Be The High For NowHello everyone, please give this idea a boost and follow me here on TW for my regular critical updates on Bitcoin, Ethereum, Solana, MicroStrategy, Gold & Silver based off Martin Armstrong's Socrates.
It's possible that yesterday was the closing HIGH and today the intraday high with a pullback into Thursday/Friday unless it closes above BTC@$91255 ETH@3157 SOL@132 MSTR@162 but Socrates is warning that there is no much momentum left for this pump.
Good luck! and stay safe 🙏🏻
Ethforecast
ETH Ethereum YES For a PUMP Into Early Next WeekHello everyone, please give this idea a boost and follow me here on TW for my regular critical updates on Bitcoin, Ethereum, Solana, MicroStrategy, Gold & Silver based off Martin Armstrong's Socrates.
I admit that I was getting really bored 😒 but after the GOLD explosion just moments ago and crypto waking up to PUMP, I checked the WEEKLY TIMING ARRAYS and Socrates is no longer calling for a "further decline possible" . We now have January 19th as the WEEKLY TARGET (was a LOW) with the opposite trend into February 2nd (should be a HIGH), which was my original assumption BUT the strong Sunday 25th DUMP really got me all confused. But no more! (apparently).
February 4th seems to be the LIKELY TARGETS for the next HIGH.
Remember the Playbook, as always, when price starts to cross up through the green REVERSALS you SELL 💰
Good luck! and stay safe 🙏🏻

BTC ETH SOL MSTR It Seems That We're Getting The Pump After AllHello everyone, please give this idea a boost and follow me here on TW for my regular critical updates on Bitcoin, Ethereum, Solana, MicroStrategy, Gold & Silver based off Martin Armstrong's Socrates.
It looks like we are getting the crypto PUMP after all... which correlates with Gold/Silver where the TARGET was yesterday the 26th with a pullback into end of this week. Then the markets should flip opposite.
But... markets are certainly acting a little confused though.
Good luck! and stay safe 🙏🏻
ETH Ethereum ¡ALERT! It May Be Going Straight Down From Here...Hello everyone, please give this idea a boost and follow me here on TW for my regular critical updates on Bitcoin, Ethereum, Solana, MicroStrategy, Gold & Silver based off Martin Armstrong's Socrates .
Socrates is calling for a STRONG TARGET today Monday 26th, meaning that the strong bounce that started yesterday could be a Daily ONE-OFF with a further decline starting tomorrow Tuesday 27th .
¡ALERT!: because on all 3 markets BTC ETH SOL the price penetrated the LOW of the week of January 19th then a further decline is possible into the week of February 2nd... and here's the ALERT: the week of February 2nd is SUPER STRONG meaning that it could be a STRONG LOW. I was expecting a weak bounce this week and on February 2nd the START of the collapse BUT it seems to be coming SOONER. And it makes sense correlated to Gold/Silver, which are poised to CONTINUE the RALLY into March, which means more geopolitical and market chaos, war... Japan... you name it.
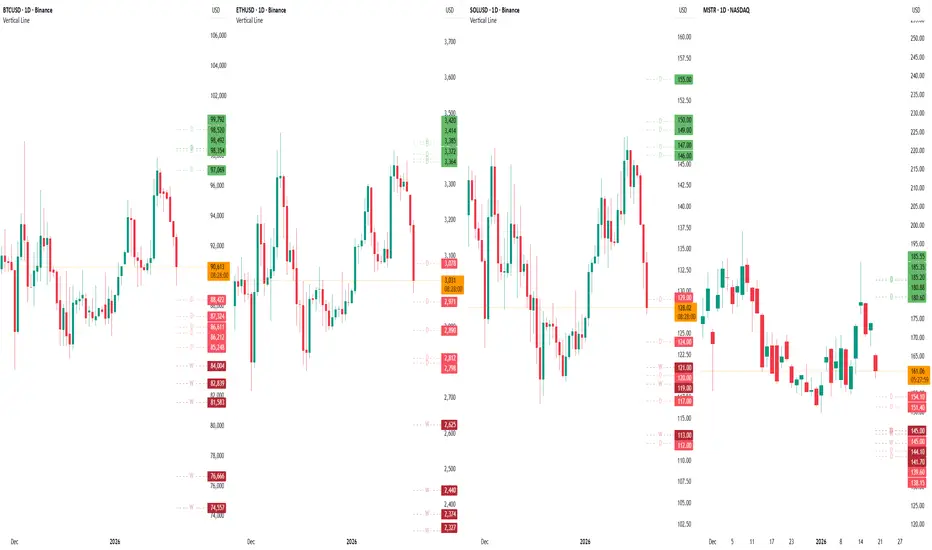
BTC Bitcoin 2026 Outlook Chart
Good luck! and stay safe 🙏🏻

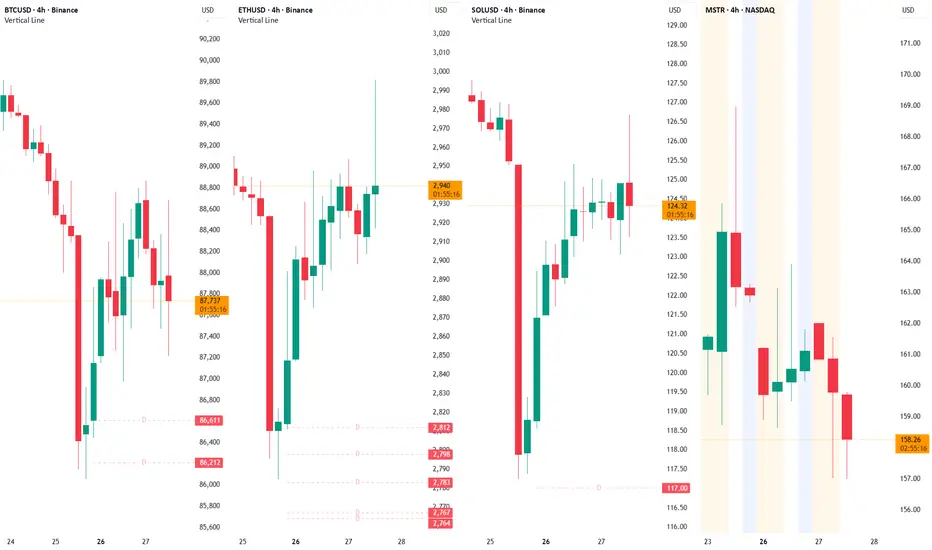
BTC ETH SOL Important Bounce Before Daily CloseHello everyone, please give this idea a boost, share and follow me here on TW for my regular critical updates on Bitcoin, Ethereum, Solana, MicroStrategy, Gold & Silver based off Martin Armstrong's Socrates.
The price bouncing off reversal levels before the Daily Close is an important signal that it could indeed be a LOW for this drop. I am NOT saying that it is, we need Socrates Analysis tomorrow morning. The gray vertical line on the chart is Socrates daily close time (6pm EST).
Furthermore, as of now, this Tuesday 27th is yet ANOTHER STRONG TARGET... and since I am expecting a massive price drop around the week of February 2nd, this pattern is telling me that we might get NO BOUNCE before the massive drop and the markets are simply consolidating sideways... we'll find out soon enough...
Previous BTC Forecast Chart
Previous ETH Forecast Chart
Previous SOL Forecast Chart
Good luck! and stay safe 🙏🏻

Ethereum ETH ¡WARNING! Possibly Yet Another LOW In PlaceHello everyone, please give this idea a boost, share and follow me here on TW for my regular critical updates on Bitcoin, Ethereum, Solana, MicroStrategy, Gold & Silver based off Martin Armstrong's Socrates .
The INITIAL LOW was January 21st but I WARNED that we had another STRONG TARGET coming up for Friday 23rd and that it could be a HIGH. The next STRONG TARGET is Monday 26th but in crypto it can many times play out on Sunday therefore, I would expect that Socrates analysis tomorrow will call the KEY TARGET was Sunday 25th BUT let's see... maybe we get yet another leg down tomorrow BUT it's always "safe" to buy/sale when multiple reversal levels are crossed as it is the case right now.
Previous BTC Forecast Chart
Previous ETH Forecast Chart
Previous SOL Forecast Chart
Good luck! and stay safe 🙏🏻

#ETH/USD Buy Trade Setup.Here’s an up-to-date ETH/USD Buy trade outlook (technical + fundamental) to help you assess whether positioning for a Upside makes sense right now.
Thank You......

ETH Ethereum ¡WARNING! LOW Confirmed On Daily... BUT...!Hello everyone, please make sure you give this idea a boost, share and follow me here on TW for my regular critical updates on Bitcoin, Ethereum, Solana & MicroStrategy based off Martin Armstrong's Socrates 💖 I really appreciate it!
As expected, the LOW was on January 20th and lower intraday on the 21st BUT, we have a very strong target tomorrow the 23rd, warning of a possible HIGH tomorrow and important VOLATILITY into next week.
As of now, the final target for a HIGH on this bounce is February 3rd.
Previous Idea on ETH
Good luck! stay safe 🙏🏻

#ETH/USD Buy Trade Scenario.Here’s an up-to-date ETH/USD Buy trade outlook (technical + fundamental) to help you assess whether positioning for a Upside makes sense right now.
Thank You......

BTC ETH SOL MSTR ¡BOOM! I Told You So, Bear Market In Full SwingHello everyone, please give this idea a boost, share and follow me here on TW for my regular critical updates on Bitcoin, Ethereum, Solana & MicroStrategy based off Martin Armstrong's Socrates 💖 I really appreciate it!
Socrates is NEVER wrong about timing. However, the exact daily HIGH/LOW always shifts a bit. That being said, I'm suspecting that today won't be the LOW. Everything is JUST STARTING to crash now and the Japanese Bond market is a MONSTER! Massive GOLD gap-open today. The crypto dump started in Asia at their pre-market open early Monday (Sunday 6pm EST) and continued at their pre-market open on Tuesday (Monday 6pm EST).
The next Daily STRONG TARGET is Thursday 22nd for all 4 markets BTC ETH SOL MSTR.
Because of the velocity of this drop today and considering that I am not expecting any important rally into early February, I will not be opening any small LONG to catch the bounce, it's way too risky. I will simply close my SHORTs in the next 48hrs and re-open them in 10 days.
Links to each Idea yesterday:
BTC ETH SOL
Good luck and stay safe!
#ETH/USD Buy Trade Scenario.Here’s an up-to-date ETH/USD Buy trade outlook (technical + fundamental) to help you assess whether positioning for a Upside makes sense right now.
Thank You......

ETH Ethereum ¡WARNING! Possible Initial Low January 20thHello everyone, please make sure you give this idea a boost, share and follow me here on TW for my regular critical updates on Bitcoin, Ethereum, Solana & MicroStrategy based off Martin Armstrong's Socrates 💖 I really appreciate it!
So far the markets are following the path that I laid out in my BTC 2026 Outlook
Today and tomorrow January 20th are strong DAILY targets that could make an INITIAL LOW followed by a recovery into the first days of February then, the bear market downtrend continues. I suspect it will be a lower-high to about $3364 but it can always attempt to swing a bit higher OR not even reach any reversal level. KEEP IN MIND that DAILY targets always tend to shift a bit +/- 1 or so.
The Trading playbook is to BUY when the green REVERSAL levels are being crossed. Keep in mind though, I am NOT expecting ANY RALLY, therefore, I will be closing my SHORTS and buying a small capital just to catch a little extra money on the swing up but it's NOT SAFE to go LONG at this point. I'm expecting to go back in all SHORT in early February or whenever the timing is ripe again.
Today I am posting for BTC and SOL (MSTR is closed for the holiday).
Good luck! and be safe 🙏🏻

#ETH/USD Buy Trade Setup.Here’s an up-to-date ETH/USD Buy trade outlook (technical + fundamental) to help you assess whether positioning for a Upside makes sense right now.
Thank You......

$ETH bullish update! (LTF)BINANCE:ETHUSDT continues to compress inside the descending trendline + rising support, holding above the key demand zone. No breakdown, no panic — just pressure building.
- Higher low already defended
- Sellers unable to push below demand
- Clear risk definition
- Upside opens up once the descending trendline is fully cleared
Entry: 3,218 – 3,254 (pullbacks into support)
SL: 3,067 (clean loss of structure)
Targets:
TP1: 3,447
TP2: 3,650

#ETH/USD Buy Trade Scenario.Here’s an up-to-date ETH/USD Buy trade outlook (technical + fundamental) to help you assess whether positioning for a Upside makes sense right now.
Thank You......

#ETH/USD Sell Trade Scenario.Here’s an up-to-date ETH/USD Sell trade outlook (technical + fundamental) to help you assess whether positioning for a Downside makes sense right now.
Thank You......

ETH/USD Sell Trade Setup.Here’s an up-to-date ETH/USD Sell trade outlook (technical + fundamental) to help you assess whether positioning for a Downside makes sense right now.
Thank You......

BTC ETH SOL MSTR ¡WARNING! High Is Likely Confirmed On DailyHi again, please check related Ideas below for more details.
Socrates Daily Timing Array shifted to Wed 14th as the KEY TARGET and a PANIC HIGH on BTC, REACTION HIGH on ETH . It's also forecasting REACTION HIGHs on Weekly and Monthly .
The TOP for this rally is probably set.
Good luck and stay safe! 🙏🏻

BTC ETH SOL MSRT ¡WARNING! Possible HighHello everyone, I won't go into any details, please see my related Idea links below if you want to read the details on each market from last Sunday.
The initial target was Monday 12th but it seemed week, so Tuesday 13th seemed stronger and it indeed played out. Socrates is still pointing to yesterday, Tuesday 13th as the key target, but today it pushed a bit higher; warning that yesterday could be the highest closing followed by a higher intraday push today and a red close or maybe just a REACTION HIGH today or maybe the final target switched to today. Anyhow, it doesn't really matter. January and this week are targets for a HIGH on this rally. Let's see if it gets confirmed in the next week or so.
We have to wait for the close of today AND tomorrow and then this week's on Friday 6pm EST to confirm that this week was indeed the high and it's all downhill from here into April/May 🪠💩🩸🐻
WW3 started a while back but we all know that it got pretty bad since the start of the year. Trump doesn't care about any consequences anymore; Russia/Iran/China are more than fed up and everyone's got their fingers on the trigger. 2026/2027 are WAR YEARS.
Good luck! stay safe 🙏🏻

#ETH/USD Buy Trade Scenario.Here’s an up-to-date ETH/USD Buy trade outlook (technical + fundamental) to help you assess whether positioning for a Upside makes sense right now.
Thank You......

Ethereum ¡WARNING! Bull-Trap Forming Week of January 12thHappy New Year! Please take a look at my related Idea below: BTC Bitcoin 2026 Outlook 🔥 for a more detailed long-term explanation.
January RALLY has so far played out as expected 🐂🎯 although it had an important pull-back the week of January 5th thus showing weakness. The strongest WEEKLY TARGET for a Turning Point is this week January 12th , more precisely around Tuesday 13th .
The trading playbook is to sell either around Tuesday 13th or as soon as price begins to cross the $3300k levels.
Keep in mind that ETH is showing a PANIC CYCLE this week of January 12th, it's a much STRONGER week than BTC, SOL & MSTR. Expect the wildest moves in this market.
We should see a resumption of the bear-market downtrend with a 3-month heavy sell-off from February into late April, early May 🩸🐻.
Today I'm posting separate Ideas for BTC, SOL & MSTR 📈 please follow me and check out my ideas.
Good luck! stay safe 🙏🏻

EthereumETHUSD
- Bullish Channel as an corrective pattern in Long Time Frame
- Sell Side Liquidity
- Completed " 12345 " Impulsive Waves and " ABC " Corrective Waves
- Fibonacci Level - 78.60%
- Demand Zone

Happy New Year, Happy New ETH???Happy New Year, Traders! I pray you all are off to a wonderful start to the new year. We've been off for the Holidays, but we're back and ready to tackle the markets again. So, what in the world is going on with ETH and BTC? Things are looking up for the start of the year, so let's dive in and see what's happening. My primary focus is always on the H4 and up for market direction and diving down to the H1 only sparingly for more detailed looks.: Please see my previous posts on ETH in Nov and Dec to see how we got here.
Where are we now?:
Well, over the Holidays, we had an H4 BOS UP. This move is very important, because it is the first Significant Move out of the Daily BOS Source. As I have emphasized, a BOS UP almost always leads to a retracement back to the source, and that is what we saw. We had the initial BOS Up on Dec 22, and came back to the source on the 24th. Then, on Jan 2 we got a confirmation of this move with the retest of the broken H4 supply zone. Once again, as I have emphasized, this confirmed BOS up will almost always lead to a target of the H4 Supply Source Or the Daily Supply. This is ~3360 - 3520. As of today, the market has pushed up 2/3 of the way to this target.
What to expect from here?:
From here, again, we are 2/3 of the way to this target area. There are a few H4 Internal Supply Zones that will likely show some resistance. We need to expect these zones to slow things down and show some pullbacks, but they WILL NOT hold. Possible trade opportunities are:
1. Look for H1 demand zones and buy on the way up. Aggressive traders can simply buy every pullback on the H1 to the previous demand zone. These trades should have small stop losses below the demand zone and targets at the new high. Every significant new high should lead to a pullback to the demand zone. Any BOS down on the H1 will most likely lead to a fall back to the previously broken H4 Supply Zone, so you want to get out if you see this, and wait for the lower re-entry.
2. On the H4, look for any of these previous supply zones that have been broken but not retested. The current H4 supply zone at 3120 - 3175 is a good example. We have pushed above this zone, but there is no retest of it. I'm looking for pullbacks back to this zone for another buy entry.
I hope this helps someone who is trying to make sense out of these seemingly wild rides since the New Year. As I have emphasized before, these type of moves have very little to do with external news events, but are solid structural moves that ANYONE can learn to "READ" on ANY ASSET. If you're struggling to decipher the markets and are seemingly always "late to the game", let us help you learn and grow!
As always, please leave me your comments, suggestions, and questions, and I'll be glad to respond. We have mostly been posting ETH moves as an example of how we read the markets, but we are trading a lot of different assets. If you have one you've been struggling with, or just a favorite that you like to trade, let me know in the comments, and I'll try to help.
Again, Happy New Year and be blessed!!!
