▒𖢻▒ ETHEREUM FORECAST | 6HR ▒𖢻▒COINBASE:ETHUSD
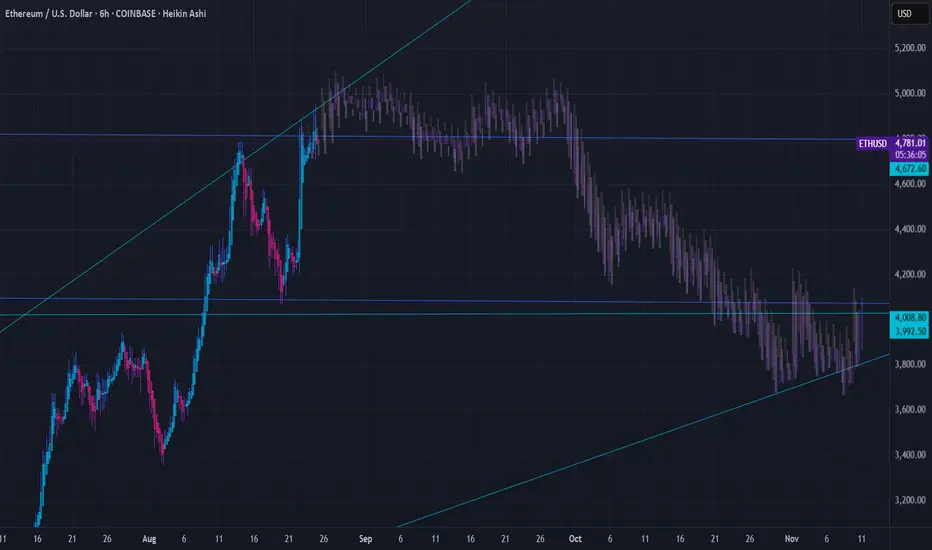
Here's my Forecast for Ethereum on the 6-hour chart. After an incredible run, ETH is now consolidating in a tight range, and the chart is giving us some very clear levels to watch.
Here's my breakdown of the current situation:
The Bullish Case (Consolidation):
ETH is currently holding strong above the key support level at $4,677. As long as we remain above this line, this sideways action looks like healthy consolidation before the next leg up.
The overall structure is still a clear uptrend, defined by the ascending trendline providing support from below.
The Bearish Case (Potential Pullback):
The price is currently below the recent High near $4,950. A failure to break this level could signal exhaustion and lead to a pullback.
The first major support to watch on any significant dip is the 0.382 Fibonacci retracement level around $4,300. This would be a logical area for buyers to step back in.
Key Levels to Watch:
Resistance: The recent high around $4,950. A clean break and hold above this level signals the next major move higher.
Immediate Support: $4,677. This is the line in the sand for the current consolidation range.
Major Support: The 0.618 Fib level and structural support at $4,000. This is the critical level that bulls absolutely must defend to maintain the larger bullish trend.
My Outlook:
For now, I'm leaning bearish on the 6HR, bullish in the immediate short-term but remaining cautious. I'm watching for a decisive break of $4,950 as confirmation for new highs. If the immediate support at $4,677 fails, I'll be looking for a potential dip-buying opportunity at $4,300.
DISCLAIMER
I AM NOT A FINACIAL ADVISOR, NOR AM I YOURS. THIS IS NOT FINANCIAL ADVICE. MEARLY DOODLINGS ON A MATHMATICALLY DRIVEN GRAPHICAL INTERFACE, TRACKING AN INVISIBLE 256BIT MILITARY-GRADE ENCRYPTED ASSET. . . FOR ENTERTAINMENT/AMUSEMENT PUROSES ONLY. ENJOY!
Ethforecast
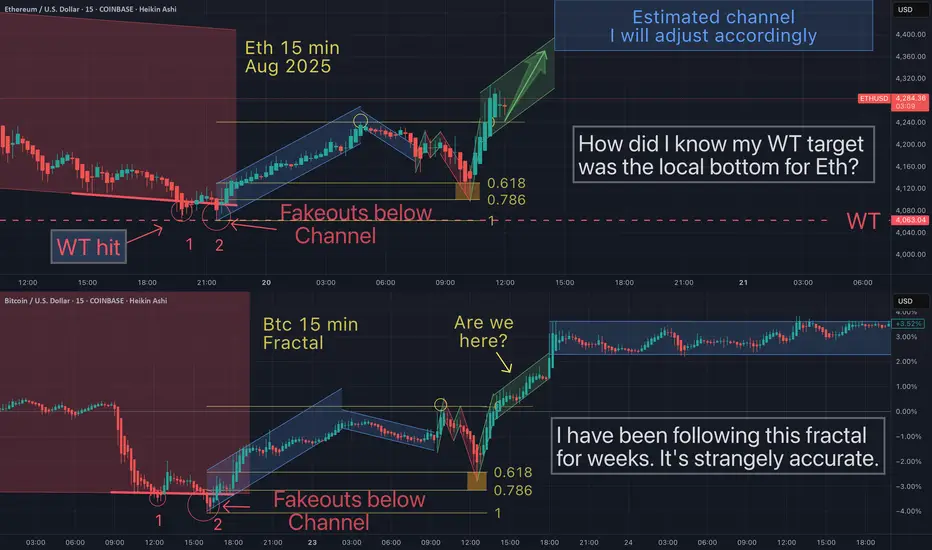
Eth- Continues to follow a strangely accurate fractal Aug 20th I suggested that Eth would enter a sideways channel. That is now confirmed. How could I have know that without a crystal ball?
Fractals are a mathematical anomaly. Price action "respects" these "trendlines" & patterns so perfecly. Yet on a graph (chart), this linear function has several veriables (y=mx+b). With this may variables in a linear equation, how do you explain fractals?
- Is human behavior just simply predictably repeating?
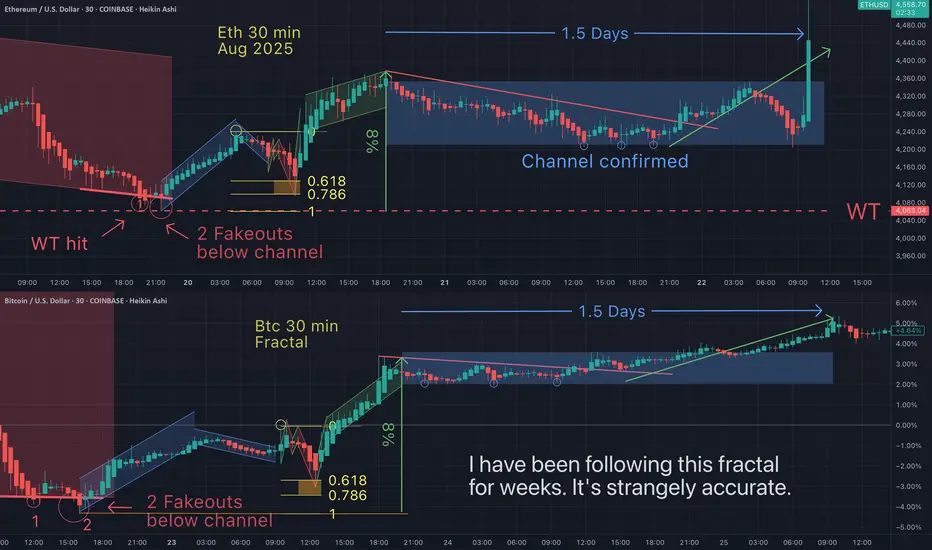

Eth has been following this exact Btc fractalIn the world of graphing (charting) and linear equations, the concept of "fractals" would be mathematically improbable. But in charting, fractals work - until they dont. Fractals usually stop working as an exact map when you LEAST expect (or want) then to.
ETHUSDTBINANCE:ETHUSDT is overall trend in the 4-hour timeframe is bullish, with strong buying momentum. The price is currently at the 4200 USD resistance, and if this level breaks, the next target will be around 4500 USD.
Supports:3950 USD, 3730 USD, 3350 USD
Resistances: 4200 USD, 4500 USD
⚠️Always apply proper risk management.

Ethereum Price Aims at $5,000 As Exchange Balance Falls To 9-YeaBINANCE:ETHUSDT is currently priced at $4,531 , positioned just above the $4,500 resistance. The broader indicators, suggest a favorable environment for a breakout. On-chain data highlights a key trend supporting Ethereum’s macro outlook.
Exchange balances have dropped to a nine-year low of 14.88 million BINANCE:ETHUSDT , signaling that investors are moving their holdings into long-term storage.
If BINANCE:ETHUSDT manages to reclaim $4,500 as support , the uptrend could accelerate. This move would help the cryptocurrency push through the next resistance at $4,749, paving the way for a test of the $5,000 mark.
However, risks remain if investor sentiment shifts suddenly. Should holders decide to secure profits, BINANCE:ETHUSDT could slide toward $4,200 or even $4,000 . Such a decline would weaken the bullish thesis, opening the door to consolidation instead of continuation of the current uptrend.

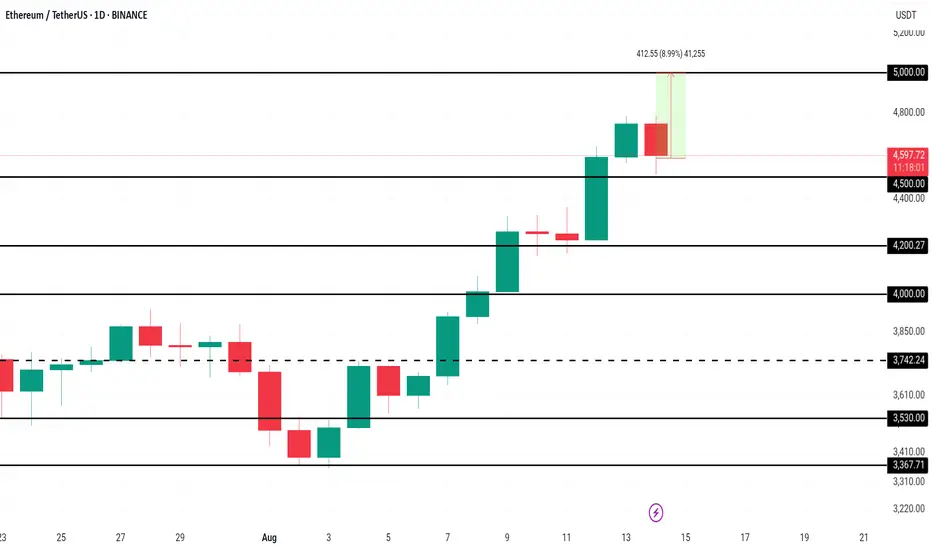
Ethereum Price Nears $5,000 After 3.5 Years; Will It Succeed?Ethereum is currently trading at $4,723, just 5.8% away from the $5,000 milestone. The asset has secured $4,500 as a solid support level, further strengthening its bullish outlook. This three-and-a-half-year high is energizing buyers, who see $5,000 as the next key target.
With robust whale accumulation, record futures interest, and positive funding rates, Ethereum’s path toward $5,000 appears intact. Once this level is breached, momentum could carry the price even higher, potentially targeting $5,500 in the following weeks.
However, the bullish scenario hinges on investor sentiment holding firm. If traders pivot to profit-taking, ETH could drop below the $4,500 support. A sustained move under this level might push prices toward $4,200, undermining the current uptrend and delaying further gains.
$4,794 Barrier in Sight: ETH’s Next Stop $5,200?ETH has been in a strong upward channel since August 6, with the price consistently respecting the rising trendline. The structure remains firmly bullish, showing a series of higher highs and higher lows. Every dip over the past week has been met with strong buying pressure, suggesting that bulls remain in control.
Currently, ETH is hovering just under the $4,794 resistance zone, which is the last major hurdle before the psychological $5,000 level. Above this, the chart shows a target zone at $5,200, which aligns with the upper projection from the recent bullish swing. On the downside, the immediate support is at $4,331, with a deeper cushion around $3,941 in case of a pullback.
The buy and sell markers on the chart show that most recent buy signals occurred during shallow retracements, while the clustered sell signals in earlier phases have been invalidated by continued upward momentum. The risk/reward setup is clearly favorable for bulls, with the stop placed well below the current price action and the profit target extending into fresh highs.
Trade Setup 📊
• Entry: $4,735.99
• Stop Loss: $4,538.41
• Take Profit: $5,200
• R:R Ratio: 2.35
• Bias: Bullish
As long as ETH holds above $4,538 and the ascending trendline remains intact, the probability favors a push through $4,794 toward $5,000 and eventually $5,200. A clean breakout with volume would confirm continuation, while a failure to hold the support could invite a short-term retracement. Booking partial gains near $5,000 and trailing stops is recommended to protect profits.

Ethereum ETH Pullback Into Support Could Lead to Another Rally📊 Taking a close look at ETH/USDT, the market has recently shown bullish intent after a break of structure on the daily 📈. From a Wyckoff perspective, price is currently reaching into a key resistance zone. Im looking for a retrace into support and, potentially forming an accumulation phase. I’ll be watching for a shakeout below support — followed by a strong rally. If this confirms with a bullish market structure break, it could offer a high-probability long setup 🔍💡🚀 (not financial advice).

Ethereum Flips MasterCard: Is $5,000 ETH Next?A new era is dawning for Ethereum, the world's second-largest cryptocurrency. In a stunning display of market strength, Ethereum has not only surpassed the market capitalization of financial giant Mastercard but is also setting its sights on the ambitious $5,000 price target. This powerful rally, which saw Ethereum gain an impressive 45% in a single month, is fueled by a potent combination of surging institutional investment, increasing regulatory clarity, and significant buying pressure from large-scale investors, colloquially known as "whales." However, this bullish narrative is not without its counterpoints, as short-term leverage risks and a sense of caution in the options market present potential hurdles on the path to new all-time highs.
A New King in the Asset Rankings: Ethereum Flips Mastercard
In a landmark moment for the cryptocurrency space, Ethereum's market capitalization soared to over $519 billion in August 2025, eclipsing that of the global payments behemoth, Mastercard. This achievement propelled Ethereum to the 22nd spot among the world's largest assets, placing it ahead of household names like Netflix, Exxon Mobil, Costco, and Johnson & Johnson. The surge was the result of a consistent upward trend, with Ethereum's price climbing nearly 7% in a single day to hit $4,300, capping a 21% rise over several weeks.
This "flippening" of a traditional financial institution has ignited fresh debate about the long-term potential of decentralized assets. The 24/7 nature of cryptocurrency markets provides a distinct advantage, allowing for continuous trading and accumulation of buying momentum, even when traditional stock markets are closed. While Bitcoin still holds a commanding lead with a market capitalization of $2.36 trillion, Ethereum's consistent gains since July 2025 have kept the conversation alive about its potential to one day challenge the top spot.
The Road to $5,000: A Rally Fueled by Whales and Regulatory Tailwinds
The drive towards the psychologically significant $5,000 mark is being underpinned by several powerful forces. A staggering 45% monthly gain has brought this target within reach, with analysts pointing to a confluence of bullish factors.
One of the primary drivers is the unprecedented level of accumulation by "whales." In a single week, these large-scale investors accumulated an astounding $946.6 million worth of Ethereum. This aggressive buying is not limited to individual investors. A mysterious institution was reported to have acquired 221,166 ETH, worth nearly $1 billion, in a single week, signaling strong long-term confidence even at elevated prices. This whale activity is significant as it reduces the available supply of ETH on exchanges, creating a supply squeeze that can amplify price movements.
Adding to this momentum is the growing clarity in the regulatory landscape, particularly in the United States. Recent developments, including the White House's new digital asset framework and a resolution in the Ripple-SEC case, have helped to remove key uncertainties that have long plagued the crypto market. This improved regulatory environment is fostering greater trust and encouraging institutional adoption. The introduction of tax-advantaged structures, such as IRS Code 351, which allows for tax-free exchanges of Ethereum for treasury shares, is further incentivizing large-scale purchases by long-term holders.
The Rise of Corporate Ethereum and ETF Inflows
A significant and growing trend is the increasing allocation of corporate treasuries to Ethereum. As of August 2025, corporate Ether holdings have surged to an impressive $13 billion, with the total amount held by companies reaching 3.04 million ETH. This rally in corporate adoption is being led by firms like BitMine Immersion Technologies, SharpLink Gaming, and The Ether Machine.
BitMine Immersion Technologies, in particular, has made headlines by becoming the first company to hold more than $3 billion in ETH, having increased its holdings by a staggering 410.68% in just 30 days to 833,100 ETH. SharpLink Gaming and The Ether Machine have also significantly boosted their ETH treasuries, with the top ten corporate holders now controlling over 2.63 million ETH, representing about 2.63% of the asset's total supply.
This corporate buying spree is mirrored by the substantial inflows into spot Ethereum Exchange-Traded Funds (ETFs). In a single day, ETH ETFs saw inflows of $533.8 million, with cumulative inflows since July 2024 topping $8.9 billion. These sustained ETF inflows, coupled with the growth of corporate reserves, are seen as a powerful combination that could position ETH to outperform and challenge the $5,000 level for the first time.
A Time to Sell? Market Cycles and Exit Strategies
While the current sentiment is overwhelmingly bullish, some analysts are sounding a note of caution, suggesting that the current rally may have an expiration date. Drawing on well-known market cycle cheat sheets, some traders are pointing to the current phase as one of "Optimism" and "Ethereum dominance," which they believe will eventually lead to a "Market Peak/Euphoria" phase.
According to one such analysis by a crypto trader, this peak could be reached by the end of October 2025, at which point the market may experience extreme overvaluation and a subsequent downturn. This perspective suggests that while there may still be room for significant upside, with short-term targets ranging from $5,800 to $6,000, a strategic exit plan is crucial. This view is not universally held, with other technical analyses projecting targets as high as $12,000 based on patterns similar to Bitcoin's 2020 rally.
The Clash of Fundamentals and Short-Term Risks
Despite the strong bullish fundamentals, there are short-term risks that could temper the rally. One of the primary concerns is the high level of leverage in the market. The all-exchange Estimated Leverage Ratio (ELR) has climbed to 0.68, approaching historical highs and signaling excessive speculative activity. While this indicates a high degree of confidence, it also increases the risk of cascading liquidations in the event of a price correction.
The Ethereum options market also reflects a degree of caution. Despite the 41% rally in a month, derivatives data shows that traders have yet to turn decisively bullish. The options delta skew, a measure of the relative demand for bullish versus bearish options, remains in neutral territory. This suggests that while professional traders are not anticipating a significant price drop, they are also not exhibiting the "euphoria" that often accompanies major market tops. This lack of euphoria in the options market could be interpreted in two ways: either as a sign of a healthy, sustainable rally or as an indication that there isn't enough conviction to push the price significantly higher in the immediate future.
Conclusion: A Bullish Trajectory Tempered by Prudence
Ethereum's recent performance has been nothing short of remarkable. The cryptocurrency has not only achieved a significant milestone by surpassing Mastercard in market capitalization but has also laid a strong foundation for a potential run to $5,000 and beyond. The confluence of strong institutional demand, growing corporate adoption, and increasing regulatory clarity paints a decidedly bullish picture for the long term.
However, the path forward is unlikely to be a straight line. The risks associated with high leverage in the short term, coupled with a sense of caution in the options market, serve as important reminders that volatility remains a key characteristic of the crypto space. While the fundamental drivers suggest that Ethereum is well-positioned for continued growth, investors and market participants would be wise to remain vigilant and mindful of the potential for pullbacks. The coming months will be crucial in determining whether Ethereum can sustain its current momentum and solidify its position not just as a leading cryptocurrency, but as a global financial asset of the future.
Eth in WYCKOFF Distribution SchematicEth is in a type 1 wyckoff distribution schematic. I am looking for a higher high in the light red supply zone before selling off in a manipulation. I’ll be buying the dip if I see proper accumulation

Ethereum (ETH) Price Hits 3.5 Year High; Nears ATH Of $4,891BINANCE:ETHUSDT is approaching a significant milestone in August, trading at $4,182, a 3.5-year high . The altcoin breached the $4,000 mark over the weekend, setting its sights on the next target of $4,891. This strong upward momentum suggests Ethereum could make history if it sustains its growth.
At $4,303, BINANCE:ETHUSDT is 17% away from its all-time high (ATH) of $4,891 . To reach this ATH, ETH must first secure $4,500 as a stable support level. A successful consolidation above this threshold could set the stage for ETH to continue its bullish ascent towards the ATH.
However, if investor sentiment shifts and selling pressure increases, BINANCE:ETHUSDT could struggle to maintain its position above $4,000 . A decline below this level would invalidate the bullish outlook, potentially reversing the recent gains and sending ETH lower.

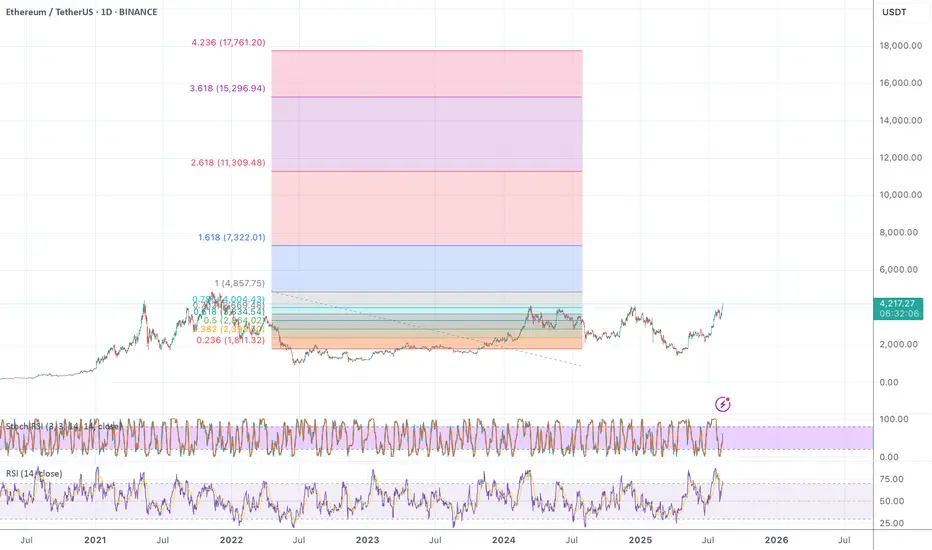
ETH to 17.000USD if it hits the 4.236 fib! Shocking! If I draw the fibbs to measure how high it can go I can't believe my eyes!!!
Firstly, we all thought it was over with ETH in the beginning of the year.
Secondly, we broke out today!!!
Off to 17k!!! Yay!
ETH ( Ethereum ) lovers looking strong for long term ETH -----Daily counts indicate Excellent bullish wave structure.
Both appear to be optimistic and this stock invalidation number (S L) wave 2 low
target short / long term are already shared as per charts
correction wave leg seems completed
Investing in declines is a smart move for short/ long-term players.
Buy in DIPS recommended
Long-term investors prepare for strong returns over the next two to five years.
one of best counter
Every graphic used to comprehend & LEARN & understand the theory of Elliot waves, Harmonic waves, Gann Theory, and Time theory
Every chart is for educational purposes.
We have no accountability for your profit or loss.

Ethereum ETH at Key Resistance: Here's My Trade PlanEthereum (ETH) has maintained a fairly bullish structure overall 🟢, but price is now trading into a significant resistance level 🧱📈. I’m closely monitoring for a reaction at this zone — ideally a rejection that leads to a pullback into a key support area 🔄📉.
If ETH finds support and we get a clean bullish break in market structure from there 📊🚀, that could present a high-probability setup to the long side — contingent on price action confirming the bias. 🔍 Not financial advice ⚠️.

ETH Targets $12,500 With Potential Ascending Triangle BreakoutThis post updates my earlier post and revises the previous prediction upwards.
Pattern
As we can see on the 3-Month ETH/USD log chart, ETH price compresses within an Ascending Triangle formed by trendlines set at the candle bodies (not wicks). The upper trendline is almost perfectly horizontal and sits at $3600. ETH is currently attempting breakout, but would need a 3-Month close (end of Q3) above the upper trendline at $3600 to confirm the new uptrend.
Target Price
As someone new to Technical Analysis, my original chart used the linear layout, which I have come to learn is less well suited for charting patterns on long timeframes. The updated chart here shows a much more reliable pattern, but also suggests a much higher, yet still conservative, price target of $12,500. I am unsure of the timeline for which ETH could achieve this price, but I assume it would occur this cycle, which is consistent with other bullish ETH predictions, such as Tom Lee's recent call for $10k - 15k.
Method
Ascending Triangles are bullish continuation patterns. The breakout price target is obtained by measuring the percentage distance from the widest part of the triangle and projecting that same percentage above the upper trendline.
Please feel free to offer your criticisms and observations. This is not financial advice.

ETHUSDT.PIf you look at the chart, you will notice an uptrend that has somewhat lost its strength and we may not be able to hit higher highs like the next strength in the next move.
Support: 3.660 - 3.590 - 3.160
Resistance: 3.900 - 4.260
Entry: 3.700
SL: 3.500
TP: 4.240
Please control risk management.⚠️

ENA / USDT#ENA / USDT
Iam expecting big returns from ETH and its related coins in this season
This chart is also looking good
Another Potential round bottom pattern under formation
Keep an eye

#ETH/USDT SETUP ,Bought From $4003#ETH
The price is moving within an ascending channel on the 1-hour frame, adhering well to it, and is on track to break it strongly upwards and retest it.
We have support from the lower boundary of the ascending channel, at 3700.
We have a downtrend on the RSI indicator that is about to break and retest, supporting the upside.
There is a major support area in green at 3711, which represents a strong basis for the upside.
Don't forget a simple thing: ease and capital.
When you reach the first target, save some money and then change your stop-loss order to an entry order.
For inquiries, please leave a comment.
We have a trend to hold above the 100 Moving Average.
Entry price: 3811.
First target: 3867.
Second target: 3936.
Third target: 4003.
Don't forget a simple thing: ease and capital.
When you reach your first target, save some money and then change your stop-loss order to an entry order.
For inquiries, please leave a comment.
Thank you.

#ETH/USDT SETUP ,Bought From $3696#ETH
The price is moving within a descending channel on the 1-hour frame, adhering well to it, and is on its way to breaking strongly upwards and retesting it.
We have support from the lower boundary of the descending channel at 3640.
We have a downtrend on the RSI indicator that is about to be broken and retested, supporting the upside.
There is a major support area in green at 3600, which represents a strong basis for the upside.
Don't forget a simple thing: ease and capital.
When you reach the first target, save some money and then change your stop-loss order to an entry order.
For inquiries, please leave a comment.
We have a trend to hold above the Moving Average 100.
Entry price: 3696.
First target: 3764.
Second target: 3826.
Third target: 3904.
Don't forget a simple thing: ease and capital.
When you reach your first target, save some money and then change your stop-loss order to an entry order.
For inquiries, please leave a comment.
Thank you.

Lets look at ETH V Bitcoin for a moment, before you jump in
Ever since Nov 2021, ETH has Lost Value compared to Bitcoin, as we can see on this ETH BTC chart.
Even while Bitcoin entered a Deep Bear market, ETH lost More....
And now, as we see ETH make a strong move, we have people screaming, "ETH to 10K"
And given how ETH is backed by almost everything American, as America wants ETH as its own Crypto.
Nut lets look here at simple idea.
ETH is up agains Stiff long Term resistance right now.
If we look at the daily chart.
We can already see how PA has been bumped down...an is trying again, even with a daily MACD turning Bearish
The weekly MACD has room to go higher and so I do expect PA to break over resistance and to nreak higher should sentiment remain strong.
As ever, this relies HEAVILY on BTC Dominance and Bitcoin PA to play along.
For me, I am not touching it, even if I can make money on it..
Principles

ETH (5 year of accumulation!)ETH / USDT
📌 Background: i shared an analysis about ETH/BTC chart and i predicted the ultimate bottom, from which ETH/BTC pumped 52% and ETH/USDT pumped 97% in few days !
you can check previous analysis: click here
📌 Today we have different chart against stable coin … Ethereum is being accumulated since 5 years in mega accumulation range with 2 major stop-loss hunt (long and short)
📌 What IF ?
What if ETH made a breakout throughout this accumulation ? i think we can see scenario like that in the green candles in my chart
DO YOU AGREE ?

ETH-----Buy around 3600, target 3660 areaTechnical analysis of ETH contract on July 18:
Today, the large-cycle daily level closed with a small positive line yesterday, the K-line pattern continued to rise, the price was above the moving average, and the attached indicator was running in a golden cross. The general trend of rising is still relatively obvious. Recently, you can see that Ethereum is stronger than the big cake, and the continuous high-breaking prices are getting closer and closer to the previous historical highs. So this month there is a chance to touch or test; the short-cycle hourly chart rose strongly in the morning and broke the previous day's high position. The current price is above the moving average, and the attached indicator is running in a golden cross. The intraday and European sessions still depend on the trend of continuing to break high.
Today's ETH short-term contract trading strategy:
Buy in the 3600 area, stop loss in the 3570 area, and target the 3660 area;
