BTC/USDT — Volume Confirmation Points Toward UptrendBitcoin has reclaimed strength within the low time frame zone, while also showing rising volume activity — a key technical signal that supports the early stage of a potential uptrend continuation.
BTC volume has been increasing since the last 7H step by step.
Currently, BTC is stabilizing between $111K and $113.6K, forming a supportive base within this range. The volume range just above acts as a confirmation layer — once price holds above this level with consistent demand, the uptrend momentum could accelerate.
📊 Technical Highlights:
Low Time Frame Support: $111K–$113.6K
Volume Zone: $116.6K area and important confirmation zone.
Main Resistance / Target: $118-120K
A sustained move above the volume zone ($116K) would be the main confirmation that BTC’s next leg toward $126K is underway.
📈 Bias: Bullish continuation forming
🎯 Key levels: $113.6K → $116K → up 118K
Ethlong

ETH : BUY OR SELL ?Hello friends
Given the good decline we had, there was a good opportunity to buy at good prices with capital and risk management and in steps and move towards the specified goals.
*Trade safely with us*

ETH Bulls Defending $4000. Can They Spark the Next Rally?After breaking out from a major resistance, BINANCE:ETHUSDT delivered a clean and healthy retest, just as expected. The bounce from that level showed strong buyer confidence, confirming that bulls are still in control.
Currently, Ethereum is holding a crucial support zone around the $4000 range. This level will play a key role in determining the next big move. If CRYPTOCAP:ETH manages to sustain and bounce from here, we could see the price rallying towards the $7000–$8000 zone in the coming weeks.
However, traders should stay cautious, a drop below $3500 could signal further downside and a deeper correction. As always, risk management is key in every setup.
Watch the $4000 zone closely, the next CITYINDEX:ETHUSD wave could be massive!
Follow Our Tradingview Account for More Technical Analysis Updates, | Like, Share and Comment Your thoughts
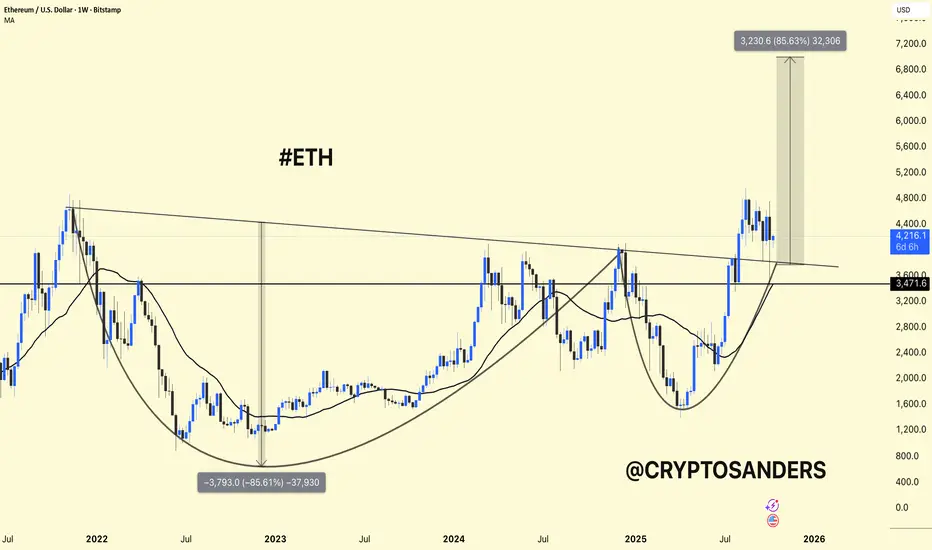
ETH/USDT Weekly Chart Analysis !!ETH/USDT Weekly Chart Analysis.
Structure: The chart shows a large cup-and-handle pattern – a classic bullish formation that signals a long-term trend reversal.
Current Price: Around $4,150, trading above the $3,470-$3,600 support area, which was the previous breakout area.
Moving Average (MA): ETH remains above the weekly MA (~$3,460) – confirming bullish momentum.
Breakout Area: The key downtrend line of 2022 has already been broken to the upside, showing strength.
Upside Target: If ETH maintains a price above $3,600, a potential upside move towards $7,000-$7,200 (≈ approximately +85%) is possible, as shown in the chart.
ETH is consolidating after its breakout, remaining stable above its support level.
Holding $3,600 → Bullish momentum likely to continue.
Loss of $3,400 → Could trigger a deeper decline towards $3,000.
DYOR | NFA
ETH 2025 Price TargetBased on the chart structure and historical behavior, if we continue to move within a within a narrowing triangle, a strong breakout toward the 6K level seems very likely. You could even say it’s almost inevitable, but only if the Fed doesn’t inject new negative catalysts and capital doesn’t start exiting positions. Thanks to institutional investors steady accumulation, the 6K target remains highly probable.
Not financial advice.

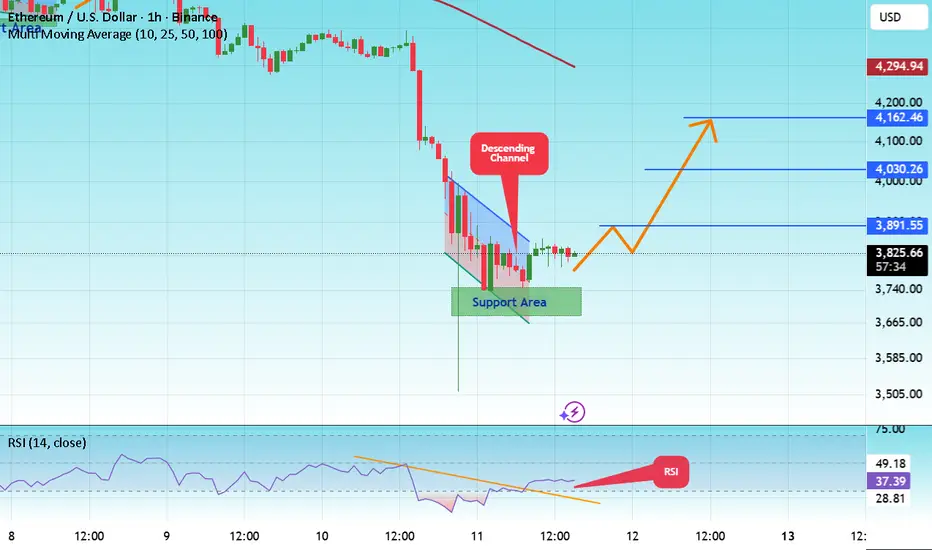
#ETH/USDT forms bullish patterns#ETH
The price is moving in a descending channel on the 1-hour frame and is expected to break and continue upward.
We have a trend to stabilize above the 100 moving average once again.
We have a downtrend on the RSI indicator that supports the upward move with a breakout.
We have a major support area in green that pushed the price higher at 3700.
Entry price: 3817.
First target: 3890.
Second target: 4030.
Third target: 4162.
To manage risk, don't forget stop loss and capital management.
When you reach the first target, save some profits and then change your stop order to an entry order.
For inquiries, please comment.
Thank you.
3 Altcoins That Could Hit All-Time Highs In The Second Week Of OEthereum is currently trading at $4,143, hovering just below the key $4,222 resistance level and awaiting a decisive breakout. The altcoin king rebounded strongly from $3,742, marking a 10% surge in the past 24 hours and signaling renewed investor confidence across the broader crypto market.
The Ichimoku Cloud indicator points to short-term bullish momentum for Ethereum. If ETH successfully flips $4,222 into support, the price could rally toward $4,500. Securing this level would further set the stage for Ethereum to test the next resistance at $4,956, reinforcing its upward trajectory.
However, if bullish conditions weaken or ETH fails to breach the $4,222 barrier, a reversal could occur. Ethereum might fall to $4,000 or even lower, erasing recent gains and invalidating the bullish outlook as selling pressure intensifies.

Ethereum Swing Trade Analysis - ETH LONGEthereum Swing Trade Analysis
Following a clear rejection at a supply zone after filling a daily imbalance (FVG), price action has shown notable structural changes. Specifically, we observed a break of structure on the 4-hour chart, which appears to be a direct reaction to the mitigation of this imbalance.
Additionally, a series of down-close candles on the H4 timeframe indicate potential bullish absorption, often suggestive of a reversal in momentum. This confluence, along with the recent fill of the daily fair value gap, suggests that price has likely found support at this key level.
Given these technical signals : rejection at resistance, structural break, and supportive price behavior around the filled FVG.
I am considering to enter a swing long position after filling M15 FVG imbalance.
The target for this trade is the equal highs on the buy-side liquidity around the $4,385 level.
Will be updating the course of this trade in the following days until it reaches final take profit target.
Talk to you soon !

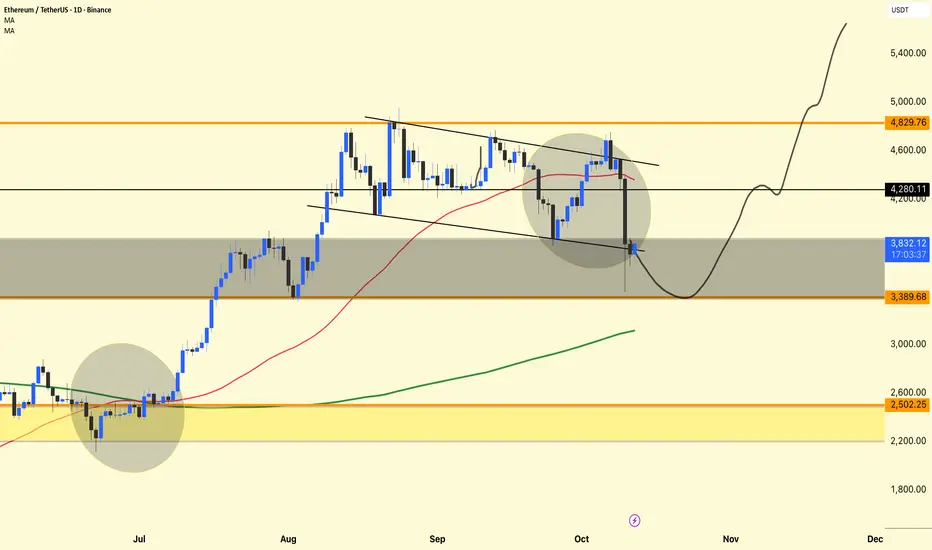
Ethereum (ETH/USDT) – Daily Chart Analysis !!!Ethereum (ETH/USDT)
Ethereum is moving at a similar pace to Bitcoin – showing heavy volatility and liquidation pressure, but there are also signs of accumulation near strong support.
The chart shows a return to a key demand zone after a breakout failure from a descending wedge, followed by the formation of a potential reversal structure.
Descending Channel and Breakdown
ETH had been moving within a descending channel for several weeks.
Recently, it attempted a breakout, but sellers regained control, resulting in a false breakout and a retest rejection.
The candle's sharp decline through the red moving average (around $4,300) indicates that bulls were heavily liquidated.
However, the price saw buying interest around the $3,800–$3,400 area, which aligns with the chart's gray support area.
Moving Average Insights
Red MA (50-day): Currently acting as dynamic resistance; ETH needs a clear close above it to confirm a short-term bullish recovery.
Green MA (200-day): Still trending upwards, indicating that the long-term structure remains bullish despite near-term weakness.
If the price stabilizes above the 200-day MA, it will likely attract medium-term investors.
Current Price Activity
At $3,836, ETH is testing the lower boundary of the support zone.
The chart projection (curved black line) suggests:
A possible short-term retest towards $3,380,
Followed by a gradual recovery towards $4,200,
And then a potential continuation towards $4,800+ if momentum strengthens.
This pattern resembles a "spring" setup—a common accumulation behavior before a major reversal.
DYOR | NFA
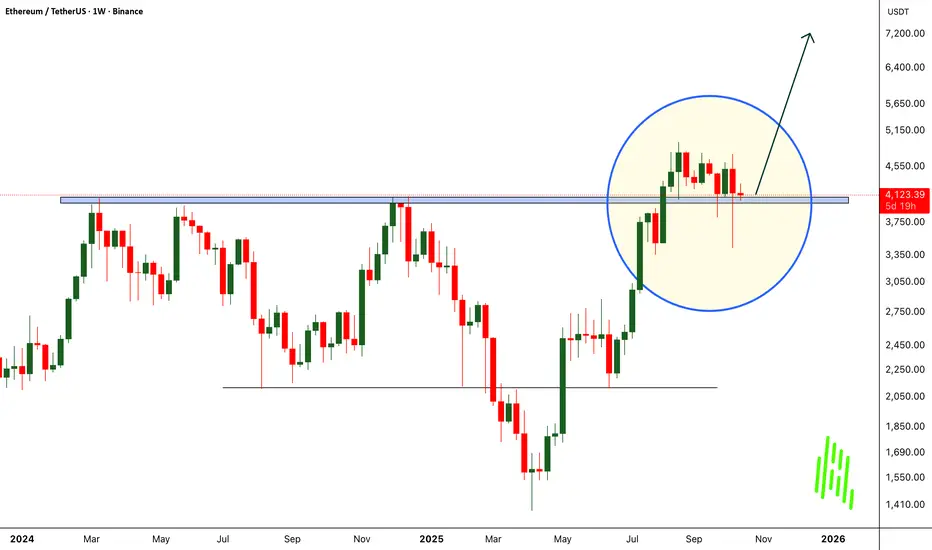
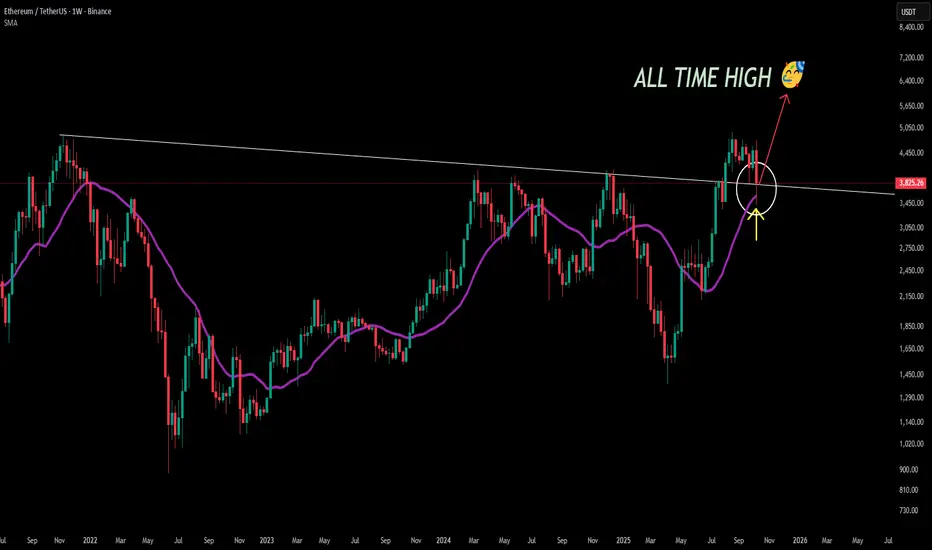
ETH might make a new all time highFrom the current weekly structure, Ethereum (ETH) appears to have completed its corrective phase. Yesterday’s move shows a clean retest of both the 20-period SMA and the long-term descending trendline, confirming this area as a strong confluence zone of support.
This reaction signals a potential reversal point where buyers may regain control. Given this setup, my bias turns bullish — I believe ETH has likely finished its downside correction and could be setting up for a major upward leg.
📈 Outlook: Over the coming months, I expect Ethereum to build momentum and potentially print a new all-time high if market conditions remain supportive.
Still, markets are inherently unpredictable — this remains my personal technical view, not financial advice.
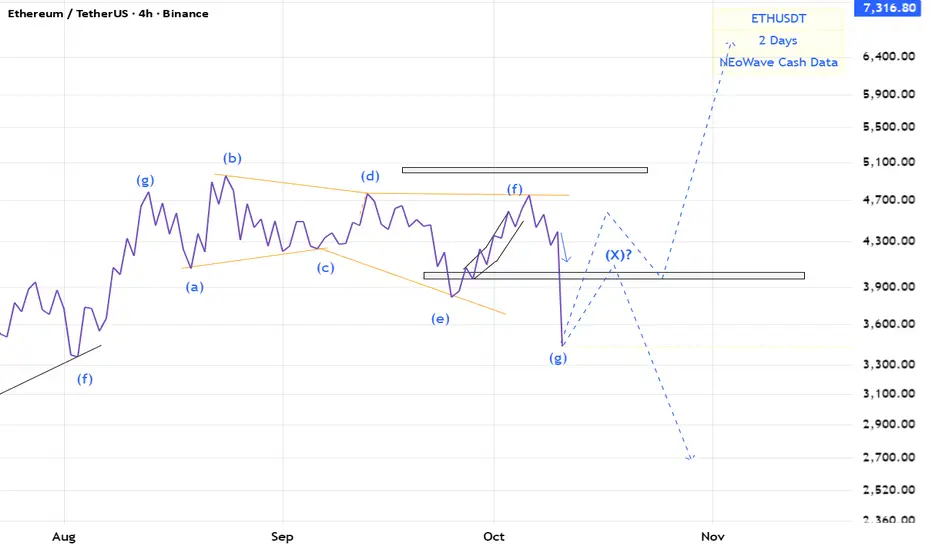
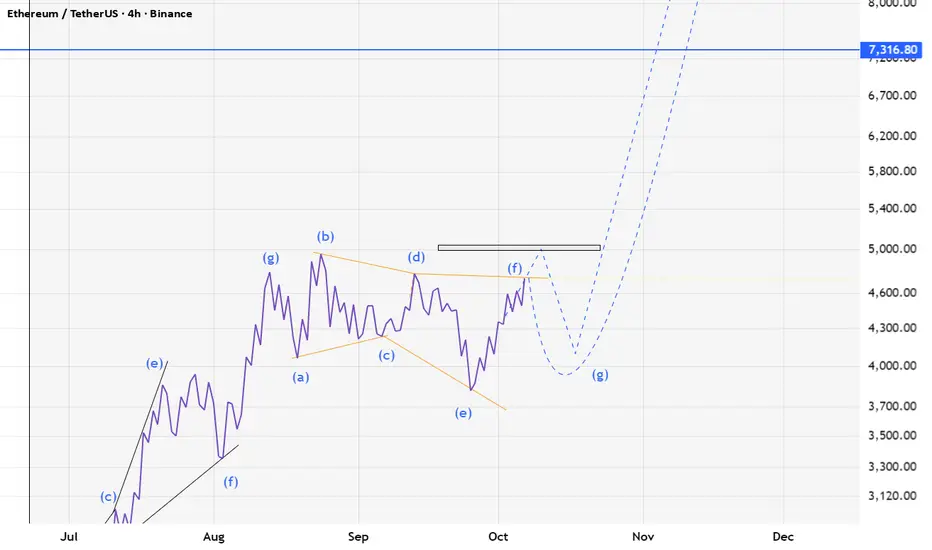
ETH(based on NEo wave)stop loss touched and now there are 2 ways for eth.
we need a post pattern confirmation for bullish wave.
or there is an x wave an correction stills go on.
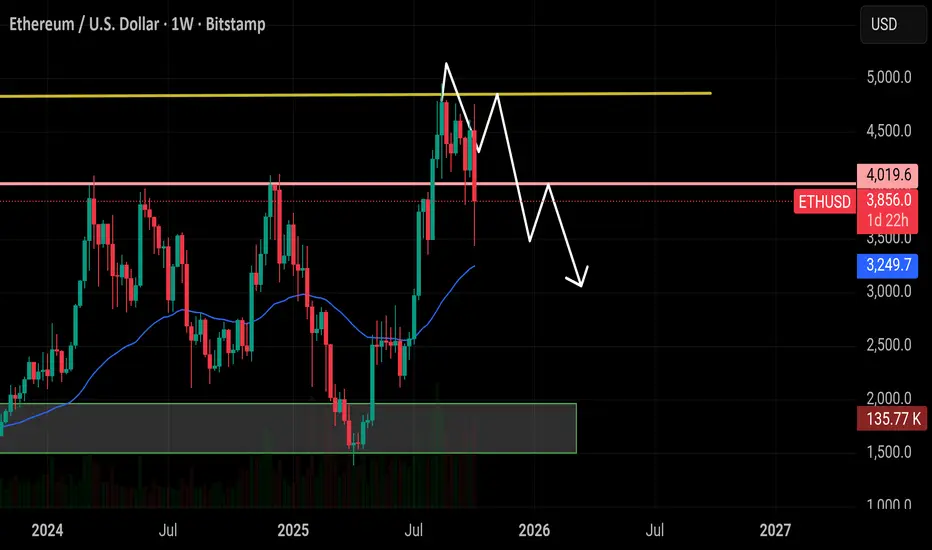
$ETH hit our first target at $3,500 exactly as expected.CRYPTOCAP:ETH hit our first target at $3,500 exactly as expected. As mentioned, a short bounce from that zone played out with an $800 move, pushing the price above $4,300. Now ETH is trading around $3,800. For a sustained upside, it needs to reclaim $4,000 as support. I’m still holding my short setup if $4,000 isn’t regained, the next downside targets remain $3,500 and $3,000.
Only your like motivate me
$ETH Performing Ascending Channel
An ascending channel, or rising channel, is a chart pattern used in technical analysis to identify a security's ongoing uptrend. It is characterized by the price fluctuating between two parallel, upward-sloping trendlines.
Key components
Higher highs and higher lows:
The price consistently makes higher swing highs and higher swing lows over a period of time, indicating steady bullish momentum.
Parallel trendlines:
Two parallel lines are drawn to frame the price action.
Upper line (resistance):
Connects the higher swing highs. It represents the point where selling pressure is strong enough to temporarily stop the price from rising.
Lower line (support):
Connects the higher swing lows. This line indicates where buying pressure is strong enough to prevent the price from falling further.

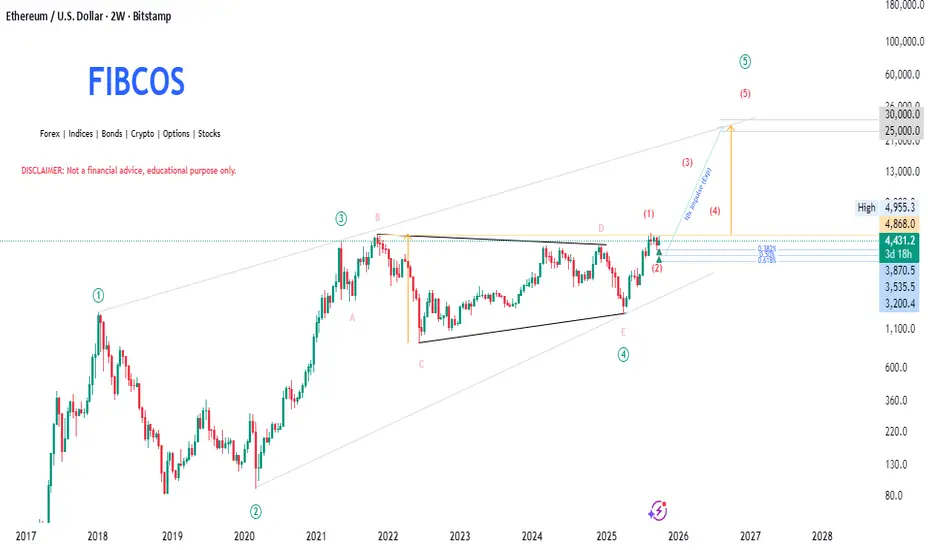
Ethereum(ETH) - Macro Outlook by FIBCOS🔍 Ethereum - Macro Outlook by FIBCOS 🧠
“From Contraction to Expansion – The Supercycle Awakens”
🌌 Super Market Cycle: The Final Push Begins
Ethereum is in the final stage of a Grand Supercycle 🌍 — a massive multi-year wave count aligning with the Elliott Wave Theory .
✅ Wave (1) and (2) established early strength
✅ Wave (3) peaked explosively in 2021 📈
✅ Wave (4) formed a beautiful contracting triangle (ABCDE) , a classic wave 4 corrective pattern
🟢 Now breaking out of Wave (4), we're entering Wave (5) — the euphoric leg 🚀
🌊 Wave Theory Magic: Riding the Impulse
We're deep into the impulsive sequence — and here's what stands out:
1️⃣ Wave (1) initiated the reversal from the triangle bottom
2️⃣ Wave (2) retraced perfectly to key Fib levels — golden pocket zone ✨
3️⃣ Current move is Wave (3) of (5) — historically the most powerful and extended wave 💥
🔮 Wave (5) targets extend toward $25,000–$30,000 based on Fibonacci projections 🧭
📐 Fibonacci Retracement & Extension: Precision Tools
After Wave (1), ETH retraced to the following golden zones:
🔵 0.382 – $3,870
🟣 0.50 – $3,535
🟢 0.618 – $3,200
These levels acted as strong demand zones 🛡️, where price was absorbed and reversed, showing institutional interest.
📈 For extensions:
Wave (3) targets: ~$15,000 (1.618 extension)
Wave (5) projection: $25K–$30K 🎯
🧠 Smart Money Concept (SMC): Liquidity Engineered Setup
SMC confirms the big players have already positioned:
🪤 ABCDE triangle = liquidity trap
🔥 Wave E = final sweep before the breakout
✅ Structure Break = Smart Money entry signal
🧱 Demand Zone @ ~$3,800–$4,200 = institutional orders filling 🏦
The Change of Character (ChoCH) + Break of Structure (BoS) = textbook confirmation of bullish intent 📚
🧱 Market Structure: From Consolidation to Expansion
We’ve broken multi-year resistance 💥
🔁 Previous All-Time High (ATH) now acting as strong support
📈 Higher highs and higher lows = full bullish market structure
🚀 Confirmed trend shift after accumulation → expansion phase
🔎 Price Action: Clean, Convincing, Bullish
The breakout candle is powerful:
✅ Big-bodied green candles
✅ Little-to-no upper wick = aggressive buyers in control 🐂
✅ Imbalance created below — potential “buy-the-dip” zones between $3,800–$4,200 📉🛒
ETH is now printing strength with every candle — the market is speaking clearly.
🌍 Macro-Fundamental Context – Ethereum’s Underlying Strengths
Ethereum’s fundamentals provide strong structural support for this technical forecast:
ETH ETF Approvals (Pending):
U.S. and global ETF prospects are building momentum, opening gates to institutional inflows akin to Bitcoin's ETF impact.
Layer-2 Scaling Adoption:
Networks like Arbitrum, Optimism, and zkSync are maturing rapidly, improving transaction efficiency and reducing on-chain congestion.
Ethereum 2.0 Transition/PoS Era:
Ongoing deflationary tokenomics (EIP-1559 burn + staking lock-up) are reducing effective circulating supply, supporting price growth.
DeFi Revival:
With macro liquidity cycles turning upward, usage and TVL (Total Value Locked) in Ethereum-based DeFi is expected to rise sharply.
AI x Blockchain Synergy:
Ethereum remains positioned to become the base layer for decentralized AI infrastructure — a potential catalyst for long-term valuation expansion.
These catalysts serve as the fundamental “fuel” behind the unfolding Wave (3) and the eventual Wave (5) .
🎯 Final Word: All Systems GO 🚀
The confluence is undeniable:
✅ Super Cycle 🔁
✅ Elliott Wave 📊
✅ SMC Smart Money 📈
✅ Price Action 🔍
✅ Market Structure 🏗️
✅ Fibonacci Levels 📏
✅ Fundamentals 🌍
💡 Ethereum is positioned to explode into its Wave (5) super-cycle with $30,000 as a potential macro target.
If you're looking for the high time frame narrative , this is as strong as it gets . Don’t chase. Plan the entry on retracements and ride the wave 🌊.
💬 "Structure unlocks direction, and Fibonacci refines destination." – FIBCOS
📘 Disclaimer: This is a structural, educational market outlook. Not financial advice. Please do your own due diligence and risk management.
#FIBCOS #ElliottWave #SmartMoneyConcept #MarketAnalysis #Gold #XAUUSD #ElliottWave #WaveTheory #SuperCycle #MacroTrend #SmartMoney #Fibonacci #PriceAction #Commodities #TechnicalAnalysis #LongTermOutlook
ETHUSD – 1H | Bullish Reversal from Demand ZoneBITSTAMP:ETHUSD
Structure | Trend | Key Reaction Zones
Market retested the 4,440–4,465 strong demand zone, respecting structure after a deep liquidity sweep.
Overall structure remains bullish, with previous accumulation and breakout zones aligning with channel support.
Market Overview
ETH completed a sharp correction after facing rejection near 4,758 resistance, tapping into the demand base where buyers previously stepped in. With liquidity cleared and demand reaction visible, a bullish continuation is likely if price holds above 4,465.
Key Scenarios
✅ Bullish Case 🚀 →
🎯 Target 1: 4,535
🎯 Target 2: 4,621
🎯 Target 3: 4,672 (major resistance retest)
❌ Bearish Case 📉 →
Invalidation below 4,413 (break of demand zone).
Current Levels to Watch
Resistance 🔴: 4,621 / 4,672
Support 🟢: 4,465 / 4,413
⚠️ Disclaimer: This analysis is for educational purposes only. Not financial advice.

HERE ARE THE NEXT TARGETS OF BITCOIN AND ETHEREUM (warning) Yello Paradisers! Enjoy the video!
And Paradisers! Keep in mind to trade only with a proper professional trading strategy. Wait for confirmations. Play with tactics. This is the only way you can be long-term profitable.
Remember, don’t trade without confirmations. Wait for them before creating a trade. Be disciplined, patient, and emotionally controlled. Only trade the highest probability setups with the greatest risk to reward ratio. This will ensure that you become a long-term profitable professional trader.
Don't be a gambler. Don't try to get rich quick. Make sure that your trading is professionally based on proper strategies and trade tactics.

ETHUSD Bullish Trend Potential | Break and Retest Trade Plan📹 In this video, we take a closer look at Ethereum (ETH), which has been in a strong bullish trend on the higher time frames 🔥. Recently, ETH has seen a deep pullback, offering potential opportunities if price action confirms a bullish break of market structure on the 30-minute timeframe ⏱️.
💡 I’m watching for a break and retest of the existing range low support, which could signal a continuation of the broader uptrend.
📊 In the video, we cover price action, market structure, trend analysis, and share a trade idea based on these factors 🎯.
⚠️ Disclaimer: This content is for educational purposes only and not financial advice.

#ETH/USDT looking extremely bullish#ETH
The price is moving within a descending channel on the 1-hour frame, adhering well to it, and is heading for a strong breakout and retest.
We have a bearish trend on the RSI indicator that is about to be broken and retested, which supports the upward move.
There is a major support area in green at 4400, which represents a strong support point.
We are heading for consolidation above the 100 moving average.
Entry price: 4455
First target: 4512
Second target: 4573
Third target: 4650
Don't forget a simple matter: capital management.
When you reach the first target, save some money and then change your stop-loss order to an entry order.
For inquiries, please leave a comment.
Thank you.

$ETH hit the $4,750 resistance again, just like I said before. CRYPTOCAP:ETH hit the $4,750 resistance again, just like I said before. It went below $4,000 for a short time but closed the week back above it. Now the price is falling again. If it breaks below $4,000, the next targets are $3,500 and $3,000.

ETH - LONG SET-UPBINANCE:ETHUSDT
ETH Long Set-up
1️⃣Entry Between 4430-4500
SL below 4325
2️⃣ Entry Between 4200-50
SL Below 4100
Margin & Leverage as per your risk capacity

ETH(based on NEo wave)soon eth will start a temporary correction and goes for higher bullish waves.
it is the last chance to buy it.
Stop loss is 3800.
Continuation of the previous idea based on the Harmonious EnergyThe consolidation phase is coming to an end. The market structure is gradually moving into the next stage of the energy cycle, where a new flow direction is forming.
At the moment, I am observing a continuation of the energy movement with a noticeable manifestation of buyer strength. The key focus is on price behaviour near the resistance level — this is where it will become clear whether buyers will be able to maintain control and continue the upward momentum, or whether the market will enter a redistribution phase.
According to the GPE concept, this moment reflects the transition from balance to energy release — when the accumulated potential turns into real movement.
📌 Observation: price reaction to resistance and confirmation of the flow's strength.
💬 If you have any questions or would like to discuss the idea in more detail, I am always open to dialogue.

#ETH/USDT LONG CHART ANALIYSIS !!🔹 Ethereum (ETH/USDT) Analysis
Ethereum has shown a strong recovery from the $3,800 support zone, bouncing sharply and now trading above the 50-day moving average (50MA) — a key bullish sign.
You can see from the chart that ETH has broken out of the descending wedge pattern that had been forming for weeks. This breakout, along with the reclaim of the 50MA, indicates a shift in momentum from bearish to bullish.
Additionally, price is currently sitting above the Ichimoku Cloud, which further strengthens the bullish bias. When ETH is trading above both the 50MA and Ichimoku Cloud, it often signals the start of a potential trend continuation move.
Bullish Structure – ETH has consistently made higher lows since hitting $3,800.
MA Confirmation – The move above the 50MA suggests renewed buyer strength.
Ichimoku Cloud Breakout – Indicates improving sentiment and trend reversal.
Volume Support – The recovery was backed by healthy buying volume.
Key Levels to Watch:
Support: $4,270 – $4,300 zone (previous resistance now support)
Resistance: $4,800 – $4,850 zone (next major target area)
Invalidation: Below $4,200 (would weaken bullish momentum)
If ETH holds above $4,270 and consolidates, we could see a continuation toward the $4,800–$5,000 range in the coming sessions.
