BMNR may Open BIG on Monday..BMNR is the largest holder of Ethereum in the world. If you look at ethereum right now, it's heading towards making a new all time high. Obviously, the price of this stock is tied to the price of ethereum. Trading is closed right now for the weekend. If ethereum continus to trend up, this stock will explode on monday opening, with realistic targets as high as $150. The stock can go much higher than that, even up to $800 or more.
Keep an eye on this. Not investment advice.
Ethlong

Ethereum - What's Next?📢 NFX Market Update – COINBASE:ETHUSD
Similar to COINBASE:BTCUSD , BINANCE:ETHUSD faced strong resistance at $4,785 - no surprise, given the historical weight of that zone. Price has since retreated to retest the previous breakout level, which is now likely to act as support if rejection holds.
This zone also aligns with a block order level, previously marked by multiple rejections before the eventual breakout. While I expect support to hold, there is a chance of a deeper test toward the 200-day SMA before continuation.
Overall, the chart structure remains bullish, and fundamentals are also strongly supportive. With key news and macroeconomic data scheduled mid-week, I remain bullish on COINBASE:ETHUSD heading forward.

$8 Billion ETH Maturing May Push Ethereum Price to New HeightsEthereum is currently trading at $4,495, just below the $4,500 support line. If the decline extends, ETH may slip toward $4,307, but deeper losses appear less likely given the strong investor positioning.
The maturing supply and bullish long-term outlook indicate that Ethereum could soon reverse course. With fewer coins entering circulation, the altcoin has structural support for renewed upward momentum despite short-term volatility.
If Ethereum reclaims $4,500 as support, the path to $4,775 opens. A move past this level would invalidate the bearish thesis, reinforcing confidence that ETH could continue its climb toward new highs

ETH Accumulates for Uptrend Above 5000ETH Technical Analysis
1. Current Market Structure
• ETH is consolidating within a symmetrical triangle pattern.
• The price is trading around 4,487, holding above the moving averages but facing strong resistance ahead.
2. Key Resistance Levels
• 4,573 – 4,653 (Fib 0.618 – 0.786 zone): A critical resistance area where sellers may emerge.
• 4,754: Strong resistance level and neckline of the triangle.
• 5,040: Major target if the price breaks above the 4,754 resistance, aligning with the 1.618 Fib extension.
3. Key Support Levels
• 4,295 – 4,310 zone: Strong demand area and lower triangle support.
• A breakdown below this level could trigger deeper corrections.
4. Price Outlook
• Scenario 1: ETH may retest the 4,295 support zone before bouncing back towards the upper resistance at 4,754.
• Scenario 2: A confirmed breakout above 4,754 could accelerate bullish momentum towards 5,040.
👉 Conclusion: ETH remains bullish as long as it holds above the 4,295 support. Watch for a breakout at 4,754 to confirm continuation towards 5,040.

Bitcoin, Ethereum Breakout: 401(k) funds & the next "Altseason"Bitcoin is up 10% in August, driven by strong ETF inflows and a game-changing executive order allowing 401(k) retirement funds to invest in cryptocurrencies, potentially bringing trillions of dollars into the sector.
Technically, Bitcoin and Ethereum are breaking out toward multi-year highs, with BTC leading and ETH close behind—setting the stage for a possible "altseason" if these levels hold and capital rotates into altcoins.
This content is not directed to residents of the EU or UK. Any opinions, news, research, analyses, prices or other information contained on this website is provided as general market commentary and does not constitute investment advice. ThinkMarkets will not accept liability for any loss or damage including, without limitation, to any loss of profit which may arise directly or indirectly from use of or reliance on such information.

THIS IS WHAT I DID TODAY WITH ETH Opened a long position in ETH at 4,468 with a 2% stop around 4,378 and a 4% take profit target near 4,648, yielding a 2:1 risk-reward ratio. Entry is based on a bullish divergence pattern at the lower boundary of the range, further supported by a retracement to the 38.2% Fibonacci level of the last bullish impulse.
PD:Monitoring tomorrow’s news.

The Fed Meeting and Its Further Play in EthereumCRYPTOCAP:ETH has returned to the trendline. Even if there another short-term drop, thats just part of the futures game - it can't happen without it.
Ahead of the Fed meeting, the market will likely move upward, so that no one can buy cheap after a positive decision on lowering the key rate.
Looking at the recent candles, enough longs have been closed to allow growth without abuse.
Funding across all exchanges has stabilized.
CRYPTOCAP:ETH outflows are starting to exceed inflows.
There nothing to look for down below - everything points to growth.
If it’s not too much trouble, support the post. Wishing you all the best!

Ethereum $ETH daily demand playing out well. Breakout happenedEthereum CRYPTOCAP:ETH daily demand at $4,336 is playing out well. Breakout happened as expected and mentioned in the last update. Long positions should be managed on this major cruptocurrency.

ETHUSD is in correction, but longs are now preferredETH is developing a big triangle, leg A of which is completed.

ETHUSDT.PHello friends
Given the good growth we had, the price has made a 14% correction. If the specified support is maintained, the price can see the specified targets. If the support is broken, the price can fall by another step. We have identified important support points for you.
*Trade safely with us*

#ETH/USDT Testing Wedge Breakout Amid Key Support#ETH
The price is moving within a descending channel on the 1-hour frame, adhering well to it, and is heading for a strong breakout and retest.
We have a bearish trend on the RSI indicator that is about to be broken and retested, which supports the upward move.
There is a major support area in green at 4480, which represents a strong support point.
For inquiries, please leave a comment.
We are in a consolidation trend above the 100 Moving Average.
Entry price: 4524
First target: 4585
Second target: 4645
Third target: 4715
Don't forget a simple matter: capital management.
When you reach the first target, save some money and then change your stop-loss order to an entry order.
For inquiries, please leave a comment.
Thank you.

PEPE : Important and influential resistance supportHello friends
Given the decline we had, we now have an important resistance that is key to the price's rise, and if it is broken, the price can move to the specified targets.
The second scenario is that the specified support is an important support that we obtained with Fibonacci, which can be an important support area for the price in case of further decline.
*Trade safely with us*

Important resistance blocking the way to the ascent...Hello friends
Well, we have a downtrend, and you can see that we have drawn a resistance for it, and the price has hit this resistance twice.
After the second hit, the price has fallen to the specified support area, and in that area a double bottom pattern has formed, and the price has been supported. Now, considering the support in this price area, we need to see if the buyers can break the specified resistance or not?
If the resistance is broken, the price can move up to the two specified areas, but if the price falls, we need to see if the support that once supported the price and caused the price to grow can support it again or not?
So, follow capital and risk management
*Trade safely with us*
ETH *UPDATE*Hello friends
Given the channel breakdown and the entry of buyers, it now seems that the price is in a pullback. In this case, the price pivots of the channel, which are now becoming supported, are expected to be good support and cause the price to grow and move with it to the specified targets.
*Trade safely with us*

Long ETHUSDTHello traders!
After a succesful break above resistance, I'm looking for this scalp long.
Don’t forget to like and share your thoughts in the comments! ❤️

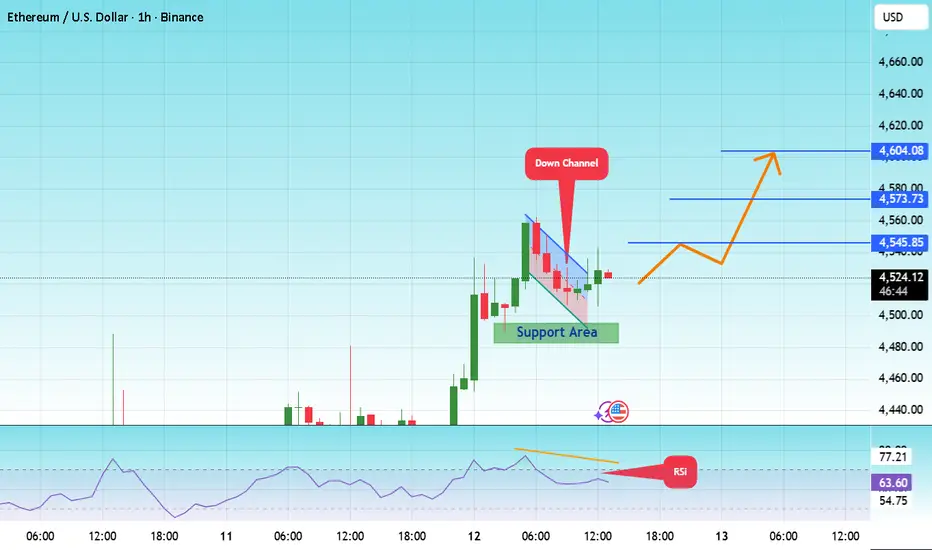
#ETH/USDT –> Falling Wedge Breakout Within Ascending Channel#ETH
The price is moving within a descending channel on the 1-hour frame and is expected to break and continue upward.
We have a trend to stabilize above the 100 moving average once again.
We have a downtrend on the RSI indicator that supports the upward move with a breakout.
We have a support area at the lower boundary of the channel at 4500, acting as strong support from which the price can rebound.
We have a major support area in green that pushed the price upward at 4485.
Entry price: 4525
First target: 4545
Second target: 4573
Third target: 4604
To manage risk, don't forget stop loss and capital management.
When you reach the first target, save some profits and then change your stop order to an entry order.
For inquiries, please comment.
Thank you.
ETH/USDT 15m – Breakout Above $4,600/- Whats Next For #ETH ?🚀 ETH just broke out of the $4,600 zone, holding strong above the EMA200.
Fresh Fair Value Gaps (FVG) and demand zones are supporting momentum, with bulls now eyeing $4,700–$4,800 next.
🔎 Market Structure
EMA200 trend remains bullish on 15m.
Breakout from the $4,520–$4,560 consolidation.
Liquidity above $4,600 cleared → momentum intact.
📍 Key Levels
Support 1: $4,535 (intraday demand / FVG retest)
Support 2: $4,480–$4,520 (previous base)
Deep Bullish FVG: $4,360–$4,400
Resistance 1: $4,700–$4,720
Resistance 2: $4,800–$4,850
📈 Trade Plan (FVG Strategy)
Entry Zone: $4,606 – $4,620
Stop Loss: $4,585
Targets:
TP1: $4,700
TP2: $4,760
TP3: $4,800+
✅ Outlook
As long as $4,535 holds, dips into FVG/demand zones remain buy opportunities.
A clean break above $4,700 could accelerate momentum to $4,800–$4,850.
⚠️ Breakdown below $4,535 would weaken structure and open downside to $4,480 / $4,360.
💡 Not financial advice. Educational purposes only. Manage risk carefully.
📢 What’s Your Take?
Do you think ETH can hold $4,535 support and push toward $4,800?
Drop your thoughts below & hit follow for daily crypto setups 🚀
🔖 Hashtags
#ETHUSDT #ETH #Ethereum #Crypto #Altcoins #15m #Scalping #DayTrading #SwingTrading #EMA200 #FVG #PriceAction #TechnicalAnalysis
ELong

ETH ready for bullish momentum.ETH accumulated enough short liquidation for bullish momentum. With the expectation of rate cuts in september we will see a bullish momentum towards these levels #ETH

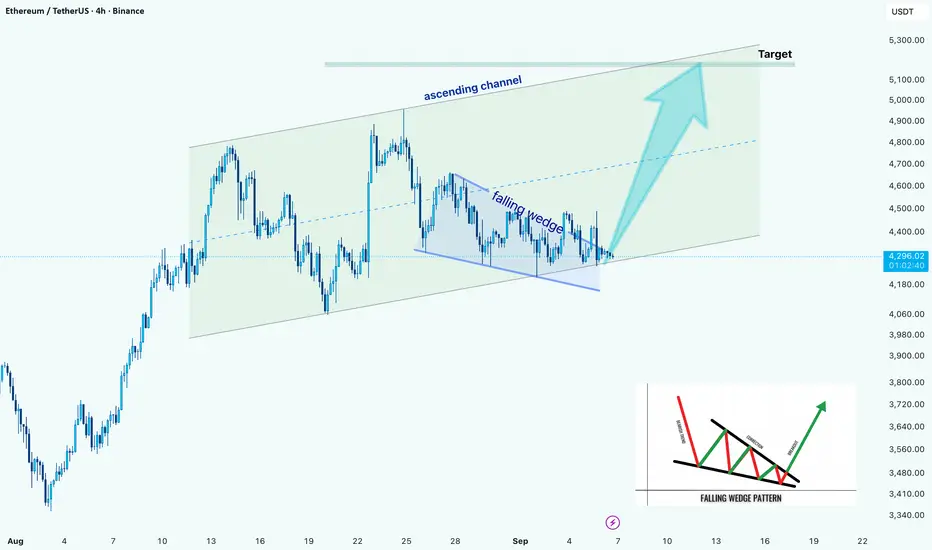
ETH/USD –> Falling Wedge Breakout Within Ascending ChannelHello guys!
Ethereum is showing a strong technical setup on the 4H chart. Price has been respecting an ascending channel since early August, and within this structure, a falling wedge has recently formed.
Right now, ETH is testing the wedge breakout point near the bottom line of the channel. If buyers manage to hold momentum here, we could see price extending toward the channel’s upper boundary, with the next major target sitting around $5,100 – $5,300.
On the downside, failure to sustain above the wedge support may lead to a retest of the lower channel trendline around $4,100 – $4,150, which remains a critical support area for bulls to defend.
Ethereum Trade Setup - Sep 12th📲 NFX Trade Alert – Swing Setup
💹 Instrument: BINANCE:ETHUSD Ethereum (ETHUSD.r)
🛒 Trade Type: Swing – Buy at Market
📍 Entry: $4,540
⛔ Stop Loss: $4,450
✅ Target Profit: $4,950
📊 Trade Setup Analysis – Ethereum
Ethereum has finally broken through the $4,500 block order, which is now acting as solid support after multiple rejections on both the H1 and H4 timeframes.
With this breakout confirmed, price has no significant resistance until $4,650 (minor) and $4,850 (major). This opens the path for higher prices in the near term.
⚖️ As always, manage risk carefully — even a high-probability setup requires discipline and protection.💚

$ETH Breakout Signals 10% Upside PotentialCRYPTOCAP:ETH has broken out of its downtrend and reclaimed support around 4.5K.
If it holds, momentum could push toward 5K, nearly a 10% move.
DYOR, NFA

ETH UPDATEMy former analysis of ETH touch my support and resistance twice total %10 at least %5
But unfortunately it wasnt my path I expected direct and strong candles but we couldnt stay over the resistance and fall twice this may be sign for not the push my main target (red box)
Now we will see third one but if we fail again It wont be good for ETH. I will active my second order if I see weakness So you may want to close all your positions when we hit full target, after TP1 put stop loss to break even and wait this is your choice I will let you know for other uptades keep following
Always manage your own risks this is not a investment advise I am not responsible neither your loss nor profit.

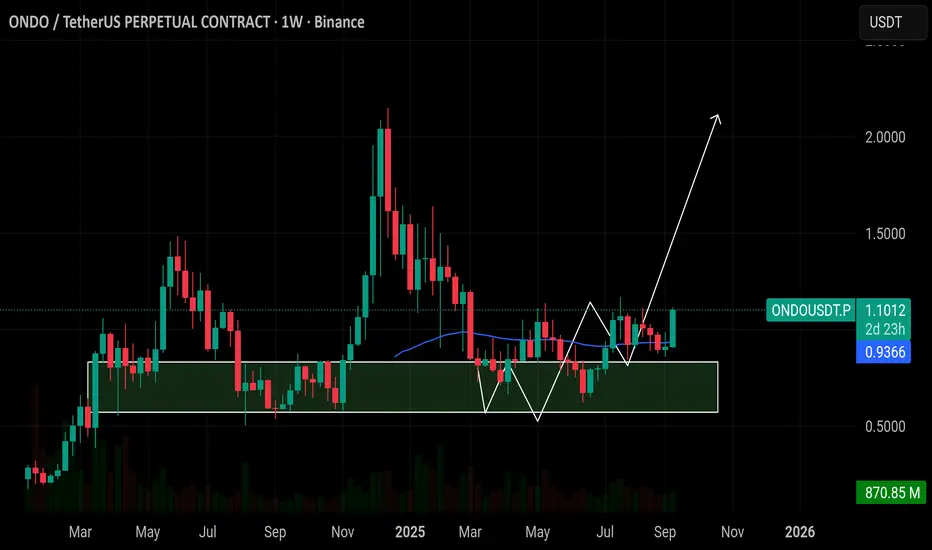
$ONDO: Both Entries Filled — Bullish Wave LoadingCRYPTOCAP:ONDO : Both Entries Filled — Bullish Wave Loading 🚀
Both support entries triggered successfully, and buyers stepped in with conviction. The inverse head & shoulders on the weekly chart is becoming clearer, pointing to a major bullish reversal.
🔸 Support at $0.85 – $0.92
This zone is now proven demand. As long as ONDO holds it, the bullish structure stays intact.
🔸 Upside Target: $2 – $2.50
With the breakout brewing, weekly momentum could fuel a move toward previous highs, especially if volume continues to build.
🔸 Risk Level at $0.54
That’s still the ultimate invalidation level, but with supports holding, probability leans toward continuation.
Outlook:
Entries filled now it’s about managing the trade.
Trail stops into profit as ONDO pushes higher.
#ONDO is doing exactly what accumulation patterns are meant to do flush out weak hands, fill supports, and then launch.