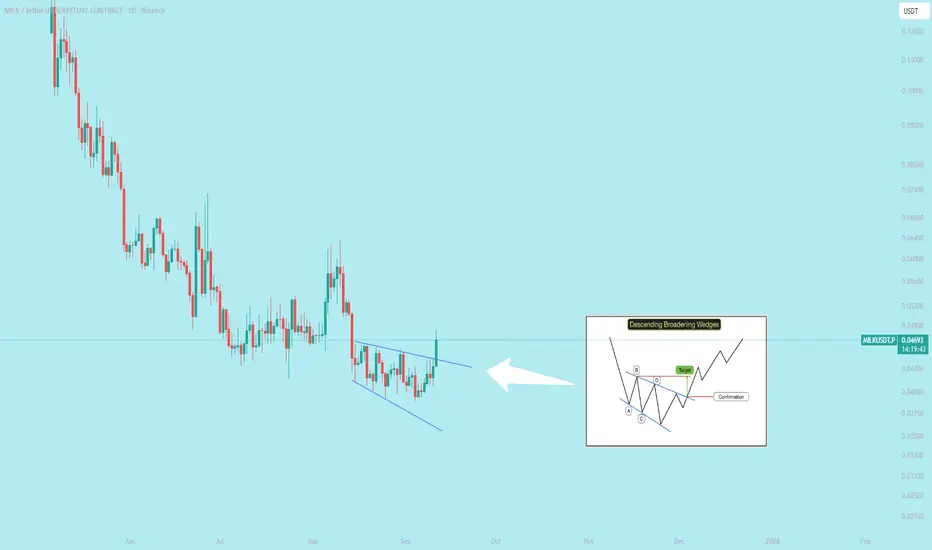
ETH Don’t Miss Out!!!
**🚀 ETH WEEKLY TRADE IDEA — \$4K BREAKOUT WATCH**
📈 **Market Bias:** Bullish (Long-term uptrend intact, ETH above key MAs)
⚠ **Short-Term Risk:** MACD bearish crossover + RSI overbought → possible pullback before breakout
📊 **Key Level:** Testing **\$4,000** psychological resistance
**🛠 Setup:**
* **Direction:** LONG
* **Entry:** \$3,966.12
* **Stop Loss:** \$3,900 (below key support)
* **Take Profit:** \$4,050 (first target)
* **Size:** 0.5 (volatility-adjusted)
* **Confidence:** 75%
* **Entry Timing:** Market open
📌 **Why Long?**
* Strong uptrend + above key moving averages
* Positive funding rates and recent momentum support bullish case
* Risk-reward favorable for a potential \$4K+ breakout
💡 *Watch for volume confirmation — failure to break \$4K with strong buy-side pressure could trigger a pullback to \$3,900.*
---
**#ETH #Ethereum #Crypto #Cryptocurrency #CryptoTrading #ETHUSD #Altcoins #Bitcoin #BTC #CryptoSignals #CryptoSetup #TechnicalAnalysis #SwingTrade #DayTrade #PriceAction #BreakoutTrading #CryptoMarket #CryptoInvesting #MACD #RSI #TradingStrategy #BullishSetup #SupportAndResistance #VolumeAnalysis**
Ethlong
HAPPYUSDTBased on the overall output of these analyses, spot buying of this cryptocurrency around 0.001 to 0.00088 is reasonable and less risky. As long as these levels are valid, we can expect the price to grow in the form of wave C.
The ideal target of wave C could be around 0.0047.. which has a very attractive range of movement.
Mid-September could be a reasonable time to complete wave B and start the hypothetical wave C.. Also, important times are clear on the chart.
This is just a scenario. Only if the price reaches these areas by re-examining the market can we look for buying.
It should also be noted that this cryptocurrency is an anonymous meme coin with a very small market cap and carries a lot of risk.
$ETH/USDT Breakout Analysis 1W Chart: Ethereum $ETH/USDT Breakout Analysis 1W Chart:
ETH has successfully reached the $4,000 breakout level, completing our first major target from the accumulation zone ($1,500–$1,900). Price is currently testing the critical $4,000 resistance. If ETH can close a weekly candle above this level and hold, it will confirm a strong continuation structure — potentially targeting $5,000, $7,000, and up to $8,000 in the coming months.
🔸 Support LEVEL: $3,500 is now the key weekly support zone. This level aligns with previous resistance and structure, offering a strong base for bullish continuation. If ETH holds $4,000+ weekly, $3,500 becomes a high-conviction re-entry zone.
🔸 Upside Target: Upon confirmation above $4,000, ETH could rally toward $5,000 short-term, with extended targets at $7,000 and $8,000 if momentum continues.
🔸 Risk Level at $3,500: A weekly close below $4,000 followed by a drop under $3,500 would invalidate the breakout. This could signal a failed breakout and return to range. High risk zone opens below $3,200.
🔸 Watch for Retest ZONE: Look for a healthy retest of the $3,900–$4,000 zone. If ETH pulls back and holds this zone on weekly, it offers a strong entry with targets toward $5,000 and above.
ETH Testing Critical $4K Resistance!BINANCE:ETHUSDT is trading inside an ascending triangle on the weekly chart, with price compressing between the resistance line and a rising support line. After a strong rally from the $1,500 demand area, ETH has reclaimed the 100- and 200-week EMAs and is testing the triangle’s upper trendline with increasing volume.
A weekly close above $4,000–$4,200 would confirm a triangle breakout and open upside toward $6,000–$7,500, while a rejection could send price back toward $3,200–$3,000 for further consolidation. Wait for a clear weekly close and volume confirmation.
Cheers
Hexa
BITSTAMP:ETHUSD CRYPTOCAP:ETH
Monthly MACD crossover taking place, a prabolic rise?Last 2 times, when the monthly MACD cross over has happened, ETH has gone bonkers. A third one is on the verge of happening, RSI has enough room with a symmetrical triangle with bullish momentum - looks like a big rally is in the near horizon. Fingers cross.
Bitcoin and Broad Market Breakout (BTC, ETH, SOL, PENDLE)In this video we take a look at why the market rallied Thursday.
- 93% of FOMC September Rate cut and 3 possible cuts in 2025
- UK just dropped rates to 4%
- President Trump approved letting 401k's invest in crypto
- Trump removed resitrictions by banks to 'de-bank' crypto investors
The charts looks very bullish here and I revisit the potential path to $150 BTC this year.
Also ETH, Solana charts and 'The Rocket'
As well as the 25% move on Pendle which I had recommended as a 'Buy' the day before.
Let me know what you think...
The BULL is Back.
ETH ( Ethereum ) lovers looking strong for long term ETH -----Daily counts indicate Excellent bullish wave structure.
Both appear to be optimistic and this stock invalidation number (S L) wave 2 low
target short / long term are already shared as per charts
correction wave leg seems completed
Investing in declines is a smart move for short/ long-term players.
Buy in DIPS recommended
Long-term investors prepare for strong returns over the next two to five years.
one of best counter
Every graphic used to comprehend & LEARN & understand the theory of Elliot waves, Harmonic waves, Gann Theory, and Time theory
Every chart is for educational purposes.
We have no accountability for your profit or loss.
ETH to 19k by Dec 17. BTC Aug 2017- identical $/time to ETH nowOn this day, August 2017 BTC was trading at approximately $3400-$3600.
By Christmas, it hit 19.8k. I expect a similar outcome with in ETH 2025.
Leverage causing liquidations on both sides and volatility the whole way up.
Be right and sit tight. These opportunities happen very infrequently. Don't fumble the bag.
ETH(20250806) market analysis and operationAugust 6th ETH Contract Technical Analysis:
Today, the daily chart showed a small bullish candlestick pattern yesterday, with prices rising continuously. However, the accompanying indicator formed a death cross. Monday's gains were not followed by a significant pullback on Tuesday. Therefore, it is difficult for both upside and downside to continue, and the trend remains range-bound. Until a breakout occurs, maintain a short-term strategy of selling high and buying low. On the hourly chart, yesterday's US session continued the downward trend of the European session, correcting the current bearish candlestick pattern. The accompanying indicator formed a death cross with shrinking volume, suggesting a high probability of a pullback during the day. Focus on the upward pressure around the 3700 high.
Today's ETH Short-Term Contract Trading Strategy:
Buy on pullbacks to the 3590 area, with a stop loss at the 3560 area, and a target of the 3650 area. Sell on pullbacks to the 3670 area, with a stop loss at the 3701 area, and a target of the 3605 area.
ETH-----Sell around 3670, target 3600 areaAugust 5th ETH Contract Technical Analysis:
Today, the daily chart closed with a small bullish candlestick pattern, with consecutive bullish candlesticks and prices consolidating at high levels. The accompanying indicator formed a death cross. The price did not break through the previous high on the pullback, so the overall downtrend is still favorable. However, it should be noted that yesterday's pullback interrupted the ongoing downward trend, so this is important to note. The hourly chart showed continued gains during the European and American sessions, while prices came under downward pressure during the Asian morning session. The current candlestick pattern is a series of bearish candlesticks, with the accompanying indicator forming a downward death cross. This suggests a continued upward trend within the next few days, but the strength and impact of the European session remain important to monitor.
Today's ETH Short-Term Contract Trading Strategy:
Sell on pullbacks to the 3670 area, with a stop loss at 3700 and a target at 3600.
Ethereum’s 1H Chart Screams Breakout — Next Stop $3,941?Ethereum has recently broken above a short-term descending trendline that had been guiding the market lower over the past sessions. This breakout occurred after price formed a strong base around the $3,357 support zone, indicating that sellers were losing momentum. The “B” buy signals printed near these lows further strengthen the bullish outlook.
The immediate resistance lies around $3,559, which is the level price is currently approaching. If buyers can maintain momentum above this area, the next upside targets are $3,576, $3,680, $3,717, and $3,773. The major resistance and projected take-profit area is near $3,941.
From a structural standpoint, the shift from lower lows to higher lows suggests that the short-term trend may be reversing in favor of buyers. This aligns with the increased buying volume observed after the breakout, hinting at potential follow-through in the next London or New York session.
Trading Setup
• Entry: Around $3,553 after breakout confirmation
• Stop-loss: Below $3,357
• Take-profit 1: $3,680
• Take-profit 2: $3,773
• Final Target: $3,941
• Risk-Reward: Approximately 1.89:1
ETH/USD – Critical Reversal Zone?
### 🚀 ETH/USD – Critical Reversal Zone?
**🔍 ETH Futures Multi-Model Signal | Consensus: LONG | Confidence: 77%**
---
**🧠 Key Highlights (DS + OA Model Consensus):**
* **Price:** \$3,375 → Trading *below* EMA9/SMA20 = short-term bearish, but hitting strong **support zone**
* **Support:** \$3,248 (Bollinger Lower) & \$2,987 (SMA50)
* **Resistance:** \$3,487 (EMA21), \$3,620 (SMA20)
* **Volume:** -10.3% (5D) → Selling **weakening**
* **RSI:** 49.5 → Neutral but oversold on short-term
* **MACD:** Bearish crossover, but showing **divergence**
* **Volatility:** Bollinger width 9.18% = **Breakout Setup**
---
### 📈 Trade Setup – Conditional LONG
| Entry | Stop Loss | Target | R/R | Confidence |
| ------- | --------- | ------- | ------ | ---------- |
| \$3,375 | \$3,229 | \$3,690 | 1:3.24 | 77% ✅ |
🪙 **Trade Type:** Scale-in (50% @ \$3,375, 50% @ \$3,275)
📊 **Take Profits:**
* TP1: \$3,485 (EMA21)
* TP2: \$3,590 (SMA20)
* TP3: \$3,690 (Weekly VWAP Anchor)
---
### ⚠️ Risk Dashboard
* 🚨 BTC < \$58K → Setup invalid
* 📉 No Open Interest Data – monitor liquidation triggers
* 🧠 Max Position Risk: **1.25%** | Use hard stop-loss
* ⏰ Entry Timing: **London Open (8:00 GMT)**
---
### 💬 TL;DR
ETH is sitting in a **high-confluence reversal zone**. Weak sell volume, macro bullish trend, and volatility contraction signal a potential bounce. 📊 **Risk-defined long** setup favored by both models.
🧠 “Smart money doesn’t chase — it positions early.”
---
📌 **#ETH #CryptoTrading #ETHUSDT #Futures #BreakoutSetup #BollingerBands #MACD #RSI #DeFi #Ethereum #CryptoSignals #TradingView**
ETH Approaching Major Resistance – Expecting Pullback Hello guys!
Ethereum has been rallying strongly within a well-respected ascending channel, pushing past key levels and now approaching a major resistance zone around $3,900–$4,000.
According to the chart structure, it looks like price could soon react from this resistance, leading to a pullback into the $3,000–$3,200 demand zone, which aligns with the midline of the channel.
This would be a healthy correction before potentially continuing the bullish trend and attempting a clean breakout toward new highs.
ETH is still bullish, but it may need to retest support before continuation.
Watch for a bounce from the $3,000–$3,200 zone for a high-probability long opportunity.
The Loudmouth Pattern: It Yells, We Trade!
On the 30-minute chart, ETH is forming a classic Broadening Formation – or as some traders like to call it, “The Big Mouth Pattern” 😄. It’s noisy, unpredictable at first glance, but when it speaks, you’d better listen.
Right now, price is moving through the bullish leg of this setup, and if momentum holds, we’re eyeing the $4,000 psychological level, followed by the $4,120 – $4,170 supply zone.
🔹 Bullish Scenario (our expected outlook):
🎯 Target 1: $4,000
🟩 Main Resistance: $4,120 – $4,170
❌ Invalidation: Confirmed close below $2,946
If price breaks and holds below that red support zone, this setup gets thrown out the window.
📊 Risk Management:
Scale in on pullbacks – if structure remains valid
No chasing without confirmation
Keep risk under 1% of total capital
📈 The market’s big mouth is open – and until it closes below $2,946, we’re listening for bullish signals. 🤑
Ethereum (ETH/USD) Analysis - Aug 01, 2025ETH is showing a strong uptrend on the 1D chart, recently hitting $3,639.37 after a -1.59% dip. A key support zone around $3,500 is in sight, which I’m eyeing as a potential buy opportunity. The chart suggests a solid base here, with historical price action holding firm.
Watch for a bounce or consolidation around $3,500-$3,600 before the next leg up.
Target: $4,000+ if momentum holds.
Risk: A break below $3,300 could invalidate this setup.
ETHUSDT.PIf you look at the chart, you will notice an uptrend that has somewhat lost its strength and we may not be able to hit higher highs like the next strength in the next move.
Support: 3.660 - 3.590 - 3.160
Resistance: 3.900 - 4.260
Entry: 3.700
SL: 3.500
TP: 4.240
Please control risk management.⚠️
3 Key Catalysts Driving the Next ETH Bull Run
A remarkable confluence of powerful market forces is brewing in the Ethereum ecosystem, fueling increasingly bold outlooks for its future valuation. A potent combination of historical price patterns, dramatic supply dynamics, soaring institutional interest, and resilient price action is painting a picture of a digital asset potentially on the verge of a historic expansion. While a target of $20,000 may seem audacious, a granular look at the underlying mechanics reveals a compelling, multi-faceted argument for a significant upward repricing of Ethereum (ETH).
This deep dive will explore the four key pillars supporting this optimistic outlook: a striking historical price pattern that mirrors Bitcoin’s monumental 2021 surge, a critical supply shock evidenced by a mass exodus of ETH from exchanges, record-breaking institutional engagement in the futures market, and a tenacious price strength holding firm at key technical levels.
Chapter 1: The Bitcoin Fractal: Is History Rhyming?
In financial markets, history rarely repeats itself exactly, but its patterns often rhyme. Market analysts are increasingly pointing to a "fractal"—a recurring geometric pattern in price action—that suggests Ethereum's current market structure is eerily echoing that of Bitcoin's in late 2020, just before its parabolic surge in 2021.
This analysis highlights that Ethereum's chart is displaying a nearly identical pattern of accumulation, re-accumulation, and price compression that Bitcoin exhibited before its own historic breakout. During that period, Bitcoin experienced a multi-fold increase in value, shattering previous records. The parallel suggests that, much like Bitcoin did, Ethereum has emerged from a prolonged consolidation phase and is now pressing against a long-term downtrend resistance line that has defined its market structure for several years.
Should this fractal play out as it did for Bitcoin, a decisive breakout above this critical resistance could trigger a rapid, exponential move upwards. The potential for such a climb is being fueled by a perfect storm of institutional adoption and favorable market shifts.
A critical catalyst underpinning this parallel is the recent launch and explosive growth of spot Ethereum Exchange-Traded Funds (ETFs). The 2021 Bitcoin bull run was significantly propelled by growing institutional legitimacy and new, regulated investment vehicles. Similarly, Ethereum ETFs are now providing a secure and accessible gateway for a fresh wave of institutional capital. These funds have already seen staggering net inflows, with major asset management firms accumulating billions in assets, signaling deep conviction from the titans of traditional finance. This institutional stamp of approval is a powerful parallel to the forces that drove Bitcoin's last major cycle, providing the foundational capital flows needed for a sustained rally.
Chapter 2: The Great Supply Squeeze: A Mass ETH Exodus from Exchanges
One of the most compelling bullish arguments for Ethereum is rooted in fundamental on-chain economics: a dramatic and accelerating supply squeeze. The "Exchange Reserve," a metric that tracks the total amount of ETH held in the wallets of centralized exchanges, has plummeted at an astonishing rate.
In a recent one-month period alone, well over one million ETH were withdrawn from these platforms. This mass exodus of coins is a profoundly bullish indicator. When investors move their assets off exchanges, it typically signals an intention to hold for the long term in self-custodial wallets, rather than keeping them liquid and ready for a quick sale. This behavior drastically reduces the immediately available supply on the open market. Consequently, even a steady level of demand can exert significant upward pressure on the price.
This trend has pushed the total supply of Ethereum on exchanges down to its lowest level in nearly a decade. The drivers behind these massive withdrawals are multifaceted and all point toward a tightening market:
• Long-Term Conviction and Staking: A growing number of investors are locking up their ETH in staking contracts to help secure the network and earn passive yield. Others are simply moving their holdings to secure "cold storage" with a long-term investment horizon, effectively taking them off the market for the foreseeable future.
• DeFi Integration: A significant and growing portion of ETH is used as the primary form of collateral within the sprawling Decentralized Finance (DeFi) ecosystem, where it is locked into smart contracts for lending, borrowing, and other financial applications.
• ETF Accumulation: The newly launched spot ETFs are required to purchase and hold real ETH to back their shares. This direct accumulation removes vast quantities of ETH from the circulating supply that would otherwise be available to retail and institutional buyers.
This fundamental imbalance between a shrinking available supply and growing demand is creating the perfect conditions for a potential "supply shock." The sustained decline in exchange reserves, even as prices have rallied, reinforces the idea that current holders are not rushing to take profits. This indicates a strong belief in future price appreciation and adds a powerful layer of underlying support to Ethereum's macro bullish structure.
Chapter 3: The Wall of Institutional Money: Futures and Open Interest Soar
The derivatives market, often seen as the playground for more sophisticated and institutional investors, is flashing its own set of glaringly bullish signals. Open Interest (OI) in Ethereum futures—representing the total value of all outstanding futures contracts that have not been settled—has surged to unprecedented levels.
On major regulated exchanges favored by institutional investors, Ethereum futures Open Interest has recently shattered all-time highs. This represents a massive and undeniable increase in institutional participation, as asset managers, hedge funds, and other large-scale players use these regulated products to gain exposure to ETH's potential upside and to manage their risk. This is not an isolated phenomenon; across the global landscape of exchanges, the total Open Interest for Ethereum futures has climbed to record-breaking heights.
Rising Open Interest that occurs in tandem with a rising price is a classic technical confirmation of a strong and healthy trend. It demonstrates that new money is actively flowing into the market, with participants expressing confidence in future price appreciation. This influx of capital adds significant fuel to the ongoing rally. The surge in derivatives activity highlights a maturation of the market, where both institutional and retail investors are increasingly using sophisticated financial instruments to speculate on Ethereum's price trajectory.
While the high levels of leverage inherent in futures trading can introduce volatility and the risk of cascading liquidations, the primary signal is one of immense and growing institutional conviction in Ethereum's medium-to-long-term outlook. The influx of capital into both spot ETFs and the futures market creates a powerful, self-reinforcing feedback loop, enhancing liquidity, legitimizing the asset class, and attracting even more conservative capital off the sidelines.
Chapter 4: The Immediate Battleground: Price Action Shows Resilient Strength
Zooming in from the macro-outlook to the short-term technical picture, Ethereum's price action has demonstrated notable resilience, reinforcing the broader bullish thesis. After a strong rally, the price has been consolidating its gains, establishing critical support zones that traders and algorithms are watching with keen interest.
Recent price action shows Ethereum starting a fresh increase above the $3,820 and $3,880 levels. The price is trading near the crucial $3,800 mark and the 100-hourly Simple Moving Average, an indicator that often acts as a dynamic line of support during uptrends. Although there was a brief break below a key bullish trend line that had formed with support at $3,800 on the hourly chart, the ability of the price to remain supported above the broader $3,720 zone is considered vital for a bullish continuation. Should the pair remain supported above this zone in the near term, it could start a fresh increase.
The price has recently faced resistance near the $3,900 and $3,920 levels. The psychological $4,000 barrier remains the next major target. A decisive and sustained break above the $4,000 mark could open the door for a rapid advance, as it would clear the last major resistance area before a potential retest of previous all-time highs.
Technical indicators on higher timeframes remain robust. The price is in a clear long-term uptrend, trading well above its key daily moving averages. While short-term indicators may show temporary overbought conditions or moments of waning momentum, the overall market structure remains decisively bullish as long as critical support levels continue to hold.
Conclusion: A Compelling Case for a New Era of Price Discovery
The prospect of Ethereum reaching a valuation of $20,000 is a monumental forecast, but it is one built on a solid and multi-faceted foundation. The convergence of a compelling historical fractal mirroring Bitcoin's most famous bull run, a verifiable and intensifying supply shock, unprecedented institutional adoption via both spot ETFs and futures markets, and a resilient technical posture creates a powerful case for a sustained bullish continuation.
Each pillar of this argument reinforces the others. Institutional inflows from ETFs directly contribute to the supply squeeze on exchanges. The resulting upward price pressure attracts more speculative interest in the futures market, and the resilient technical picture provides the stable base from which a larger market move can be launched. While no outcome in financial markets is ever guaranteed, and the risks of volatility and sharp corrections remain ever-present, the confluence of these potent factors suggests that Ethereum may not just be knocking on the door of its old all-time high, but preparing to smash through it and enter a new and explosive era of price discovery.
#ETH/USDT SETUP ,Bought From $4003#ETH
The price is moving within an ascending channel on the 1-hour frame, adhering well to it, and is on track to break it strongly upwards and retest it.
We have support from the lower boundary of the ascending channel, at 3700.
We have a downtrend on the RSI indicator that is about to break and retest, supporting the upside.
There is a major support area in green at 3711, which represents a strong basis for the upside.
Don't forget a simple thing: ease and capital.
When you reach the first target, save some money and then change your stop-loss order to an entry order.
For inquiries, please leave a comment.
We have a trend to hold above the 100 Moving Average.
Entry price: 3811.
First target: 3867.
Second target: 3936.
Third target: 4003.
Don't forget a simple thing: ease and capital.
When you reach your first target, save some money and then change your stop-loss order to an entry order.
For inquiries, please leave a comment.
Thank you.
#ETH/USDT SETUP ,Bought From $3696#ETH
The price is moving within a descending channel on the 1-hour frame, adhering well to it, and is on its way to breaking strongly upwards and retesting it.
We have support from the lower boundary of the descending channel at 3640.
We have a downtrend on the RSI indicator that is about to be broken and retested, supporting the upside.
There is a major support area in green at 3600, which represents a strong basis for the upside.
Don't forget a simple thing: ease and capital.
When you reach the first target, save some money and then change your stop-loss order to an entry order.
For inquiries, please leave a comment.
We have a trend to hold above the Moving Average 100.
Entry price: 3696.
First target: 3764.
Second target: 3826.
Third target: 3904.
Don't forget a simple thing: ease and capital.
When you reach your first target, save some money and then change your stop-loss order to an entry order.
For inquiries, please leave a comment.
Thank you.


