ETH/USD: Could $ETH Hit $7,000 by Year-End?As of August 25, 2025, Ethereum (ETH) is trading at approximately $4,795.60, showing a steady upward trajectory since early August. This bullish momentum is supported by several key factors, including institutional interest, ETF inflows, and the ongoing strength of decentralized finance (DeFi) applications.
ETH has recently surpassed the $4,750 resistance level, indicating a potential move towards the $5,000–$5,200 range. The next significant resistance is around $5,000, which, if broken, could pave the way for a retest of the all-time high near $5,200. Conversely, support levels are found at $4,700 and $4,600–$4,400. A drop below $4,600 could signal a short-term pullback.
Ethereum's recent price surge is attributed to increased institutional demand, particularly following the launch of Ethereum ETFs, which have attracted significant capital inflows. Additionally, the Ethereum network's upgrades and the growing adoption of Layer 2 solutions have enhanced scalability and reduced transaction costs, further bolstering investor confidence.
Outlook for Q4 2025
Looking ahead, if ETH maintains its current trajectory and breaks through the $5,200 resistance, it could target the $6,000–$7,000 range by the end of the year. However, market volatility remains a factor, and investors should be prepared for potential fluctuations.
*Ethereum's current bullish trend is supported by strong technical indicators and positive fundamental developments. While the path to new all-time highs appears promising, it's crucial for investors to monitor key support and resistance levels and remain cautious of market volatility.
Ethlong

Resistance is broken!!!Hello friends
it is clear that we have a downtrend and in this downtrend we have an important resistance that we have identified for you and given the strength of the sellers, the price has not yet managed to break this resistance.
We also found important support points with Fibonacci (which has now become resistance) that the price reacted to once and still could not break its resistance. However, if this resistance is broken, the specified Fibonacci steps, which are also resistance, can be our target and the price can move to these resistances, of course, if the support is maintained and the specified resistance is broken. Observe risk and capital management.
*Trade safely with us*

Interesting projectHello friends
you can see that the price is in a sensitive area and if the support is maintained and the first resistance is broken, the price can move to the next resistances. Of course, keep in mind that there is a possibility of a price correction when reaching each resistance, so don't forget to save your profit.
If the support area is broken and the price drops, we have identified an important support with Fibonacci, which means that the probability of price support by buyers in that area is high.
Observe risk and capital management.
*Trade safely with us*

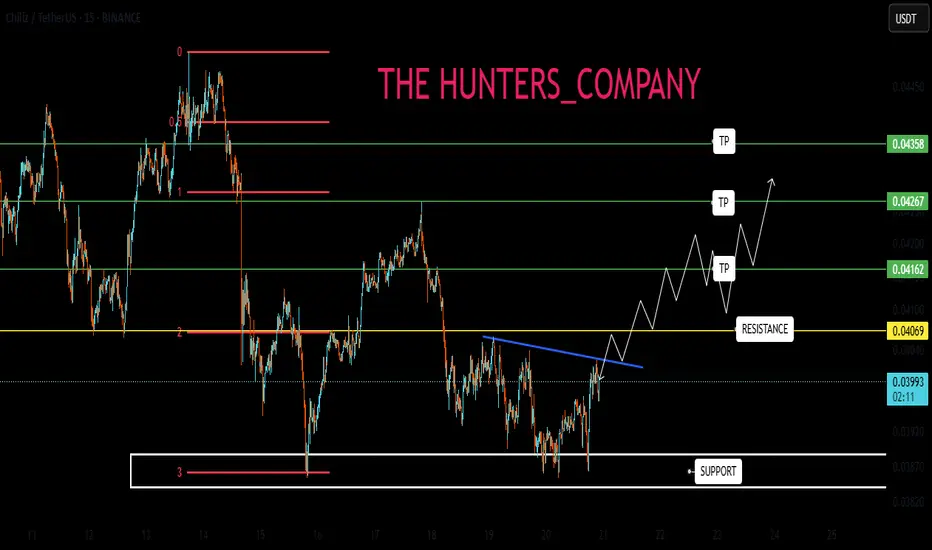
CHZ : BUY OR SELL? Hello friends
According to the price drop, you can see that the price is in the support area specified by the buyers. The specified support is also specified with Fibonacci, which is from our own strategy.
Now, if the support is held and the specified resistance is broken, the price can move to the specified targets. Don't forget risk and capital management.
*Trade safely with us*
Will Ethereum and Altcoins Continue to Grow?Hello friends
You see the Bitcoin to Ethereum chart.
You may be wondering what caused Ethereum to grow. I should tell you that this chart shows us what happened.
The price is in a downtrend, which indicates a money movement (from Bitcoin to Ethereum).
When you see that after 3 hits to support, the price has managed to break the support and the price has fallen and formed a downward channel, which could indicate that Ethereum's growth is continuing.
So now we have identified the support areas for you using Fibonacci, based on the price range that has formed.
The price is now at an important support area, as you can see, we had a bullish reaction when we hit the support area, but the price reversed due to the strength of the downtrend...
Now, if the support area breaks, the price can move lower to the specified targets.
Keep in mind that if the price grows, the upper support areas that were broken now become resistance and the price must be able to break them for our trend to be bullish, but as long as the price is down, the upward trend of Ethereum will continue and the upward trend of Ethereum will also make the altcoins bullish...
*Trade safely with us*

Ethereum Remains Technically Solid Bullish Background ConfirmedOverall Market Sentiment
Looking at TipRanks data, ETH is receiving Strong Buy signals on the daily, weekly and monthly timeframes, with a strong dominance of "Buy" on the moving averages (12 Buy) and moderately positive dynamics on the oscillators
Price indicators (EMA20, EMA50, EMA100, EMA200) are significantly below the current price, which confirms a stable uptrend.
Key support and resistance levels
Support:
around $4,030-4,100, where an important foundation has been built in case of a reverse movement.
Resistance:
The previous zone of $4,300-4,350, where the price has repeatedly encountered difficulties.
A confident breakout is a possible path to $4,576 (the maximum of the 24-hour range) and further up.
Technical indicators and signals
Daily and weekly timeframes — "Strong Buy".
RSI ~55–56 (Buy), MACD — Buy. Other oscillators give a neutral signal.
Trade Plan from Binance (ETH/USDT):
Current price is around $4,336, below EMA7 ($4,398), but above EMA25 ($4,044) — confirms the medium-term bullish trend.
Possible rebound from support $4,278–4,300, targets — $4,398, $4,576 and then $4,781 upon breakout. Risk — fall to $4,043 upon breakout of EMA25.

Ethereum Ready to Moon?––Bullish Trade Plan to $5K+
# 🚀 ETHEREUM BULLISH TRADE SETUP 🚀
💎 ETH Long Targeting \$5,090–\$5,800 | Risk-Defined Play 🎯
📊 **TRADE DETAILS**
🎯 Instrument: **ETH**
📈 Direction: **LONG**
💰 Entry Price: **\$4,773.95**
🛑 Stop Loss: **\$4,640.00**
🎯 Take Profit: **\$5,090 → \$5,300 → \$5,800**
📊 Size: **1% Risk**
💪 Confidence: **65%**
⏰ Entry Timing: **Market Open**
⚡ **Rationale:**
✅ Price > Key MAs (20/50/200) → Multi-timeframe bullish structure
✅ RSI/MACD show momentum with room to run
✅ Reward/Risk \~ 2.5:1 toward \$5,090+
⚠️ Risk: Low volume rally + BTC correlation
📌 **Plan:** Scale in near 4,760–4,800 → Target breakout toward \$5,000+
---
\#Ethereum #ETH #Crypto #Altcoins #ETHUSD #CryptoTrading #ETHAnalysis #CryptoSignals #TradingSetup #Breakout

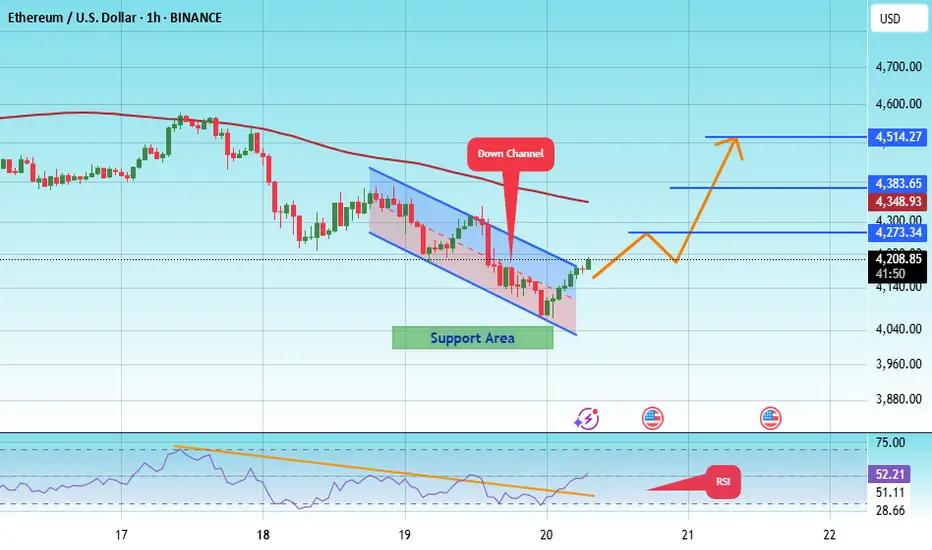
#ETH/USDT Breaks Below Recent Triangle Structure !#ETH
The price is moving within an ascending channel on the 1-hour frame, adhering well to it, and is on track to break it strongly upwards and retest it.
We have support from the lower boundary of the ascending channel, at 4040.
We have a downtrend on the RSI indicator that is about to break and retest, supporting the upside.
There is a major support area in green at 4000, which represents a strong basis for the upside.
Don't forget a simple thing: ease and capital.
When you reach the first target, save some money and then change your stop-loss order to an entry order.
For inquiries, please leave a comment.
We have a trend to hold above the 100 Moving Average.
Entry price: 4203.
First target: 4273.
Second target: 4383.
Third target: 4514.
Don't forget a simple thing: ease and capital.
When you reach the first target, save some money and then change your stop-loss order to an entry order.
For inquiries, please leave a comment.
Thank you.
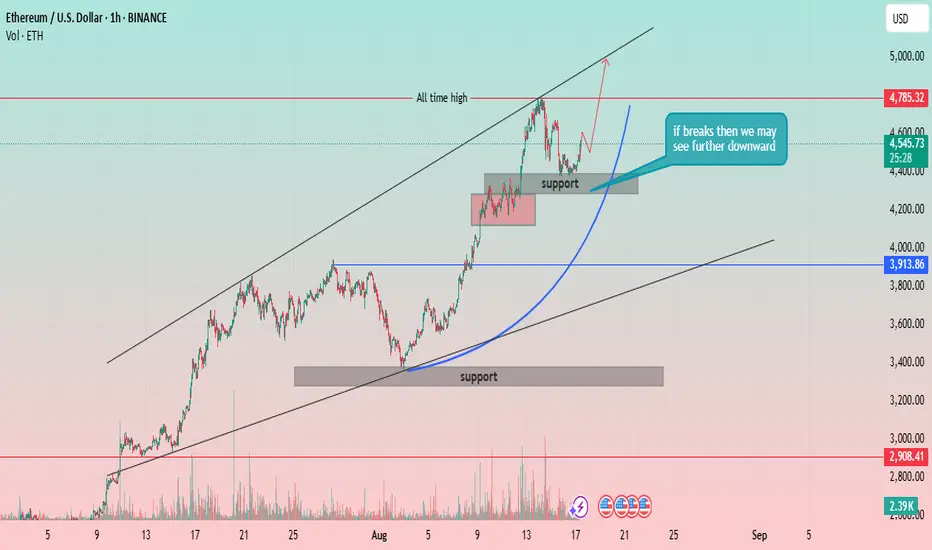
Ethereum (ETH) 1H Chart: Re-testing the All-Time High?Strong Uptrend Channel: The price of Ethereum has been moving within a well-defined ascending channel, indicated by two parallel black trendlines. This strong channel suggests a sustained bullish momentum.
All-Time High: A significant resistance level is marked as the "all-time high" at approximately 4,785.32 USD. The price has recently tested this level.
Support Levels:
Major Support Zone: A broad support zone is identified between approximately 3,300 USD and 3,450 USD. This zone has previously acted as a strong base for a price rally.
Recent Support Zone: A smaller, more recent support zone is marked around 4,200 USD. The price has consolidated within this area after its recent push towards the all-time high.
Price Action and Projections:
The price recently reached a peak near the all-time high and has since pulled back, consolidating within the recent support zone.
A key annotation states, "if breaks then we may see further downward." This highlights the importance of the 4,200 USD support zone. A break below this level could indicate a potential deeper retracement, possibly towards the lower trendline of the channel or the major support zone.
A parabolic arc is drawn (blue line), suggesting a potential trajectory for the price to continue its move higher from the current level, with a goal of re-testing or breaking the all-time high.
Volume: The chart includes a volume indicator, showing significant volume spikes during the major rallies and drops, confirming strong market interest and participation.
ETH/USD: Could ETH Surge Past $5,000 This Week?Over the next seven days, Ethereum (ETH) is projected to experience moderate bullish momentum, potentially reaching a price range between $4,800 and $5,000.
Currently, ETH is trading at approximately $4,852.49, reflecting a recent uptick of 14.33%. This positive movement is attributed to favorable macroeconomic indicators, including expectations of an interest rate cut by the U.S. Federal Reserve, which has historically supported risk assets like cryptocurrencies.
Technical analysis suggests that ETH is trading above key support levels and is approaching resistance zones. If the price breaks through these resistance levels, it could pave the way for further gains. Conversely, a failure to maintain upward momentum may lead to a consolidation phase or a slight pullback.
Market sentiment remains cautiously optimistic, with institutional interest continuing to grow. However, investors should remain vigilant, as the cryptocurrency market is known for its volatility and susceptibility to sudden shifts in sentiment.
In summary, ETH is poised for potential gains over the next week, but market participants should stay informed and prepared for any unforeseen developments that could impact price movements.

Ethereum Outperforms Majors as Crypto Sentiment Shifts Again 🌐 Ethereum Outperforms Majors as Crypto Sentiment Shifts Again 🔄📊
Trump talks 401(k) crypto 🗞️, BTC reclaims the key $115,800 level 💪, but today we zoom into what the charts are screaming — and Ethereum is leading.
While headlines fly, structure never lies. Let’s compare ETH against other majors 👇
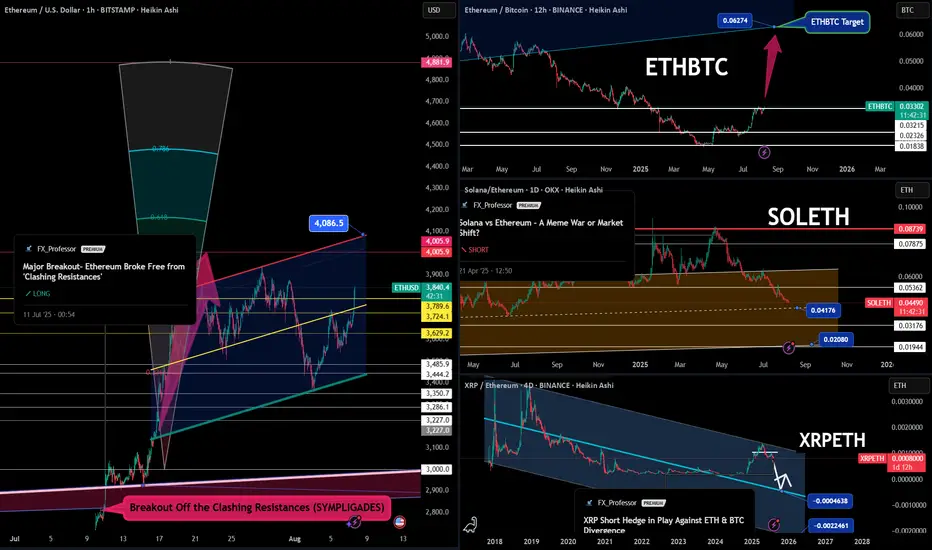
🔷 ETHUSD – The Breakout That Sparked It All
📈 ETH broke free from the "Clashing Resistances" zone (SYMPLIGADES).
It’s now targeting $4,086.5, with potential expansion toward $4,881.9 if momentum holds.
🟨 Key zones:
$3,744 = retest zone
$3,830 = resistance-turned-support
$4,005 = psychological milestone
The 1-2-3 model is alive and well.
And ETF news + BTC support is the fuel ETH needed. 🔥
📊 ETHBTC – The Hidden Strength Ratio
This is what most traders miss:
➡️ ETHBTC has been in stealth accumulation mode.
Now aiming for 0.06274 — a huge reclaim zone not seen since mid-2022.
This ratio matters because it signals altcoin rotation, not just price action.
💀 SOLETH – The Bleed Continues
We called it months ago:
Solana may have great tech (Rust, speed), but it’s paying the price for memecoin mania and diluted narrative.
SOLETH is in freefall — currently below 0.045, with support at 0.04176 and 0.02080 next if weakness continues.
ETH is eating market share back.
📉 XRPETH – Short Hedge in Play
XRPETH structure remains bearish.
Even after multiple divergence plays, XRP continues to underperform against both BTC and ETH.
Target zones:
🧊 0.00004638
🧊 0.00002246
XRP fans — this is not personal. This is chart-based reality.
🗞️ Don’t Forget the Macro Backdrop:
SEC just greenlit direct BTC/ETH usage in ETF flows
Trump hints at crypto-friendly 401(k) policies
China is brewing something (rumor or tumor — still unclear 😅)
BTC just reclaimed $115,800, setting sights on $122,795 → $132,595
This market isn’t waiting for confirmation — it’s moving based on structure.
🚫 What I Avoid in This Cycle:
❌ Memecoins (low trust, no ETF tailwind)
❌ GameFi (zero relevance right now)
❌ Ghost L1s (no users = no bids)
🧠 Final Take:
Ethereum is clearly leading the pack.
BTC is reclaiming its throne.
Solana is bleeding relative to ETH.
XRP is stuck in divergence hell.
So we trade the structure, not the hopium.
📈 Alt season won’t be a meme — it will be rotation-driven, narrative-backed, and ETF-aligned.
📽️ Full explanation in my previous video post — check it out if you want full breakdown on ETFs, ETH’s structural strength, and the geopolitical backdrop with China.
One Love,
The FXPROFESSOR 💙
Disclosure: I am happy to be part of the Trade Nation's Influencer program and receive a monthly fee for using their TradingView charts in my analysis. Awesome broker, where the trader really comes first! 🌟🤝📈
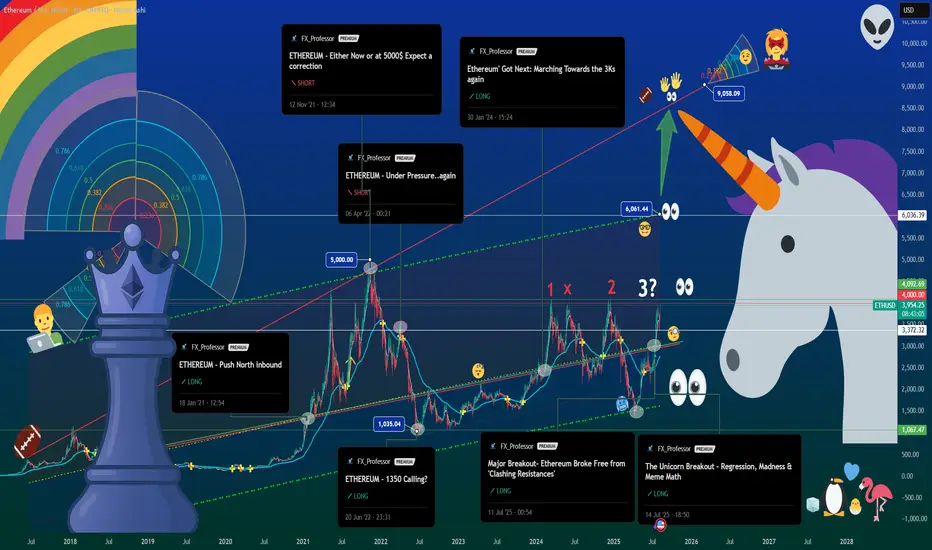
The Unicorn Breakout Part II – Ethereum at $4K, Queen of Crypto🦄👑 The Unicorn Breakout Part II – Ethereum at $4K, Queen of Crypto 📈♟
I’ve had a lot of conversations these past months.
Some friends told me ETH had no power, no influence.
One even called it the “bitch coin.”
Others insisted it lacked dynamics, that it was doomed to trail behind Bitcoin forever.
But the chart… the chart said otherwise.
That’s why, as a trader, so often I close my ears and follow the chart.
📜 The Recap
From “Push North” in 2021, to the “1-2-X” setup, and the July Unicorn prophecy, ETH has kept its dance inside the quadratic regression channel for over 7 years.
In Part I, we called $4,000 the first milestone. Now, it’s reality.
♟ Bitcoin is King, Ethereum is Queen
With recent leadership changes bringing renewed energy and sharper marketing, plus the Petra upgrade quietly powering under the hood, ETH is stepping into the place it deserves. The queen is the most powerful piece on the chessboard — and in this market, Ethereum is moving exactly like one.
📊 What’s Different This Time
-Network activity is pushing toward record levels.
-Transaction counts are surging, signaling deeper engagement.
-The ETH vs BTC conversation is back, and capital rotation is happening in real time.
🛠 Levels I’m Watching:
$4,092 – Current resistance zone.
$6,034 – Mid-regression line, the next battleground.
$8,674 – Unicorn Zone. Euphoric breakout territory.
$3,372 – Short-term support. Below here, $2,912 is on deck.
💙 The Human Note
This run is proof: conviction matters. Sometimes the crowd is wrong, the noise is deafening, and the chart is the only friend that tells the truth.
Trade with discipline, but live with intention. Spend time with those you love. Build things worth remembering. And when you play the game, know when to move your queen.
The Unicorn has hit $4K. The Queen has entered the center.
Next move? Checkmate at $6K? We’ll see.
One Love ,
The FX PROFESSOR 💙
Disclosure: I am happy to be part of the Trade Nation's Influencer program and receive a monthly fee for using their TradingView charts in my analysis. Awesome broker, where the trader really comes first! 🌟🤝📈
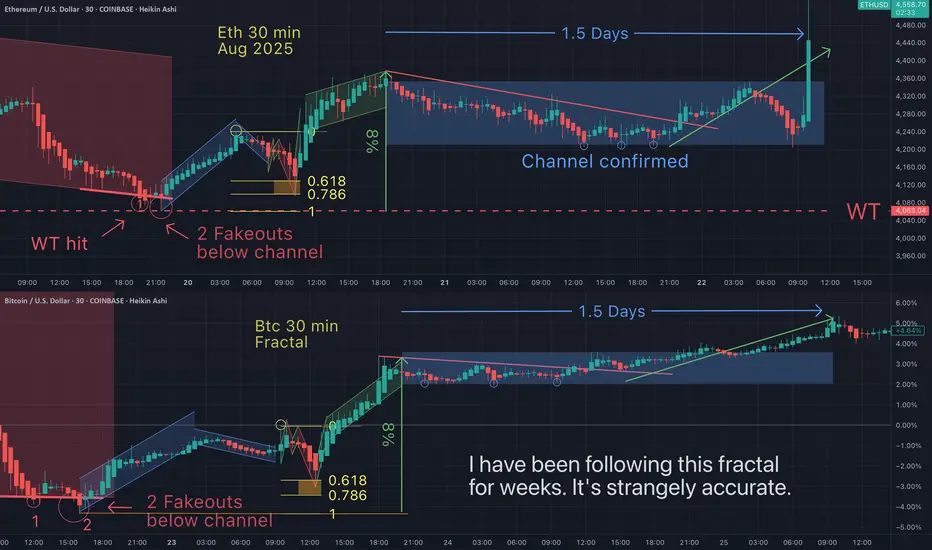
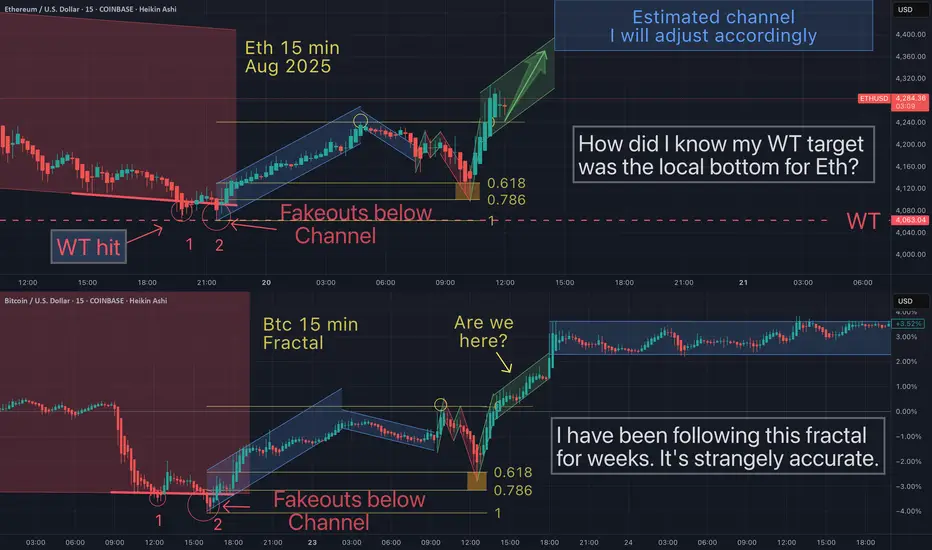
Eth- Continues to follow a strangely accurate fractal Aug 20th I suggested that Eth would enter a sideways channel. That is now confirmed. How could I have know that without a crystal ball?
Fractals are a mathematical anomaly. Price action "respects" these "trendlines" & patterns so perfecly. Yet on a graph (chart), this linear function has several veriables (y=mx+b). With this may variables in a linear equation, how do you explain fractals?
- Is human behavior just simply predictably repeating?
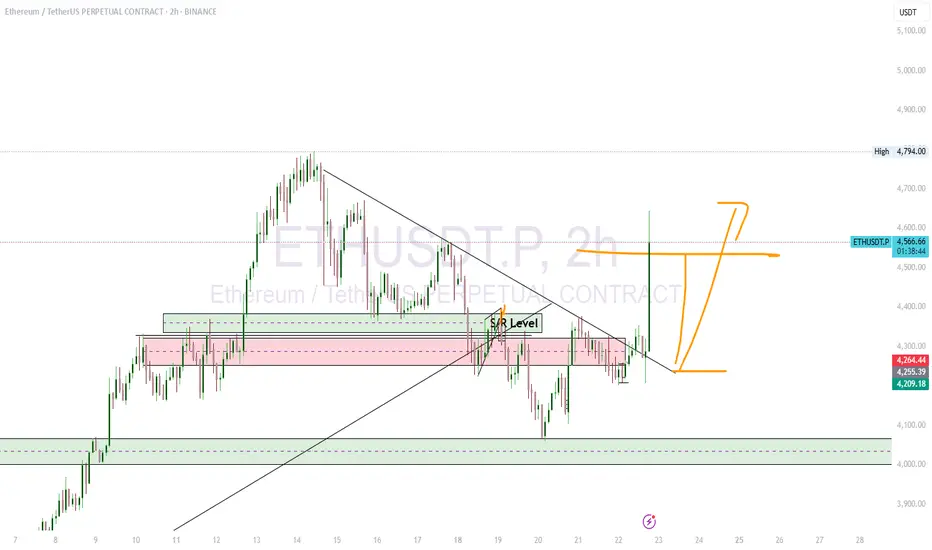
ETH/USDT Chart Analysis CRYPTO:ETHUSD ETH/USDT shows a strong upward move after a period of consolidation and a breakout from a descending trendline.
Bullish Momentum: The price has moved significantly higher from the S/R level and is currently trading at the higher end of the recent range.
Impulsive Move: The recent candle is a large green candle, indicating strong buying pressure and an impulsive move to the upside.
Potential Pullback: As mentioned in the previous analysis, the price may experience a pullback or a retest of the broken trendline. The strong move up could be followed by some profit-taking before a continuation of the trend. This is a common pattern in breakouts.
Key Levels: The price action confirms that the S/R level around $4,284 is a critical area. As long as the price stays above this level, the bullish structure remains intact. A break below this level could signal a false breakout and a return to the previous range.
ETH Bulls Eye $4,300 – Can This Rally Hold?ETH has spent the last week unwinding a down-leg from the upper supply band around 4,793.19 (top red dashed line). That decline stalled and based above the major demand shelf marked by the repeated green dashed line at 4,065.95. Notice how the blue B tags cluster along that shelf on Aug-18–21 and again on the latest pullback—each test was absorbed, then followed by impulsive buying. That’s the anchor of the bullish case: buyers have repeatedly defended 4,065.95, converting it into a primary swing floor.
From that base, price printed a higher low on Aug-21 and then a bullish impulse that reclaimed the prior breakdown area around 4,319.72–4,331.63 (mid red dashed band). The candle structure after the reclaim is constructive: shallow pullbacks, overlapping bodies, and no immediate rejection wicks at the reclaimed band. On this timeframe, that looks like a change of character from distribution to accumulation.
Above, you’ve got a series of upside reference points that stack neatly as targets. The first is the mid-range pivot at 4,375.04, which lines up with the center of the short red dashed channel and where sellers showed up previously (red S tags). If bulls chew through that, the path opens toward the unfilled pocket into 4,793.19 (top band, shown twice on the scale). The long box drawn on your chart reflects a similar idea: long from just above the reclaim, risk tucked below the demand shelf, and reward mapped into the prior supply.
Downside invalidation is straightforward. If ETH loses 4,065.95 on a closing basis, the next demand zones are well below at 3,737.06 and 3,357.14 (lower green dashed bands). Those levels only come into play if buyers capitulate at the shelf; until then, the market keeps rewarding dips into support.
A quick read of the swing map you’ve marked:
• Support cluster: 4,065.95 (primary), then 3,737.06, then 3,357.14.
• Reclaimed resistance/now pivot: 4,319.72–4,331.63.
• Interim target/resistance: 4,375.04.
• Major supply: 4,793.19.
The distribution of S tags is also telling. Earlier in the week they appeared aggressively near the mid-band; today, they’re thinner as price hugs the reclaimed zone, suggesting supply is being absorbed. Meanwhile, B tags continue to populate each higher low above 4,065.95, reinforcing that buyers are stepping in on dips rather than chasing highs—constructive behavior for a trend build.
Trading setup (from the chart)
• Bias: Long while price holds above 4,319.72–4,331.63 and especially 4,065.95.
• Entry zone: Retests of 4,319.72–4,331.63 or shallow dips into 4,312–4,325.
• Invalidation: 1H close below 4,065.95 (structure break).
• Targets: 4,375.04 (T1) → 4,431.63 (T2, top of the reclaimed band) → 4,793.19 (T3 major supply).
• Management: If T1 hits, trail to break-even; after a 1H close over 4,375.04, trail under the most recent higher low to stay with momentum.
Why this favors the bulls now
The market has established a sturdy floor at 4,065.95 with multiple successful defenses. Price has since reclaimed a prior breakdown region (4,319.72–4,331.63), which often flips to support on the next pullback and becomes a springboard. The lack of sharp rejection at that reclaim hints sellers are less aggressive than they were earlier in the week. With the next dense liquidity pocket at 4,375.04 and a vacuum above toward 4,793.19, the risk-reward of buying dips into the reclaimed band is attractive, provided risk is controlled under the shelf.
What would weaken this view
A failure to hold the next pullback into 4,319–4,332 followed by heavy selling back into the shelf would signal absorption is incomplete. If the shelf at 4,065.95 breaks on a closing basis, the bullish structure is invalidated and you’d expect a swift slide into 3,737.06 where the next meaningful demand sits. Until that happens, the sequence of higher lows above 4,065.95 is intact.
Tactical notes
Into 4,375.04, expect at least some reaction: that level capped several prior bounces and carries memory. If momentum is strong on approach (wide bodies, rising lows, no long upper wicks), partials at T1 and a tight trail can keep you in for 4,431.63 and 4,793.19. If momentum is weak (overlapping, small bodies), respect the level and get paid—don’t let a green trade turn red waiting for the extension.
Bottom line: as long as 4,065.95 holds and 4,319.72–4,331.63 acts as a launching pad on dips, the 1H structure supports a push first into 4,375.04 and—if buyers maintain pressure—an extension toward the 4,793.19 supply band.

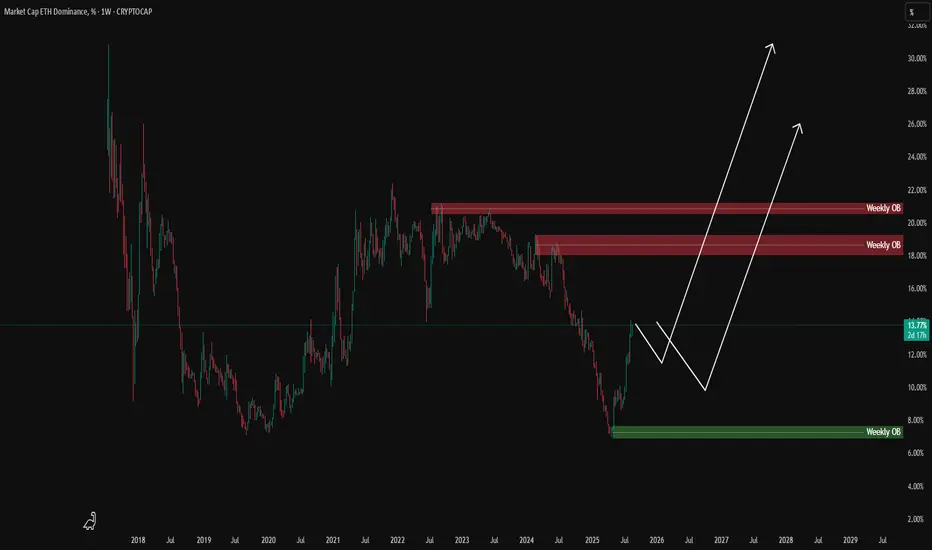
Altseason Checklist! To spot the beginning of an Altseason, there are several key charts you need to track on TradingView. These indicators show whether capital is really leaving Bitcoin and flowing into altcoins.
1. Altseason Starts with ETH
Almost every time, the first signs come from Ethereum (ETH). When ETH gains strength, the rest of the altcoins usually follow.
2. BTC Dominance (BTC.D) ⬇️
Condition: forming Lower Low / Lower High
Interpretation: money is rotating out of BTC and looking for better opportunities in altcoins.
3. ETH Dominance (ETH.D) ⬆️
ETH’s share of the market is increasing.
This shows Ethereum is taking leadership over the flow of capital.
4. ETH/BTC Pair (ETHBTC) ⬆️
Key: breakout to the upside with weekly confirmation
This ratio reveals whether ETH is truly outperforming BTC.
When ETHBTC breaks up ⇒ strong trigger for ETH leadership.
5. TOTAL2ES ⬆️
Represents market cap of all altcoins excluding BTC.
Growth here means real money is flowing into alts, not just cycling into stables.
6. TOTAL3ES ⬆️ (with delay)
Represents market cap of all altcoins excluding BTC and ETH.
When this chart starts rising ⇒ after ETH, the rest of the alts join in.
This is usually the final confirmation of Altseason.
7. USDT Dominance (USDT.D) ⬇️ or ↔️
Should move down or at least stay flat.
If it rises too much ⇒ capital is not entering alts, it’s parking in stablecoins ⇒ Altseason trap.
⚠️ Key Note – Watch Out for the Trap
The biggest trap is when BTC.D is dropping and ETH.D is rising, but USDT.D is also climbing.
That doesn’t mean Altseason – it means money is leaving BTC but hiding in stablecoins instead of flowing into alts.
📌 Summary:
Starts with ETH
Confirm with BTC.D ⬇️, ETH.D ⬆️, ETHBTC ⬆️
Money entering alts ⇒ TOTAL2ES ⬆️
Expansion to full alt market ⇒ TOTAL3ES ⬆️
Watch USDT.D to avoid the trap.
$ETH Bearish Outlook: #Ethereum has retested around the $4,059 CRYPTOCAP:ETH Bearish Outlook:
#Ethereum has retested around the $4,059 is a key support. Losing it could trigger a dump toward $3,500. If ETH fails to reclaim this level and gets rejected below, price could dump toward $3,500. Holding $3,500 may allow a recovery back above $4K, but a breakdown under $3,500 opens the way for deeper downside toward $2,960.
#ETH@CryptoSkullSignal
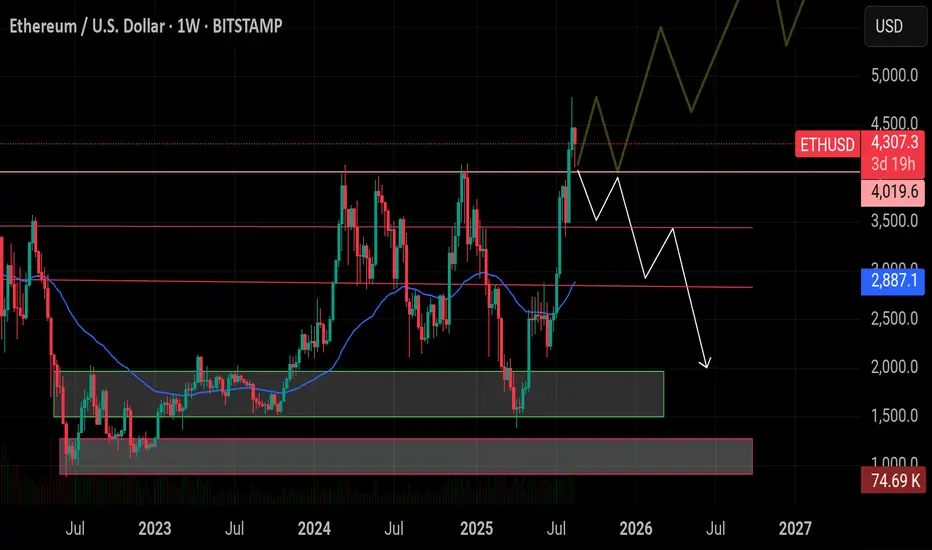
ETHEREUM - MAKE OR BREAK TIMECRYPTOCAP:ETH Is right at the downtrend line and if it decides to reject then we will most likely be heading down towards $3.8-$4k area.
Weekly WCB formed and the Daily (Top Right) is figuring out what it wants to do.

ibit Bitcoin ETF LONG now is a good time to invest. If you go on Google and type in far side Bitcoin and click the link that goes to the farside uk Bitcoin site. You'll see the daily money flows into or out of all of the different Bitcoin ETFs. If you do the same thing but type ethereum instead you'll see all of the different inflows and outflows of money into the ethereum ETF.
This is important because with the Bitcoin ETFs you'll see that there's been hundreds of million dollars in inflows in the past week. Yet both the 19th and the 20th had outflows of money. 1 and 1/2 weeks ago the same thing happened there were two days without flows of money and then it continued with major inflows of money.
In my opinion I believe this is because the large corporations and investors put too much money in to the ETFs in order to manipulate it so that it will gain a higher value.
They also talk to each other and plan these events so that they can profit from them. So let's take five fake companies that we just call 1 2 3 and 4 and 5. These five companies will all talk to each other on the phone and tell each other well we want to put in 200 million over the course of the week well we want to put in 300 million over the course of the week.
Over the course of one week
Company 1 wants to put in 200 million
Company 2 wants to put in 300 million
Company 3 wants to put in 400 million
Company 4 wants to put in 250 million
Company 5 wants to put in 300 million
Total 1.45 billion, they want that money to stay in Bitcoin at their investment.
Like I said they all plan this to manipulate Bitcoin in my opinion.
This is what happens:
Company 2 puts in 600 million
Company 2 puts in 700 million
Company 3 puts in 800 million
Company 4 puts in 450 million
Company 5 puts in 600 million
Total real investment 3.15 billion
Why do they do it?
This is only an example but over the course of one week these companies wanted to put in 1.45 billion but they ended up putting in 3.15 billion.
3.15 billion
1.45 billion -
-------
1.70 billion + surplus
So they put in 1.70 billion dollars over the amount that they were supposed to in order to get a rally going where Bitcoin goes up in value by a lot.
They are also in contact with the stock market listed Bitcoin mining companies so that the Bitcoin mining companies do not sell the Bitcoin. Instead they Bogart the Bitcoin (keep it) so that they can sell at a higher price when the companies get back in touch with them to say it's time to sell.
All of silicon valley is involved as well I believe in my opinion. All the tech companies and private investors with a lot of money and who knows maybe Mr SpaceX and Mr Amazon are also involved.
It's like a cabal. (Private political group) But for cryptocurrency.
So when this rally happens of course other people buy into the ETF like your average Joe. Hoping to profit.
What happens?
The ETF goes higher in value which means Bitcoin goes a lot higher in value. Maybe it will go up to 125,000 this time? Or maybe it will go up to 130,000 this time before going down?
What's the point?
The point is they are going to be selling that 1.7 billion dollar surplus because they only had 1.45 billion that they were going to put in.
That 1.7 billion dollar surplus that got the rally going and when it's time to sell could possibly be worth 7% to 8.5% more. Plus they're all putting in their own money into it because it's like insider trading. When you're putting your money into a stock as an institutional investor of course you're going to put your own money into it too so these people are putting 50 million dollars by themselves, 500 million by themselves. Who knows?
So surplus of 1.7 billion + 7% is now worth 1.819 billion or a gain of 119,000,000 million dollars. So they sell and they make $119 million for their company. Plus how much do they make for themselves and all of their cohorts that they are in contact with?
Insider trading at its finest.
This happens with all companies. Take for instance an airline. Companies know that maybe airlines will go up in the summer. Or they know that it will go up in the travel season for the holidays Thanksgiving and Christmas. So all the different companies they get in touch with each other and they say hey we're going to buy $5 billion of airline one and then the other company tells them okay we're going to buy 2 billion of airline one. Of course again they're all putting in their own money as well.
The Bitcoin rally is not over. We may see as high as 138,000 this rally. Before the bear market hits.
Some say we could see 420,000. I'm not sure about that I wonder if that's for the next rally in 2028 after the halving?
Will you take a leap of faith and do the right thing for humanity and leave a comment under this post with what your opinion is?

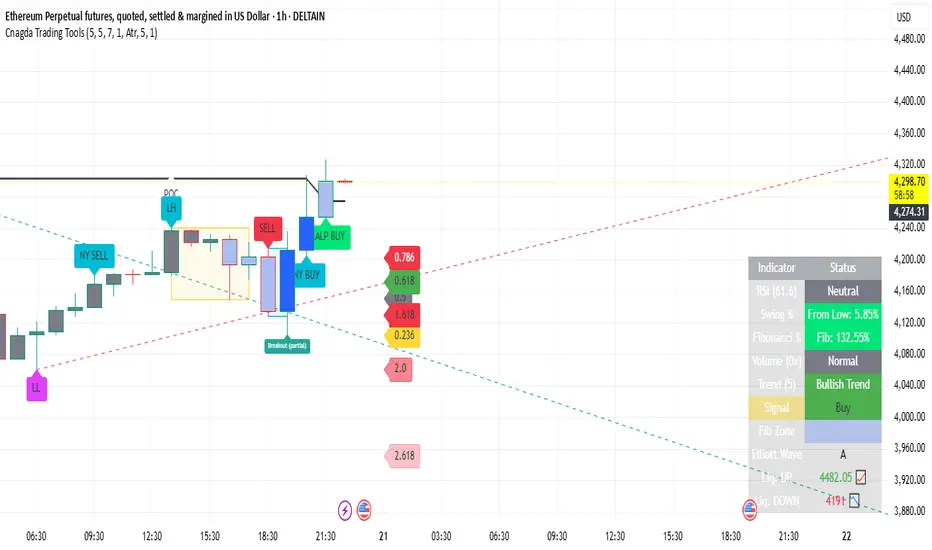
Where is ETH Headed Next? Clear Entry & Exit PlanCurrent Status (August 20, 2025, 1H Chart) Eth
Price: 4,310.40 USD (1-hour close)
Day High: 4,327.60 USD
Day Low: 4,253.65 USD
Change: +1.32% (large positive candle)
1. Trend and Momentum Indicator wise:
Almost all signals are bullish:
Mid-term moving averages (EMA/WMA) are pointing upwards.
Trend line breakouts and labels like “BUY”/“SCALP BUY” may appear.
Volume is also supporting – “High” or “Above Avg” on the dashboard.
RSI will also be above 50 – a sign of continued strength in the trend.
2. Next targets (Fibonacci Extensions)
Potential targets estimated from Fibonacci levels:
1.618 Extension: First resistance/target (approx. zone above current price)
2.0 Extension: Second target
2.618 Extension: Last/aggressive target
These levels are drawn automatically by Cnagda Indicator, and based on them price may pause, or reverse with weak volume.
3. Where can reversal happen?
Reversal Zone:
If RSI moves near or above 70 and price touches Fibonacci 1.618 or 2.0 extension – short term top or reversal is expected there.
If dynamic labels “SCALP SELL”, “SELL”, or “Breakout (red/orange)” are shown, it will be a reversal area.
If the "Signal" line in the dashboard becomes "Strong Sell" or "Sell" – the possibility of reversal increases a lot.
4. Entry-Exit Trading Plan
Entry (Long):
Entry Trigger:
When "BUY", "SCALP BUY" or "Breakout" (lime/green label) appears, and price volume and RSI give confirmation.
Stoploss:
Slightly below previous swing-low (dashboard or Fibonacci low zone)
Target (Long):
Primary target: 1.618 Fibonacci Extension (from Fib Levels line)
If strength continues: 2.0 or 2.618 Extension (hold position from trailing SL)
Partial Exit: "Liq. UP" from dashboard table
Reversal/Short Entry:
If “SELL” or “SCALP SELL”/Breakout is shown at the higher level and dashboard is "Sell/Strong Sell" – go short.
Plan short only if volume is falling, RSI is 70+ (overbought).
Target: Fibonacci 1.0, 0.618, or "Liq. DOWN".
Takeaway for Readers:
"Ethereum is currently bullish in trend and there is a high chance that it will touch the next Fibonacci extension levels (1.618/2.0/2.618) -
But as soon as the reversal label appears in the overbought zone or with strong volume, profit booking will be justified.
The perfect trading plan is:
Take trades according to the trend and the direction of the Cnagda Indicator.
Entry only on your signal, and target on the Fib level.
Take reversals only on clear confirmation of the table and signal."
Author Note:
This article is completely based on the Pine Script indicator which is as advanced as "Cnagda Trading Tools" - do not rely on anything other than real-time algorithmic signals...
Eth has been following this exact Btc fractalIn the world of graphing (charting) and linear equations, the concept of "fractals" would be mathematically improbable. But in charting, fractals work - until they dont. Fractals usually stop working as an exact map when you LEAST expect (or want) then to.
ETH Swing Long with High RRHTF Swing Long Idea with a high RR and tight invalidation which might play out in the next few days, if we see a slightly deeper correction on BTC (c. 109k), or later on down the road.
Confluence around 3.8k with 0.705 FIB (3,777), 3D Breaker Block, and two upward sloping trend lines. There is additional timing confluence for Sunday - which for the past 4 weeks has been a Strong Buy, especially Asia Morning session (GMT +8).
Entry: 3,794
SL: 3,720 (-1.95%)
TP1: 4,788 (+28%)
TP2: 7,400 (+95%)
A deeper / longer BTC correction invalidates.

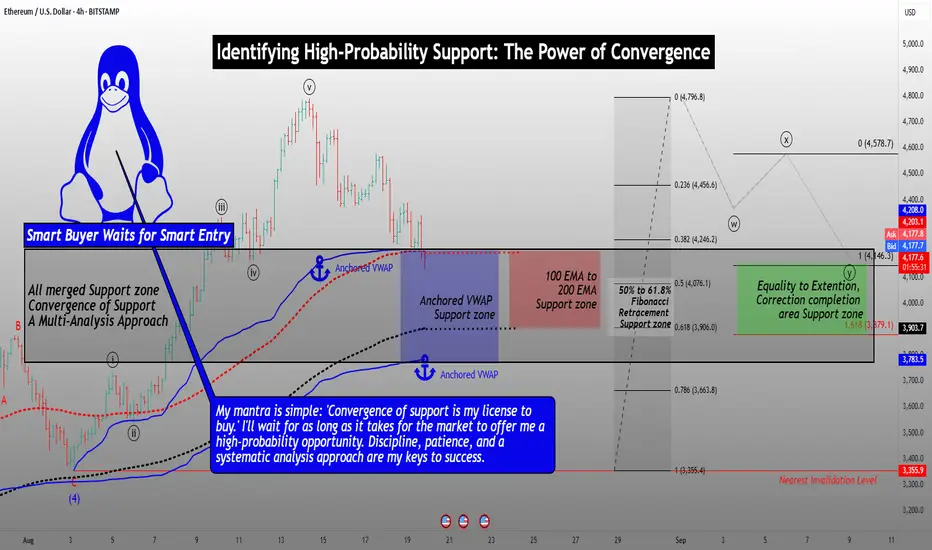
Identifying High-Probability Support: The Power of ConvergenceHello Friends,
Welcome to RK_Chaarts
Today we're going to learn Comprehensive Guide to Identifying Convergent Support Zones
Which are High Probability Support areas. This post is for Educational purpose only.
This detailed analysis will walk you through a step-by-step process of combining multiple technical analysis methods to identify a robust support zone. We'll explore how Elliott Wave theory, Anchored VWAP, EMA200, Fibonacci Retracements, and equality to extensions can coincidentally converge on the same support zone.
Step 1: Elliott Wave Analysis
Begin by identifying the Elliott Wave structure. Look for impulse waves, corrective waves, and the relationships between them. In this example:
- Wave Y is potentially completing near the equality zone (100% to 161.8% extension).
- This level marks a potential reversal point.
Support zone as per Elliott Wave theory Analysis
Step 2: Anchored VWAP Analysis
Apply Anchored VWAP to identify key support levels:
- Plot the VWAP from the last swing low and the second-last swing low.
- Note the convergence of these VWAP levels, which can indicate strong support.
Support zone as per Anchored VWAP Analysis
Step 3: EMA200 Analysis
Add the 200-period Exponential Moving Average (EMA) to your chart:
- The EMA200 has consistently provided support during previous corrections.
- Note the price approaching this level, increasing the likelihood of a bounce.
Support zone as per 200 Exponantial Moving Average
Step 4: Fibonacci Retracement Analysis
Apply Fibonacci retracements to the previous rally:
- Identify the 50%, 61.8%, and 78.6% retracement levels.
- Note the current fall has already exceeded the 38% retracement.
Support zone as per Fibonacci Retracement Analysis
Step 5: Convergence of Support Zones
Combine the analysis from each step:
- Note the striking convergence of support zones:
- Elliott Wave equality zone (100% to 161.8% extension)
- Anchored VWAP support zone
- EMA200 support level
- Fibonacci retracement zone (50%-61.8%)
Coincidentally all these are providing nearly same Support area (Price zone)
Trading Implications
With the convergence of these multiple analysis methods, you can:
- Identify a high-probability support zone.
- Look for buying opportunities near this zone.
- Monitor price action and market sentiment for confirmation of a reversal.
- Consider scaling into positions or setting limit orders within the support zone.
Important Note: Failure to Hold Support
If the price fails to hold support at this converged zone, it may indicate a stronger bearish trend. In this scenario:
- Be prepared for a potential significant downfall.
- Consider adjusting your trading plan to account for the increased bearish momentum.
- Keep a close eye on price action and market sentiment for further guidance.
By understanding the convergence of these multiple analysis methods and being aware of the potential risks, you'll be better equipped to make informed trading decisions and navigate the markets with confidence.
I am not Sebi registered analyst.
My studies are for educational purpose only.
Please Consult your financial advisor before trading or investing.
I am not responsible for any kinds of your profits and your losses.
Most investors treat trading as a hobby because they have a full-time job doing something else.
However, If you treat trading like a business, it will pay you like a business.
If you treat like a hobby, hobbies don't pay, they cost you...!
Hope this post is helpful to community
Thanks
RK💕
Disclaimer and Risk Warning.
The analysis and discussion provided on in.tradingview.com is intended for educational purposes only and should not be relied upon for trading decisions. RK_Chaarts is not an investment adviser and the information provided here should not be taken as professional investment advice. Before buying or selling any investments, securities, or precious metals, it is recommended that you conduct your own due diligence. RK_Chaarts does not share in your profits and will not take responsibility for any losses you may incur. So Please Consult your financial advisor before trading or investing.