ETH Swing Long with High RRHTF Swing Long Idea with a high RR and tight invalidation which might play out in the next few days, if we see a slightly deeper correction on BTC (c. 109k), or later on down the road.
Confluence around 3.8k with 0.705 FIB (3,777), 3D Breaker Block, and two upward sloping trend lines. There is additional timing confluence for Sunday - which for the past 4 weeks has been a Strong Buy, especially Asia Morning session (GMT +8).
Entry: 3,794
SL: 3,720 (-1.95%)
TP1: 4,788 (+28%)
TP2: 7,400 (+95%)
A deeper / longer BTC correction invalidates.
Ethlong

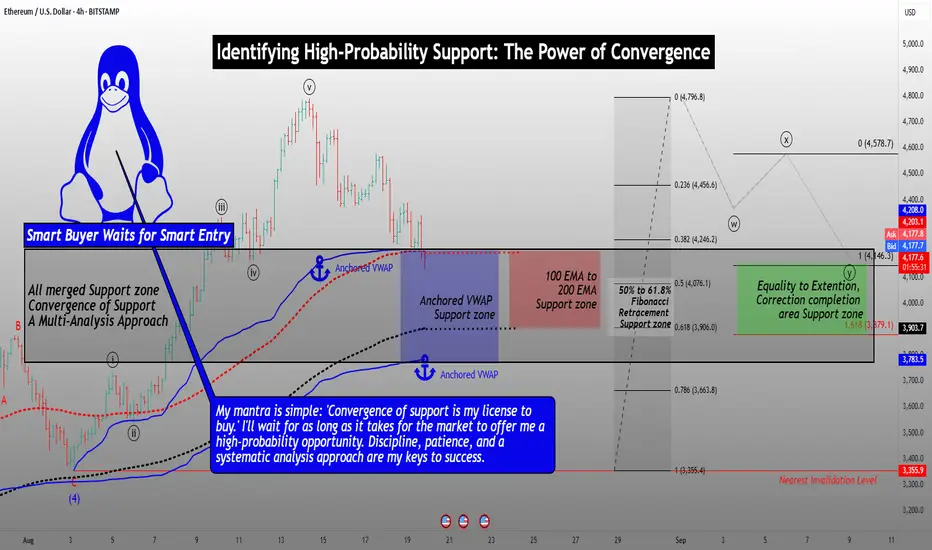
Identifying High-Probability Support: The Power of ConvergenceHello Friends,
Welcome to RK_Chaarts
Today we're going to learn Comprehensive Guide to Identifying Convergent Support Zones
Which are High Probability Support areas. This post is for Educational purpose only.
This detailed analysis will walk you through a step-by-step process of combining multiple technical analysis methods to identify a robust support zone. We'll explore how Elliott Wave theory, Anchored VWAP, EMA200, Fibonacci Retracements, and equality to extensions can coincidentally converge on the same support zone.
Step 1: Elliott Wave Analysis
Begin by identifying the Elliott Wave structure. Look for impulse waves, corrective waves, and the relationships between them. In this example:
- Wave Y is potentially completing near the equality zone (100% to 161.8% extension).
- This level marks a potential reversal point.
Support zone as per Elliott Wave theory Analysis
Step 2: Anchored VWAP Analysis
Apply Anchored VWAP to identify key support levels:
- Plot the VWAP from the last swing low and the second-last swing low.
- Note the convergence of these VWAP levels, which can indicate strong support.
Support zone as per Anchored VWAP Analysis
Step 3: EMA200 Analysis
Add the 200-period Exponential Moving Average (EMA) to your chart:
- The EMA200 has consistently provided support during previous corrections.
- Note the price approaching this level, increasing the likelihood of a bounce.
Support zone as per 200 Exponantial Moving Average
Step 4: Fibonacci Retracement Analysis
Apply Fibonacci retracements to the previous rally:
- Identify the 50%, 61.8%, and 78.6% retracement levels.
- Note the current fall has already exceeded the 38% retracement.
Support zone as per Fibonacci Retracement Analysis
Step 5: Convergence of Support Zones
Combine the analysis from each step:
- Note the striking convergence of support zones:
- Elliott Wave equality zone (100% to 161.8% extension)
- Anchored VWAP support zone
- EMA200 support level
- Fibonacci retracement zone (50%-61.8%)
Coincidentally all these are providing nearly same Support area (Price zone)
Trading Implications
With the convergence of these multiple analysis methods, you can:
- Identify a high-probability support zone.
- Look for buying opportunities near this zone.
- Monitor price action and market sentiment for confirmation of a reversal.
- Consider scaling into positions or setting limit orders within the support zone.
Important Note: Failure to Hold Support
If the price fails to hold support at this converged zone, it may indicate a stronger bearish trend. In this scenario:
- Be prepared for a potential significant downfall.
- Consider adjusting your trading plan to account for the increased bearish momentum.
- Keep a close eye on price action and market sentiment for further guidance.
By understanding the convergence of these multiple analysis methods and being aware of the potential risks, you'll be better equipped to make informed trading decisions and navigate the markets with confidence.
I am not Sebi registered analyst.
My studies are for educational purpose only.
Please Consult your financial advisor before trading or investing.
I am not responsible for any kinds of your profits and your losses.
Most investors treat trading as a hobby because they have a full-time job doing something else.
However, If you treat trading like a business, it will pay you like a business.
If you treat like a hobby, hobbies don't pay, they cost you...!
Hope this post is helpful to community
Thanks
RK💕
Disclaimer and Risk Warning.
The analysis and discussion provided on in.tradingview.com is intended for educational purposes only and should not be relied upon for trading decisions. RK_Chaarts is not an investment adviser and the information provided here should not be taken as professional investment advice. Before buying or selling any investments, securities, or precious metals, it is recommended that you conduct your own due diligence. RK_Chaarts does not share in your profits and will not take responsibility for any losses you may incur. So Please Consult your financial advisor before trading or investing.
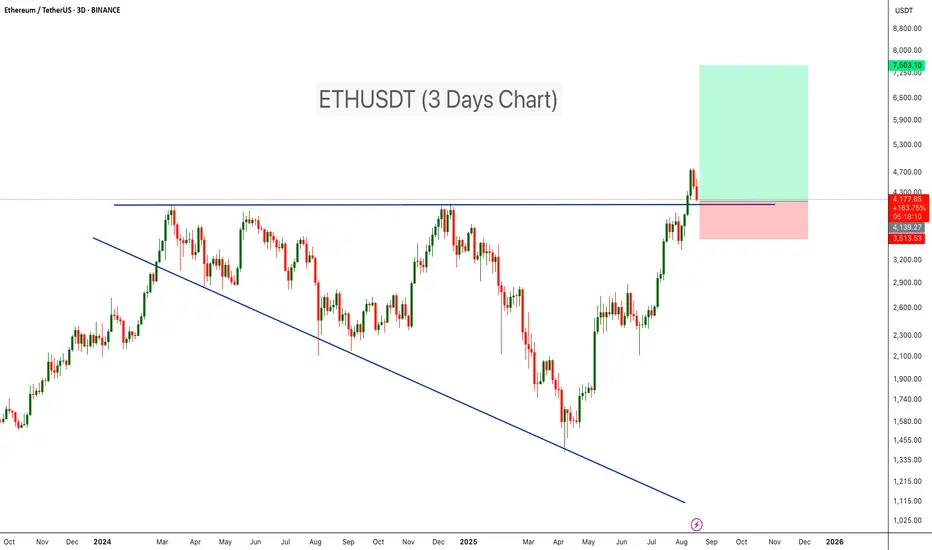
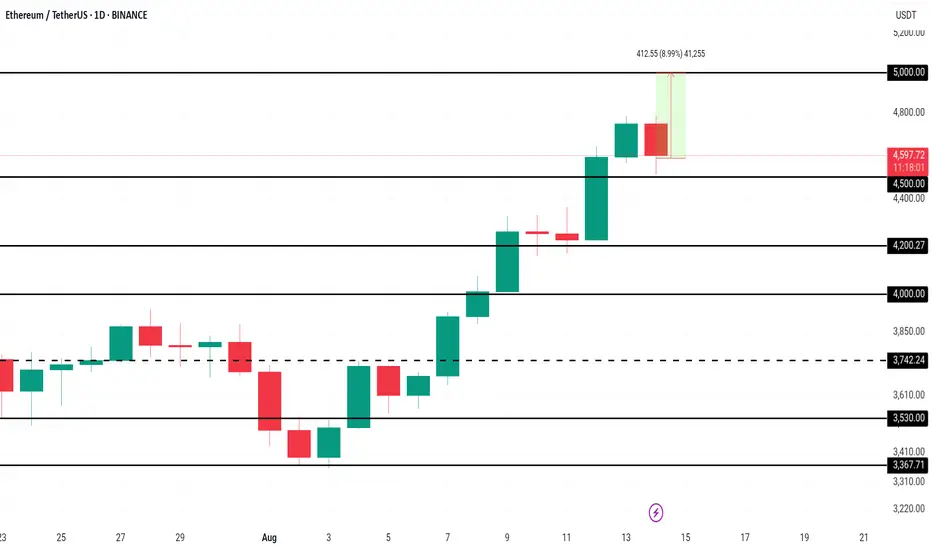
Ethereum Retesting Major Breakout ZoneBINANCE:ETHUSDT has completed a major breakout from a Broadening Wedge Pattern and is now retesting the wedge’s resistance line as support — a bullish continuation signal on the higher timeframe.
- Broadening Wedge Formation: ETH traded within a large broadening wedge throughout 2024 into early 2025, forming expanding highs and lows.
- Breakout Confirmation: The breakout above wedge resistance ($4,10) confirms bullish momentum and shifts market structure in favor of buyers.
-Retest in Progress: Price is currently pulling back, testing the former wedge resistance as fresh support — a textbook technical setup.
-Volume Validation: The breakout was accompanied by a surge in volume, strengthening the case for continuation.
🔷Entry Zone: $4,100 – $4,300
🔷Stop Loss: Below $3,500 to protect against a failed retest.
🔷Targets: $6,500 – $7,500
Cheers
Hexa
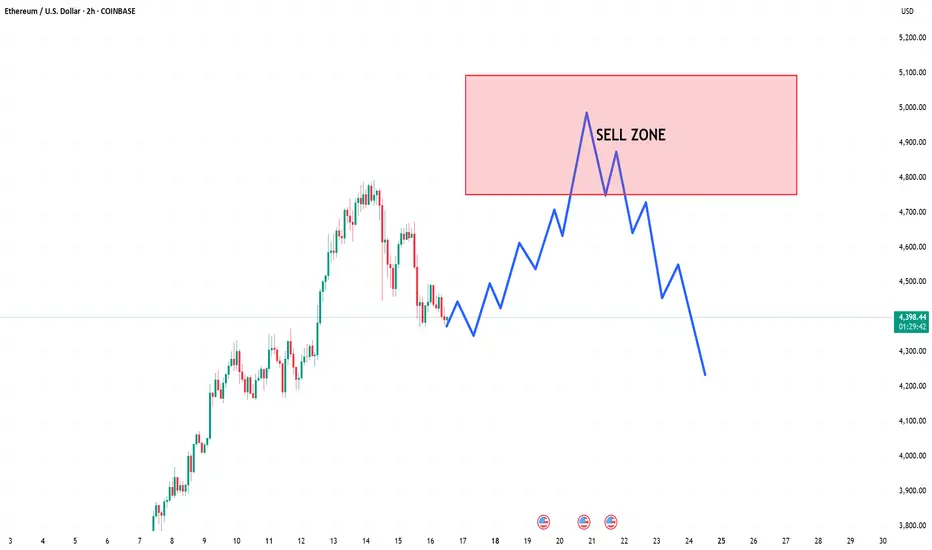
ETH/USD: Will ETH Crash Back to $3,800?Ethereum has demonstrated a strong bullish trend in August, with prices approaching key resistance levels. Analysts suggest that a sustained break above $4,800 could propel ETH toward $5,500–$6,000 by the end of the month.
Institutional interest remains robust, with significant inflows into Ethereum-based ETFs and increased holdings by digital asset treasury firms like Bitmine Immersion Technologies and Sharplink Gaming.
* Resistance Levels: $4,800, $5,000, $5,500
* Support Levels: $4,000, $3,800
* Key Indicators: Strong Relative Strength Index (RSI) and bullish Moving Average Convergence Divergence (MACD) suggest continued upward momentum.
Ethereum is poised for a potential breakout. A decisive move above $4,800, supported by strong trading volumes, could initiate a rally toward $5,500–$6,000. Conversely, a drop below $4,000 might lead to a retest of the $3,800 support zone.

Pepe looks ready to blast off [long]Pepe is equip to blast off into the metasphere. Just look at the squeeze moment indicator on the two week. Would you look at that. Just look at it. Look at it. Just look at it. Would you look at that.
Even on the weekly time frame PepeUSDT looks ready for a large green D.
I like to use that pmar to get a feel for what it's really going to do. It looks like it has A LOT of room to move
The daily time frame doesn't look so hot. The squeeze is in the green already. However Every other time frame less than one day so 14 hours 12 hours 10 hours etcetera etcetera they're all pointing to the fact that we're going into the green.
GOOD NEWS! Have you found a paid indicator that works wonderfully? Let me know and I will recreate it for you by it and I'll invite you to have access to. I won't give it out freely To everyone. It will just be myself and you that has it. so send me with the indicator and I'll code it up for you! Send me a DM with to the paid version like their website which tells about it and I will recreate it for you.
MORE GOOD NEWS!
I'm going to be calling hot solana meme coins very soon so MAKE SURE TO FOLLOW ME! The fact is there's a secret... I won't be just blatantly writing a message like this with an analysis I will only be changing my profile picture to the coin's name. so you'll have to visit my profile often. I will leave the date in my bio and I will write "updated 08/18/25 6:16PM" As an example so you know exactly when the signal was called. so make sure to follow me!
Make sure to like this post. That way it will help me to gain more followers and it will help all of us. do your part to help me and I will help you immensely.
Sincerely,
rocket

ETHUSDTBINANCE:ETHUSDT is overall trend in the 4-hour timeframe is bullish, with strong buying momentum. The price is currently at the 4200 USD resistance, and if this level breaks, the next target will be around 4500 USD.
Supports:3950 USD, 3730 USD, 3350 USD
Resistances: 4200 USD, 4500 USD
⚠️Always apply proper risk management.

ETH_USDT I'm expecting ETH will fill the CME Gap and Turn the Market from That Demand Zone. So you can catch a best trade with your confirmations.
HAPPY TRADING 💐

ETHETH make ATH and gave us a breakout and now retesting the breakout and also giving respect to the SR level which was the previous high.
What i see it hunt the long side liquidity and now gonna make a new ATH soon

What will happen to Bitcoin in the end?Hello friends
Bitcoin has made a correction in this 4-hour timeframe after its rise and is now in a range. Considering the waves formed, it is expected to move upwards and form wave D if the important resistance is broken by the buyers.
The price may remain in this range for a while, so be patient.
Now, for a safe entry, we can let the resistance or support be broken validly and then enter.
The specified price range can be our target and it makes sense to take profit in that area.

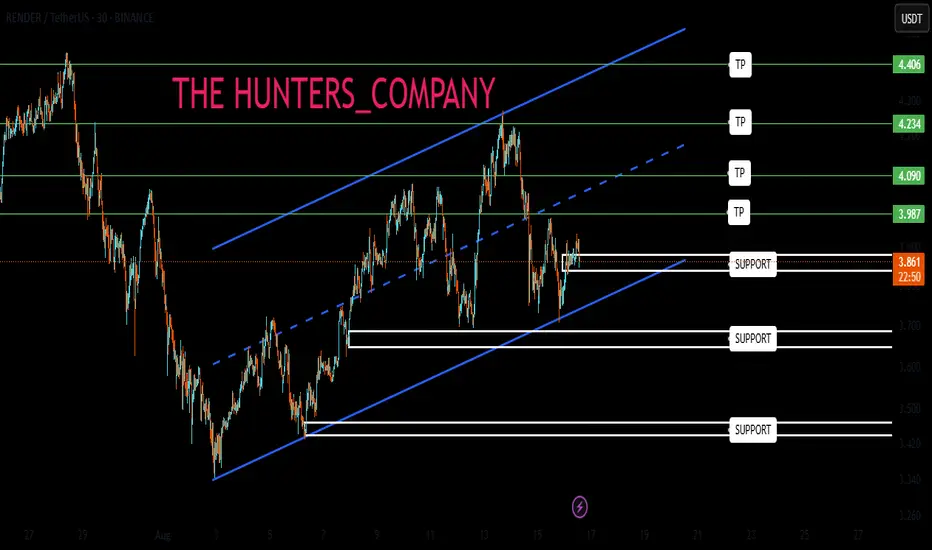
RENDER: Buyers arrivedHello friends
Given the decline we had, we see that buyers entered and created an ascending channel.
Now that we are at the bottom of the channel, we are in an important support area.
Of course, two other important support areas are also located further up, which if supported by the price, can move to the specified resistances.
*Trade safely with us*
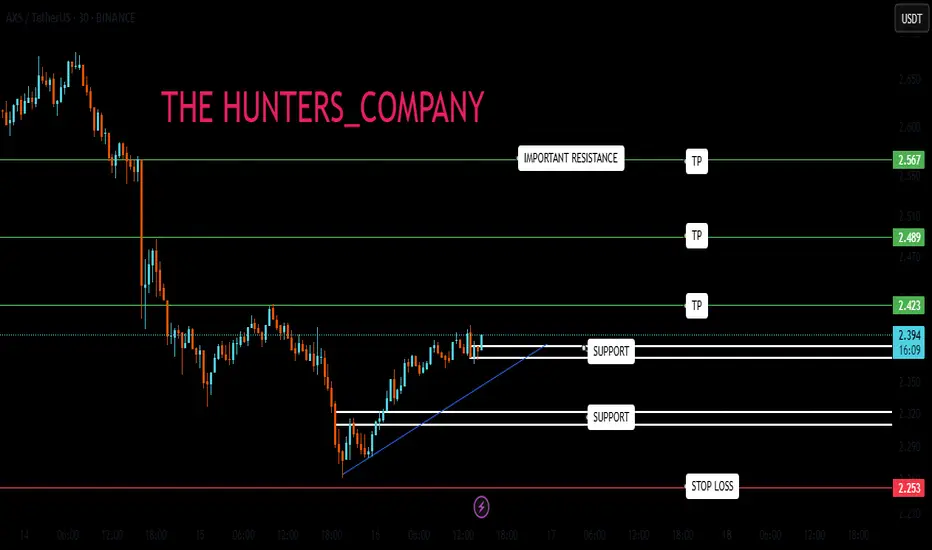
AXS : Buy signal?Hello friends
Given the decline we had, the price has recovered well and gone up.
Now, if the specified support area is maintained, it can move to the specified resistances.
If it continues to decline, we have a more important support below, which can be a good support, but if it declines further and the stop loss is broken, it means that our trend is down.
*Trade safely with us*
RAY : razor edgeHello friends
Given the price growth we had, the price is now in a triangle, which is now in an important area in the triangle. If the price is supported and our triangle is broken, it can move to the identified resistance areas, which are price pivots.
But if the support breaks and the price falls, the identified important supports can be the next price targets.
*Trade safely with us*

Ethereum Price Aims at $5,000 As Exchange Balance Falls To 9-YeaBINANCE:ETHUSDT is currently priced at $4,531 , positioned just above the $4,500 resistance. The broader indicators, suggest a favorable environment for a breakout. On-chain data highlights a key trend supporting Ethereum’s macro outlook.
Exchange balances have dropped to a nine-year low of 14.88 million BINANCE:ETHUSDT , signaling that investors are moving their holdings into long-term storage.
If BINANCE:ETHUSDT manages to reclaim $4,500 as support , the uptrend could accelerate. This move would help the cryptocurrency push through the next resistance at $4,749, paving the way for a test of the $5,000 mark.
However, risks remain if investor sentiment shifts suddenly. Should holders decide to secure profits, BINANCE:ETHUSDT could slide toward $4,200 or even $4,000 . Such a decline would weaken the bullish thesis, opening the door to consolidation instead of continuation of the current uptrend.

ETH on track for new All-Time Highcurrently, Ethereum is moving within a channel on the daily timeframe and the midline of the channel has temporarily limited further price growth. this price correction could present an entry opportunity for those who missed the 2000$, or a chance for re-accumulation. however the overall trend remains bullish. the support lines are clearly marked on the chart and it is expected that ETH will reach a new all-time high in the future, with the potential to grow up to $8000
ichimoku analysis was also used, but it has been removed for chart clarity.

ETH will bounce to All Time HighEthereum is entering a Buy zone at $4,300, and it's ready for a bounce to an all-time high.
Opening a leveraged Long position with TP at $4,850
ETH: LIVE TRADEHello friends🙌
✅Given the good rise we had, we had a small correction that was a buying opportunity and there is another support area where we can buy the second step in case of further correction.
We have also specified targets for you, be careful and do not act emotionally and observe capital and risk management.
🔥Follow us for more signals🔥
*Trade safely with us*

Will $ETH remain bullish below $4,000?Ethereum hasn’t yet broken above its previous ATH.
The colorful lines you see are mostly Fibonacci retracement & extension levels, tools traders use to identify potential support and resistance zones.
• Support: a level where price might stop falling and bounce (e.g., $4,141, blue line).
• Resistance: a level where price might struggle to go higher (e.g., $4,728 and $4,781, red lines).
The RSI (Relative Strength Index) shows market momentum:
• Above 70 = overbought (possible pullback).
• Below 30 = oversold (possible bounce).
Currently, RSI is at 25.82, indicating oversold conditions, which could lead to a bounce, though oversold doesn’t guarantee an immediate reversal.

#ETH/USDT Long after pull-back #ETH
The price is moving within a descending channel on the 1-hour frame and is expected to break and continue upward.
We have a trend to stabilize above the 100 moving average once again.
We have a downtrend on the RSI indicator that supports the upward move with a breakout.
We have a support area at the lower limit of the channel at 4465, acting as strong support from which the price can rebound.
We have a major support area in green that pushed the price upward at 4400.
Entry price: 4530.
First target: 4666.
Second target: 4797.
Third target: 4992.
To manage risk, don't forget stop loss and capital management.
When you reach the first target, save some profits and then change your stop order to an entry order.
For inquiries, please comment.
Thank you.

The season of Ethereum has arrived!
Do you know that Ethereum is currently the strongest coin in the market?
Even its targets and chart look stronger than Bitcoin’s.
Exactly 4 months ago, I posted an Ethereum analysis saying it had reached its lowest bottom, and at that time its price was exactly $2,180.
Take a look at the chart below.
Now my view is playing out, and Ethereum is only a few steps away from a new all-time high.
But did you know it’s still early, and you haven’t missed the opportunity yet?
Ethereum just broke a megaphone pattern on the weekly timeframe with a massive candle.
Even with all this upward movement, it only started breaking the pattern in the last couple of days, and it still has around 5% left to climb before hitting a new peak and entering price discovery mode.
And even with the crash that happened yesterday, it didn’t drop much and bounced back very quickly, as if it were just a normal day.
Overall, Ethereum will be in the 5-digit range—just like I told you exactly 4 months ago, when many didn’t believe it—and it will reach that by the end of the year. Remember my words, just like every time I’ve told you before.
Best Regards:
Ceciliones🎯

$Eth Ethereum nearing critical resistance....All Time High soon!This is a weekly candlestick chart of ETHUSD
Current price: 3800
CRYPTOCAP:ETH Ethereum recently broke out of a long-term downtrend, indicated by the red diagonal trendline. Price action has shifted from bearish to bullish. This is also a show of strong Momentum as recent candles are large and green, showing aggressive buying (strong bullish pressure).
If #eth continues in this uptrend then here are the resistance above to watch: 4000, 4800 and possibly new all time highs at 5600, 6400
Note worthy to know that the areas between 3800-4000 is very critical resistance.
Assuming a retracement from this resistance, Ethereum remain bullish above 2900
Invalidation of this idea is under 2900

Ethereum Price Nears $5,000 After 3.5 Years; Will It Succeed?Ethereum is currently trading at $4,723, just 5.8% away from the $5,000 milestone. The asset has secured $4,500 as a solid support level, further strengthening its bullish outlook. This three-and-a-half-year high is energizing buyers, who see $5,000 as the next key target.
With robust whale accumulation, record futures interest, and positive funding rates, Ethereum’s path toward $5,000 appears intact. Once this level is breached, momentum could carry the price even higher, potentially targeting $5,500 in the following weeks.
However, the bullish scenario hinges on investor sentiment holding firm. If traders pivot to profit-taking, ETH could drop below the $4,500 support. A sustained move under this level might push prices toward $4,200, undermining the current uptrend and delaying further gains.
$4,794 Barrier in Sight: ETH’s Next Stop $5,200?ETH has been in a strong upward channel since August 6, with the price consistently respecting the rising trendline. The structure remains firmly bullish, showing a series of higher highs and higher lows. Every dip over the past week has been met with strong buying pressure, suggesting that bulls remain in control.
Currently, ETH is hovering just under the $4,794 resistance zone, which is the last major hurdle before the psychological $5,000 level. Above this, the chart shows a target zone at $5,200, which aligns with the upper projection from the recent bullish swing. On the downside, the immediate support is at $4,331, with a deeper cushion around $3,941 in case of a pullback.
The buy and sell markers on the chart show that most recent buy signals occurred during shallow retracements, while the clustered sell signals in earlier phases have been invalidated by continued upward momentum. The risk/reward setup is clearly favorable for bulls, with the stop placed well below the current price action and the profit target extending into fresh highs.
Trade Setup 📊
• Entry: $4,735.99
• Stop Loss: $4,538.41
• Take Profit: $5,200
• R:R Ratio: 2.35
• Bias: Bullish
As long as ETH holds above $4,538 and the ascending trendline remains intact, the probability favors a push through $4,794 toward $5,000 and eventually $5,200. A clean breakout with volume would confirm continuation, while a failure to hold the support could invite a short-term retracement. Booking partial gains near $5,000 and trailing stops is recommended to protect profits.

Ethereum ETH Pullback Into Support Could Lead to Another Rally📊 Taking a close look at ETH/USDT, the market has recently shown bullish intent after a break of structure on the daily 📈. From a Wyckoff perspective, price is currently reaching into a key resistance zone. Im looking for a retrace into support and, potentially forming an accumulation phase. I’ll be watching for a shakeout below support — followed by a strong rally. If this confirms with a bullish market structure break, it could offer a high-probability long setup 🔍💡🚀 (not financial advice).
