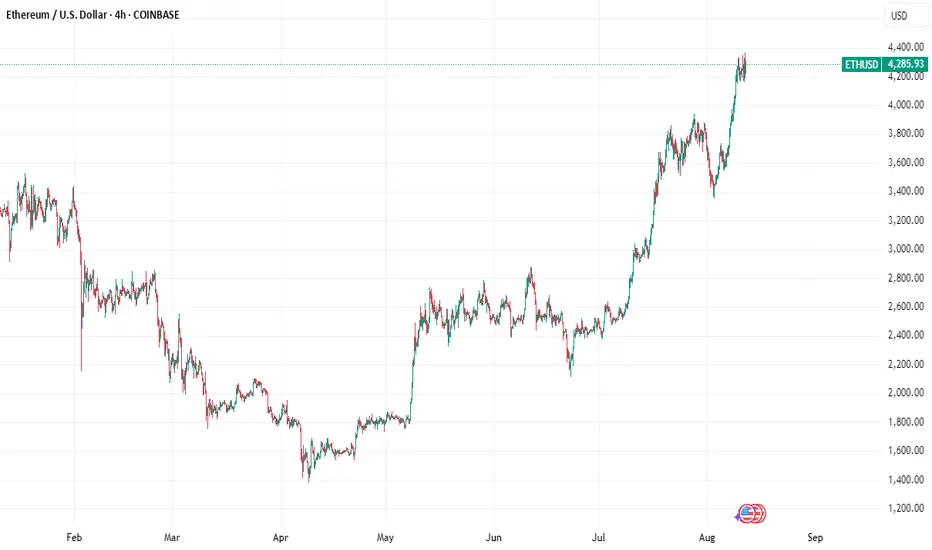
ETHUSD 4 Hour Chart. Wave 3 possible targetsAs ETHUSD becomes more bulish, possible targets for this extended Wave 3 we are currently surfing.
Ethlong

ETHUSD big bada bing is going to the endI was expecting ending diagonal in my latest post, but that never worked out. It's clear impulse wave, and unfortunately it's last in the current bigger wave. There are some rules applying which we can highlight the target zone of the last impulse, it's on the chart. I believe there will be strong resistance at +-5k. It's not the end for ETH though, there must be some flat or triangle much longer in time after which the ascending move will continue. Good luck!

$ETH has broken above the $4,000 resistance, CRYPTOCAP:ETH has broken above the $4,000 resistance, with short-term targets at $4,800–$5,000, and a potential retest zone around $4,050 for continuation.
ETHUSDT, Is it time for the biggest Altcoin?Hi fellow traders, ETHUSDT will be ready to make a move higher from the blue box after it completes the flag correction in ABC formation. Target will be 3429.75. Good luck and trade safe!


Can ETH Reach $8,500 Amidst Bullish Catalysts and Threats?A confluence of unprecedented institutional buying, feverish derivatives activity, and bullish technical patterns has ignited the Ethereum market, propelling its price to multi-year highs and sparking bold predictions of a surge to $8,500 and beyond. This rally, however, is not without its skeptics, who point to signs of overheating, increasing profit-taking, and the ever-present shadow of a market cycle peak.
The world's second-largest cryptocurrency has been on a tear, with its price climbing significantly in a single month and nearing its all-time high. This powerful upswing has shifted the crypto world's focus away from a rangebound Bitcoin, raising questions about the mechanics of this bull run, its sustainability, and the myriad of forces pulling the price in opposite directions.
The Bull Case: A Perfect Storm of Institutional FOMO and Technical Breakouts
At the heart of the current rally is a tidal wave of institutional capital, a force that has fundamentally reshaped the market landscape. The recent launch of spot Ethereum Exchange-Traded Funds (ETFs) has been a resounding success, with reports indicating substantial net inflows on single trading days. This influx of "big money" provides a stark contrast to previous retail-driven rallies, suggesting a more stable, long-term buying pressure.
Leading this charge is one major institutional player, a technology firm chaired by a prominent Wall Street strategist. In a move that has drawn comparisons to aggressive corporate Bitcoin accumulation strategies, the firm has announced plans to expand its equity offering to a colossal sum, with the proceeds earmarked for further Ethereum purchases. The firm, already one of the largest corporate holders of Ethereum, is aiming to control a remarkable percentage of the total ETH supply. This monumental buying pressure from a single entity is a powerful bullish signal, fueling what some analysts have described as a price action that is "defying gravity."
The institutional appetite extends beyond this single entity. The total amount of Ether held by companies with crypto treasuries has surged. Simultaneously, Ethereum held on exchanges has dropped to a multi-year low, a bullish indicator that suggests investors are moving their assets into long-term storage with no immediate intention to sell.
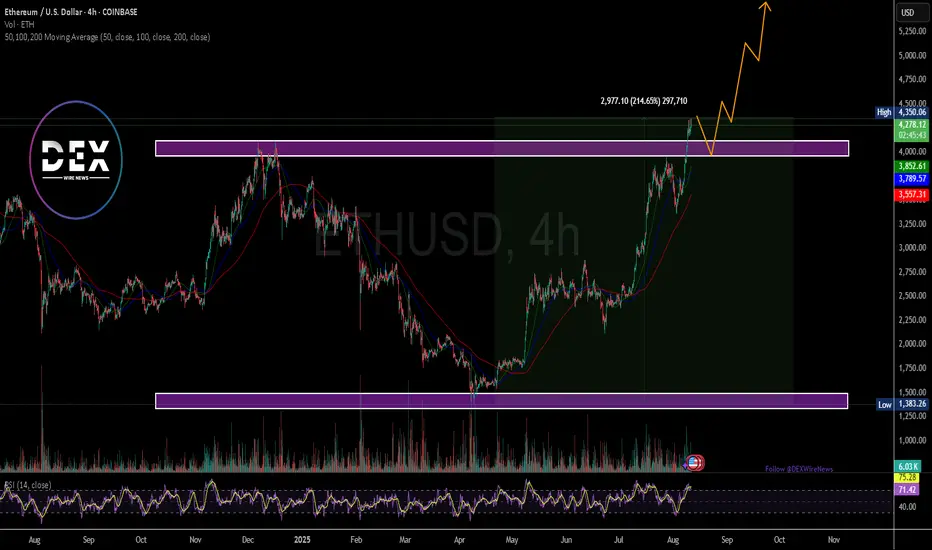
This institutional fervor is underpinned by a compelling technical picture. Analysts have identified a rare but powerful chart pattern on Ethereum's daily chart that has been developing for months. This setup is characterized by a horizontal resistance level and a downward-sloping support line, indicating increasingly aggressive buying on each dip. A decisive breakout above this resistance, according to technical analysis principles, could initially target higher price levels, with stronger momentum potentially extending the rally significantly. Other optimistic projections see Ethereum potentially reaching even higher valuations, with some analyses pointing to a fractal pattern that mirrors Bitcoin's previous bull runs.
The Derivatives Dilemma: Record Highs and Muted Enthusiasm
The derivatives market paints a more complex and, in some ways, contradictory picture. Ether futures open interest has soared to an all-time high, with the monthly trading volume on institutional-grade exchanges hitting record levels. This surge in activity, particularly from platforms favored by institutional investors, undeniably signals heightened interest and preparation for volatility.
However, a closer look at the data reveals some nuances. The record open interest, when denominated in US dollars, is largely a function of the rising price of ETH itself, rather than a massive influx of new leveraged positions. In fact, open interest measured in ETH terms remains below its previous peak.
Furthermore, derivatives data suggests a surprisingly subdued appetite for leveraged bullish bets. The annualized premium for ETH perpetual futures has been hovering around a neutral level, below what would typically indicate strong demand for leveraged longs. This could be interpreted in two ways: either the rally is being driven more by spot buying and has a more solid foundation, or there is a lack of conviction among speculative traders about the sustainability of the current price levels.
The Bearish Counterpoint: Profit-Taking, Historical Cycles, and Competitive Threats
As Ethereum's price tiptoes near its previous highs, signs of profit-taking are beginning to emerge. On-chain analytics show that short-term holders, in particular, are ramping up their selling to realize gains. While long-term holders remain relatively steadfast, daily profit realization has climbed. With a vast majority of all Ether addresses now in a state of profit, the temptation to sell could create significant headwinds, potentially slowing the ascent.
Adding to the cautionary tone is analysis from some market experts who have advised investors to consider selling their Ethereum holdings by the autumn. Citing the psychology of market cycles, one analysis suggests that the current "Optimism" phase is likely to transition into a "Market Peak/Euphoria" phase, which is historically followed by a swift and brutal correction. This perspective predicts that Bitcoin could show signs of topping out first, with Ethereum following suit, potentially leading to a significant price collapse for ETH. The short-term target in this scenario lies in a range substantially higher than current prices, but would precede this potential downturn.
Beyond immediate market sentiment, Ethereum faces long-term strategic challenges. Its dominance in the decentralized finance (DeFi) space is being contested by a growing number of independent layer-1 blockchains that offer faster transactions and lower fees. Major corporations and traditional finance entities are increasingly favoring these proprietary chains for their own blockchain projects, seeking greater control and customization. This trend is reflected in on-chain metrics, with Ethereum's total value locked (TVL) showing a decline and its weekly base layer fees lagging behind some competitors.
Ethereum vs. Bitcoin: The Flippening Narrative Resurfaces
For much of the recent crypto market action, Bitcoin has been in a state of consolidation. This has allowed Ethereum to take the spotlight, with ETH significantly outperforming BTC in recent weeks. This divergence has reignited discussions of "The Flippening," the hypothetical moment when Ethereum's market capitalization surpasses Bitcoin's.
The bull case for Ethereum's outperformance hinges on its utility as a programmable platform for DeFi, NFTs, and a host of other decentralized applications. This contrasts with Bitcoin's primary role as a store of value. The massive institutional inflows into Ethereum, both through direct purchases and ETFs, are seen as a validation of its long-term potential beyond a simple inflation hedge.
However, some Bitcoin proponents argue that the current ETH/BTC rally is an engineered market event. They allege that influential players are rotating their Bitcoin holdings into Ethereum to inflate its price based on the corporate treasury narrative, only to later sell their ETH and convert the profits back into Bitcoin.
Conclusion: A High-Stakes Balancing Act
Ethereum stands at a pivotal juncture. The powerful narrative of institutional adoption, exemplified by audacious corporate accumulation strategies, combined with bullish technical indicators, provides a credible path towards ambitious price targets. The influx of capital through ETFs and the growing recognition of Ethereum's role as the backbone of Web3 are formidable tailwinds.
However, the journey is fraught with peril. The specter of a cyclical market top, as articulated by some analysts, cannot be ignored. The increasing profit-taking by short-term holders, the ambivalent signals from the derivatives market, and the persistent competition from other layer-1 blockchains are all significant hurdles that could stall the rally.
Whether Ethereum will surge to new all-time highs and beyond or succumb to the pressures of an overheated market remains to be seen. The coming weeks will be crucial in determining if the current bull run has the legs to defy historical patterns and establish a new paradigm for the world's leading smart contract platform. For now, the market remains in a delicate, high-stakes balancing act, with the potential for both explosive gains and sharp, unforgiving corrections.

Total crypto market camp is about to double This chart goes back years, do your own research but charts don’t lie.

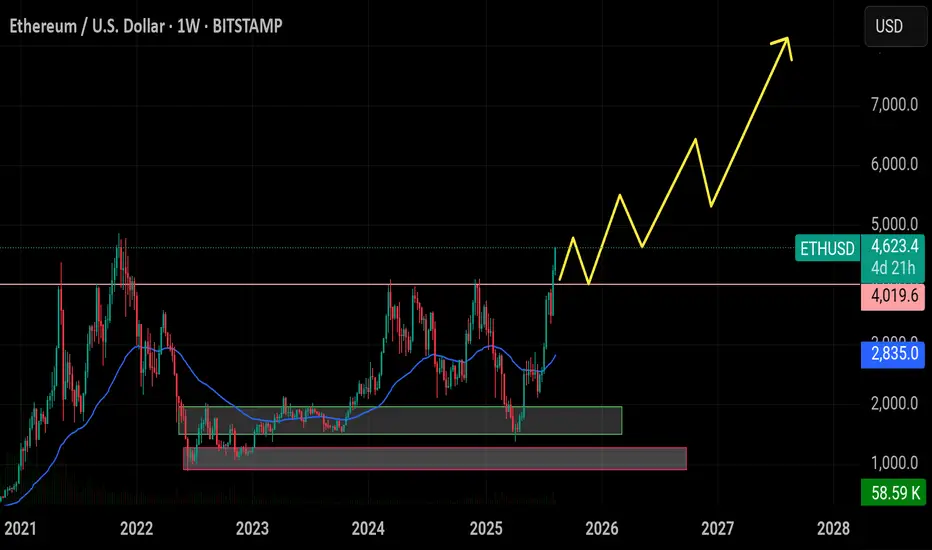
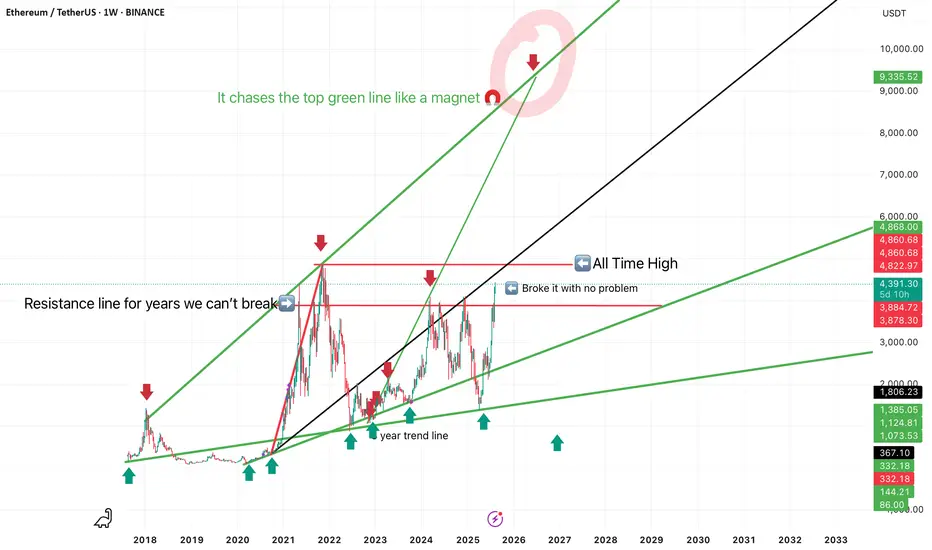
$Eth (Ethereum) road map to prices that will melt faces If history repeats itself, like it always does, then you should watch this beautifully play out, Ethereum is like a magnet to the top green line, but your resistance and support lines are tagged out. Do what you want with this and make sure you do your own research.
$ETH breakout leading to test 5000$Over the past three months, Ethereum has been consistently forming higher lows, starting from the ~$1,362 level, showing a strong and sustained uptrend. Recently, ETH decisively broke above the $4,100 resistance zone, which had previously rejected price action three times.
With this breakout, I’m not expecting an immediate retest of $4,100. Instead, price may continue its rally toward the 2021 all-time high near $4,900. Only after testing that level could we see a pullback to retest the $4,100 zone or even fill the small gap near $4,050.
On the fundamentals side, ETH ETF inflows remain positive on a daily basis, signaling strong institutional demand. Combined with increased whale accumulation, buying pressure continues to dominate.
Earlier, I considered this area for a potential short, but the price action and on-chain data now clearly indicate this is not a shorting opportunity—momentum remains bullish.
ETH at 4.5 yr resistance. Whats next ??1) if it brakes resistance it goes to $5k sooner
2) if it gets rejected at resistance it goes to $5k later

Ethereum Flips MasterCard: Is $5,000 ETH Next?A new era is dawning for Ethereum, the world's second-largest cryptocurrency. In a stunning display of market strength, Ethereum has not only surpassed the market capitalization of financial giant Mastercard but is also setting its sights on the ambitious $5,000 price target. This powerful rally, which saw Ethereum gain an impressive 45% in a single month, is fueled by a potent combination of surging institutional investment, increasing regulatory clarity, and significant buying pressure from large-scale investors, colloquially known as "whales." However, this bullish narrative is not without its counterpoints, as short-term leverage risks and a sense of caution in the options market present potential hurdles on the path to new all-time highs.
A New King in the Asset Rankings: Ethereum Flips Mastercard
In a landmark moment for the cryptocurrency space, Ethereum's market capitalization soared to over $519 billion in August 2025, eclipsing that of the global payments behemoth, Mastercard. This achievement propelled Ethereum to the 22nd spot among the world's largest assets, placing it ahead of household names like Netflix, Exxon Mobil, Costco, and Johnson & Johnson. The surge was the result of a consistent upward trend, with Ethereum's price climbing nearly 7% in a single day to hit $4,300, capping a 21% rise over several weeks.
This "flippening" of a traditional financial institution has ignited fresh debate about the long-term potential of decentralized assets. The 24/7 nature of cryptocurrency markets provides a distinct advantage, allowing for continuous trading and accumulation of buying momentum, even when traditional stock markets are closed. While Bitcoin still holds a commanding lead with a market capitalization of $2.36 trillion, Ethereum's consistent gains since July 2025 have kept the conversation alive about its potential to one day challenge the top spot.
The Road to $5,000: A Rally Fueled by Whales and Regulatory Tailwinds
The drive towards the psychologically significant $5,000 mark is being underpinned by several powerful forces. A staggering 45% monthly gain has brought this target within reach, with analysts pointing to a confluence of bullish factors.
One of the primary drivers is the unprecedented level of accumulation by "whales." In a single week, these large-scale investors accumulated an astounding $946.6 million worth of Ethereum. This aggressive buying is not limited to individual investors. A mysterious institution was reported to have acquired 221,166 ETH, worth nearly $1 billion, in a single week, signaling strong long-term confidence even at elevated prices. This whale activity is significant as it reduces the available supply of ETH on exchanges, creating a supply squeeze that can amplify price movements.
Adding to this momentum is the growing clarity in the regulatory landscape, particularly in the United States. Recent developments, including the White House's new digital asset framework and a resolution in the Ripple-SEC case, have helped to remove key uncertainties that have long plagued the crypto market. This improved regulatory environment is fostering greater trust and encouraging institutional adoption. The introduction of tax-advantaged structures, such as IRS Code 351, which allows for tax-free exchanges of Ethereum for treasury shares, is further incentivizing large-scale purchases by long-term holders.
The Rise of Corporate Ethereum and ETF Inflows
A significant and growing trend is the increasing allocation of corporate treasuries to Ethereum. As of August 2025, corporate Ether holdings have surged to an impressive $13 billion, with the total amount held by companies reaching 3.04 million ETH. This rally in corporate adoption is being led by firms like BitMine Immersion Technologies, SharpLink Gaming, and The Ether Machine.
BitMine Immersion Technologies, in particular, has made headlines by becoming the first company to hold more than $3 billion in ETH, having increased its holdings by a staggering 410.68% in just 30 days to 833,100 ETH. SharpLink Gaming and The Ether Machine have also significantly boosted their ETH treasuries, with the top ten corporate holders now controlling over 2.63 million ETH, representing about 2.63% of the asset's total supply.
This corporate buying spree is mirrored by the substantial inflows into spot Ethereum Exchange-Traded Funds (ETFs). In a single day, ETH ETFs saw inflows of $533.8 million, with cumulative inflows since July 2024 topping $8.9 billion. These sustained ETF inflows, coupled with the growth of corporate reserves, are seen as a powerful combination that could position ETH to outperform and challenge the $5,000 level for the first time.
A Time to Sell? Market Cycles and Exit Strategies
While the current sentiment is overwhelmingly bullish, some analysts are sounding a note of caution, suggesting that the current rally may have an expiration date. Drawing on well-known market cycle cheat sheets, some traders are pointing to the current phase as one of "Optimism" and "Ethereum dominance," which they believe will eventually lead to a "Market Peak/Euphoria" phase.
According to one such analysis by a crypto trader, this peak could be reached by the end of October 2025, at which point the market may experience extreme overvaluation and a subsequent downturn. This perspective suggests that while there may still be room for significant upside, with short-term targets ranging from $5,800 to $6,000, a strategic exit plan is crucial. This view is not universally held, with other technical analyses projecting targets as high as $12,000 based on patterns similar to Bitcoin's 2020 rally.
The Clash of Fundamentals and Short-Term Risks
Despite the strong bullish fundamentals, there are short-term risks that could temper the rally. One of the primary concerns is the high level of leverage in the market. The all-exchange Estimated Leverage Ratio (ELR) has climbed to 0.68, approaching historical highs and signaling excessive speculative activity. While this indicates a high degree of confidence, it also increases the risk of cascading liquidations in the event of a price correction.
The Ethereum options market also reflects a degree of caution. Despite the 41% rally in a month, derivatives data shows that traders have yet to turn decisively bullish. The options delta skew, a measure of the relative demand for bullish versus bearish options, remains in neutral territory. This suggests that while professional traders are not anticipating a significant price drop, they are also not exhibiting the "euphoria" that often accompanies major market tops. This lack of euphoria in the options market could be interpreted in two ways: either as a sign of a healthy, sustainable rally or as an indication that there isn't enough conviction to push the price significantly higher in the immediate future.
Conclusion: A Bullish Trajectory Tempered by Prudence
Ethereum's recent performance has been nothing short of remarkable. The cryptocurrency has not only achieved a significant milestone by surpassing Mastercard in market capitalization but has also laid a strong foundation for a potential run to $5,000 and beyond. The confluence of strong institutional demand, growing corporate adoption, and increasing regulatory clarity paints a decidedly bullish picture for the long term.
However, the path forward is unlikely to be a straight line. The risks associated with high leverage in the short term, coupled with a sense of caution in the options market, serve as important reminders that volatility remains a key characteristic of the crypto space. While the fundamental drivers suggest that Ethereum is well-positioned for continued growth, investors and market participants would be wise to remain vigilant and mindful of the potential for pullbacks. The coming months will be crucial in determining whether Ethereum can sustain its current momentum and solidify its position not just as a leading cryptocurrency, but as a global financial asset of the future.
USDJPY Bullish scenarioUSDJPY shows us clear bullish setup after the breakout of long accumulation box

Extreme Euphoria - ETH weekly update August 11 - 17thFrom an Elliott Wave perspective, Ethereum is likely advancing within Cycle degree Wave 3, Primary degree Wave 5, at the end of Intermediate degree Wave 3, and in Minor degree Wave 5. While theoretical upside targets for this structure have already been met, ETH has shown little sign of slowing down. On lower timeframes, the price action suggests the move is not yet complete.
The first alternative scenario would see the current wave extending further upward. The second, less probable alternative, would classify the move as part of an ongoing corrective formation — but the structure lacks the characteristics to strongly support this view.
Liquidity analysis reveals significant clusters below the low of Intermediate Wave 4 on the heatmap. In the order book, notable sell orders are stacked above the current price at $4,500 and $5,000 — levels of interest because they align with key technical confluences. Additionally, a Fair Value Gap (FVG) appears on the 1-hour chart, suggesting the possibility of a short-term pullback before price resumes its move toward the main target zone.
Funding rates are in a normal positive range and open interest is rising but beginning to flatten, signalling a steady but maturing uptrend. It’s worth noting that these funding rates have recently come down from elevated highs, indicating that the market was previously overheated.
ETH ETF flows remain steadily positive, but as mentioned in the Bitcoin analysis, these inflows appear to be driven more by rising prices and associated FOMO than by deliberate accumulation.
From a sentiment perspective, the Fear and Greed Index shows the market in “Greed” territory, while Ethereum’s own index indicates extreme greed. On LunarCrush, mentions of ETH are increasing, reflecting heightened market attention. However, sentiment measured per network interaction remains mostly neutral — a divergence that is worth monitoring.
In summary, caution is warranted at current levels. The primary target remains the 2.618 Fibonacci extension around $4,500, where a confluence of liquidity, order book resistance, and Elliott Wave projections converge. This level stands out as the most probable area for the current wave to complete before any significant correction.
Trade safe.

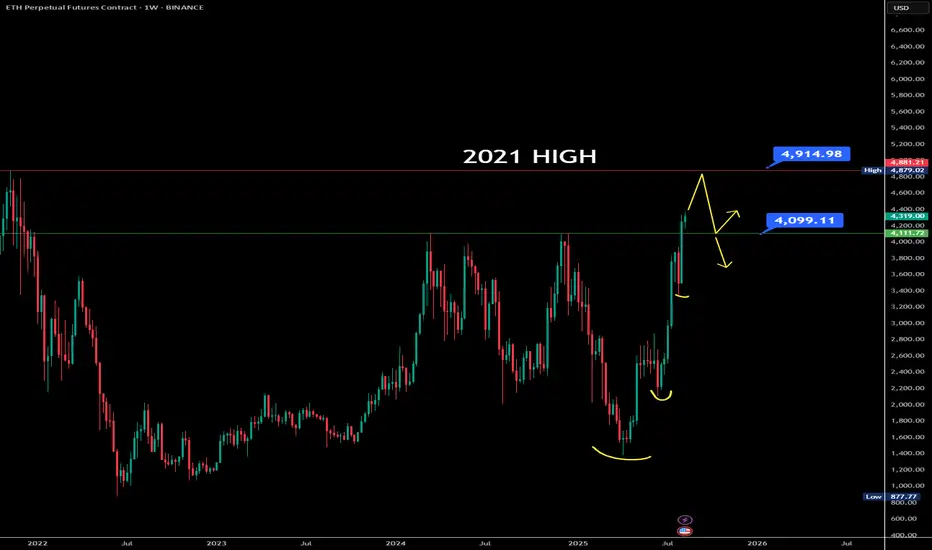
Ethereum (ETH) Price Hits 3.5 Year High; Nears ATH Of $4,891BINANCE:ETHUSDT is approaching a significant milestone in August, trading at $4,182, a 3.5-year high . The altcoin breached the $4,000 mark over the weekend, setting its sights on the next target of $4,891. This strong upward momentum suggests Ethereum could make history if it sustains its growth.
At $4,303, BINANCE:ETHUSDT is 17% away from its all-time high (ATH) of $4,891 . To reach this ATH, ETH must first secure $4,500 as a stable support level. A successful consolidation above this threshold could set the stage for ETH to continue its bullish ascent towards the ATH.
However, if investor sentiment shifts and selling pressure increases, BINANCE:ETHUSDT could struggle to maintain its position above $4,000 . A decline below this level would invalidate the bullish outlook, potentially reversing the recent gains and sending ETH lower.

ETH NEXT BULLISH MOVE.🟢 ETHUSDT | 1H Bullish Setup
✅ Price broke structure and is in bullish order flow.
✅ Clear POI (Point of Interest) zone at 4,060 – 4,080.
🔍 Price is retracing from highs, yet to tap into POI.
📌 Trade Idea: Wait for price to retrace into POI zone and look for bullish confirmation before entry.
🎯 Potential bounce toward 4,350+ after liquidity sweep and POI mitigation.

Breaking: Ethereum Is Set To Reclaim the $5k Price Pivot The price of the notable Altcoin- Ethereum ( CRYPTOCAP:ETH ) is set to reclaim the $5k resistance amidst growing interest and buying momentum.
For the past 3 months Ethereum ( CRYPTOCAP:ETH ) spiked 200+% breaking out from a cup and handle pattern amidst growing interest ikn the Ethereum chain.
Crypto Pundits on X, LinkedIn and Discord envisage the influx of memecoins on the Ethereum ( CRYPTOCAP:ETH ) chain- while most skeptics think the layer 1 blockchain is dead, Ethereum's sojourn to the $5k pivot is just days away as popular folks like Eric Trump the son of the present president of USA hints on investor's to buy Ethereum's dip.
As of the time of writing, CRYPTOCAP:ETH is up 0.58% already breaking the $4k resistance trading at $4276. With the Relative strength Index (RSI) at 71, CRYPTOCAP:ETH is on the verge of reaching overbought region. CRYPTOCAP:ETH might experience a respite before picking momentum up.
#ETH/USDT : Price is going as expected in previous ideas on eth#ETH
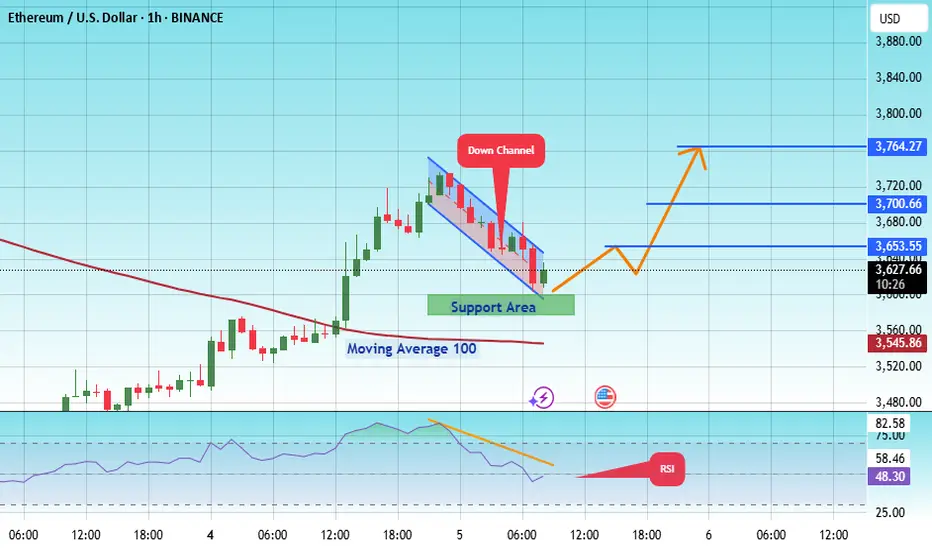
The price is moving within an ascending channel on the 1-hour frame, adhering well to it, and is on track to break it strongly upwards and retest it.
We have support from the lower boundary of the ascending channel, at 3593.
We have a downtrend on the RSI indicator that is about to break and retest, supporting the upside.
There is a major support area in green at 3582, which represents a strong basis for the upside.
Don't forget a simple thing: ease and capital.
When you reach the first target, save some money and then change your stop-loss order to an entry order.
For inquiries, please leave a comment.
We have a trend to hold above the 100 Moving Average.
Entry price: 3626.
First target: 3653.
Second target: 3700.
Third target: 3764.
Don't forget a simple thing: ease and capital.
When you reach your first target, save some money and then change your stop-loss order to an entry order.
For inquiries, please leave a comment.
Thank you.

ETHUSDTEthereum will definitely return from this price range to the target of $4000, the price range is the price retracement ($1428-$1125-$802).

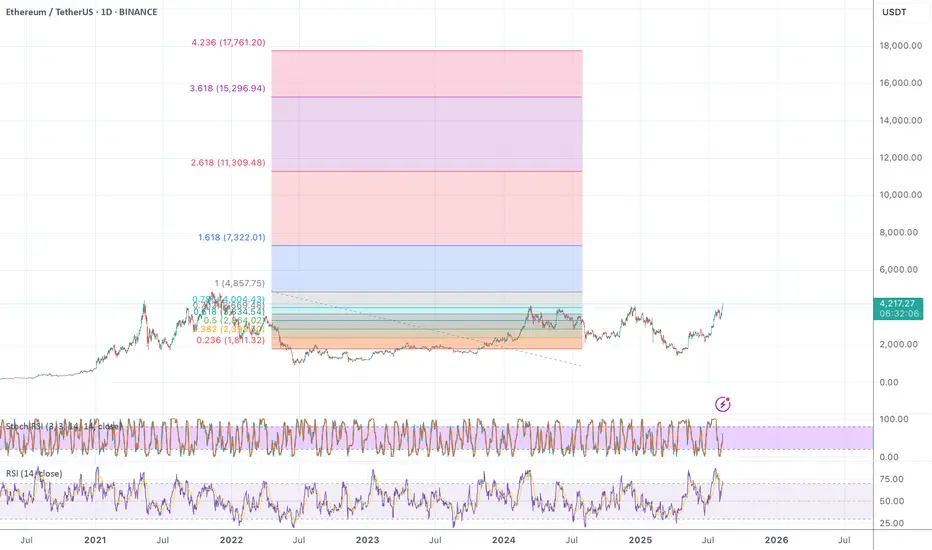
ETH to 17.000USD if it hits the 4.236 fib! Shocking! If I draw the fibbs to measure how high it can go I can't believe my eyes!!!
Firstly, we all thought it was over with ETH in the beginning of the year.
Secondly, we broke out today!!!
Off to 17k!!! Yay!
ETH – $7k Target in Sight
7k incoming on CRYPTOCAP:ETH —timing is up in the air, but the chart looks stellar.
A decisive break above $3,500 should kick off aggressive expansion.
Meanwhile, ETHBTC has been rallying hard off its lows; I’m eyeing a 50% gain against BTC over the next 2–3 months.
Holding through this strength makes sense—it’s been a long time since we’ve seen these setups.

ETHBTC – Bottom Likely In!Finally stepping in to say it—ETHBTC has likely bottomed.
April marked the final month of its bearish phase, and it just tapped the impulse zone from the last major move, which also lines up with a key range low we haven’t seen since December 2019.
The weekly is starting to show early signs of strength, adding weight to this being a pivotal area.
From a risk/reward standpoint, this is arguably the best BINANCE:ETHBTC setup in a long time.
Time to act accordingly—this could be the moment many have been waiting for. I expect BTC dominance to give alts some room over the next couple of weeks. The real test comes in July.
MARKETSCOM:ETHEREUM BINANCE:ETHUSDT

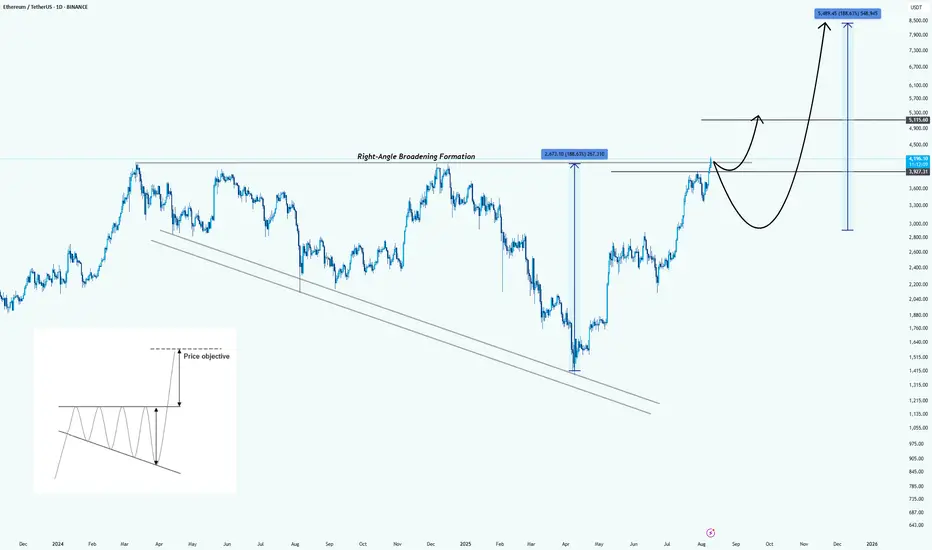
Ethereum: Formed a Right-Angle Broadening FormationHello guys!
Pattern Identified:
This is a Right-Angle Broadening Formation (characterized by a flat resistance level at the top (around $4,200 – $4,300) and a rising lower trendline). It shows increasingly volatile swings upward while repeatedly testing the same ceiling.
Technical Implication:
RABFs are typically bullish continuation patterns. The flat top acts as a breakout trigger, while the rising base indicates consistently higher lows and aggressive buyer support.
Price Objective:
According to the pattern’s measured move principle, the breakout target is projected by the vertical height of the formation, added to the breakout point:
Height : $2,070
Breakout point : $4,300
Target : $6,370 (first objective)
Extended bullish run could reach $8,500 if momentum sustains.
Key Levels:
Resistance: $4,200 – $4,300 (breakout trigger)
Support: $3,700, then $3,200
First measured target: $6,370
Extended target: $8,500
Bullish Scenario:
Strong daily close above $4,300 with volume could kickstart a rapid move toward the first target, possibly with only a brief consolidation at $5,100 before continuation.