ETH at Major Demand Zone | Oversold RSI Signals Potential BounceEthereum is currently trading at a major high-timeframe demand zone, highlighted in green. This level has acted as a strong support area multiple times in the past, consistently producing bullish reactions after deep pullbacks.
An important confluence to note is the RSI dropping below 30, signaling oversold conditions. Historically, on this chart, every instance where RSI fell below 30 resulted in a noticeable price bounce, indicating downside exhaustion and aggressive dip-buying from this zone.
With price now revisiting this proven support while momentum is oversold, the probability of a short-term to mid-term bounce increases, provided this demand zone holds.
Key Points:
- Price at a strong, well-tested HTF support/demand zone
- RSI below 30, historically followed by bullish rebounds
- Sellers showing signs of exhaustion at key structure
We should wait for confirmation, such as bullish candle closes, momentum shift, or structure reclai,m before entering. A sustained breakdown and acceptance below the support zone would invalidate the bullish bias.
Cheers
Hexa
Ethlong

ETH to all time high! Lets go!🚨 ETH Elliott Wave Update 🚨
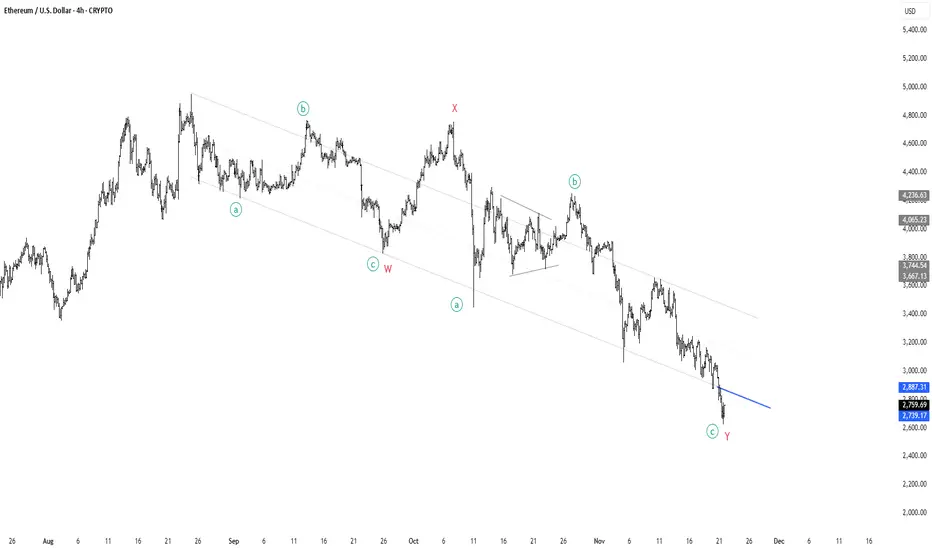
What we’re looking at here is a clean W-X-Y complex correction unfolding over months — a classic structure when the market wants to correct deeper without breaking the macro trend.
• Wave W completed with an ABC decline
• Wave X gave us the relief rally everyone thought was the bottom ❌
• Wave Y extended lower, subdividing into a-b-c, pulling price into the lower boundary of the corrective channel
Now we’re sitting right at the end of minor wave c of Y, the final leg of this entire structure. The pattern is mature, sellers look exhausted, and the downtrend channel is tightening — perfect conditions for a potential reversal.
🔵 The blue trendline is the key.
If ETH can punch through that level with momentum, it confirms the entire WXY correction is complete and opens the door for a major impulsive leg upward.
💥 Break the blue line → reclaim macro structure →
I believe ETH will begin the march toward new all-time highs.
This is where long-term bottoms historically form:
deep structure, clean proportions, fading downside velocity, and a clear invalidation level.
📈 Eyes on the breakout.
ETHUSDT 505% profits potential 10X leverage —LONG tradeEthereum is still diving deeper today, not yet done with its retrace. It seems the market wants to go lower, but it can't go that much lower as the bears over played their hands.
The last setup was a flop so we are going with lower leverage on this one. Still, very high risk with 10X.
ETHUSDT is now trading as a double-bottom compared to 21-November 2025. More than two months of range trading after a major correction. No new lows.
The fact that there is no bearish trend, no bearish continuation, reveals bullish potential. Bullish potential is also revealed by how the smaller altcoins are behaving. While Ethereum and Bitcoin moved lower recently, these smaller projects were unaffected and some are growing three digits green. This is what reveals the continuation of the relief rally, for this project, and for the others a type of bull run phase.
The smaller projects need a bull run in order to reach high enough to be able to take the heat when Bitcoin goes down hard later this year. If they don't grow super strong now, February-March 2026, then it would be very bad Q2-Q3.
By Q4 2026, all bearish momentum should be fully consumed and the market starts to settle. Q1-Q2 2027 we will be full green. It will take time before the positive sentiment reaches all sectors of the market, but the market bottoms around Q3-Q4 followed by a long-term recovery.
Mid-2027 can be the time of a prolonged consolidation period and then comes the Bitcoin halving news and hype. Bitcoin starts to grow long-term to peak sometime around late 2029. The future is bright. Only 2026 is troublesome but the rest looks incredibly good.
Stay active, stay alive, continue to trade. When in doubt, buy and hold spot; when certain, I am wishing you the best.
Full trade-numbers below:
_____
LONG ETHUSDT
Leverage: 10X
Potential: 505%
Allocation: 5%
Entry zone: $2500 - $2725
Targets:
1) $2950
2) $3150
3) $3300
4) $3515
5) $3800
6) $4065
Stop: Close weekly below $2450
_____
Thank you for reading.
We have great prices and timing right now. You know the saying, "buy when the market is red." It is red now and we are going up next. This is the best time to buy. We are going long with 10X.
Namaste.

ETH/USDT — Breakdown Below Channel Midline: Liquidity Sweep Setu
Price is consolidating below the midline of the ascending channel after a failed retest from underneath.
This is a bearish signal for bullish continuation.
A large cluster of stops (liquidity) sits below the $2,600 low.
If those stops are swept, the probability of a sharp sell-off increases.
Personally, I plan to add on that move, with the maximum volume zone around $2,250.
Below that, I only expect continuation in a panic-sell / black-swan scenario.
📌 Fundamentals: ETH remains the second most important asset in crypto after BTC.
On a higher timeframe , price moves in distribution/re-accumulation blocks.
Right now, we’re seeing a prolonged change of hands inside a large flat-top triangle.
This formation is typically resolved to the upside, with a fast repricing — similar to what BTC did in the past.
Last time, most participants exited BTC at $30–40k — myself included.
This time, I don’t plan to repeat that mistake.
What about you?

Ethereum update after "the crash" — $1.67B long liquidations 24hThere is no crash really, more like a continuation of the retrace...
Good morning my fellow Cryptocurrency trader, I hope you are having a wonderful day.
Ethereum is a very strong buy right now. We are witnessing the production and confirmation of a higher low. 30-January 2026 vs 21-November 2025. A true higher low I should say this time.
The low 21-November was $2,623. The low today $2,689. This is technically a double-bottom. The price is too close to the last low but the higher low signal still valid remains. It can be read in both ways.
On a daily basis, trading volume has been dropping since November 4.
What to expect?
Within the last 24 hours, $1.67B worth of long positions have been liquidated. The signal that I've been mentioning for the bulls also works in reverse. That is, when the market liquidates $1.2B worth of shorts within 24 hours, we know the bulls are in.
The fact that we have this much liquidations, $1.67B in just a single day, reveals the retrace is over. The bulls have been liquidated, the market can go up next.
The exchanges will use all the profits they made through selling and loaning and fees to buy everything at bottom prices, at the current market low. This low is the lowest possible, the exchanges know. Many people are not able to buy because of the recent move but the exchanges can, they buy everything at the low and prop up the market. When prices are really high, the same situation with the long positions will be repeated with the shorts.
Remember, we trade against exchanges not other people, and the exchanges have all of our information and hold all the coins. The way to beat the exchanges is to buy spot focusing on the long-term.
Ethereum continues to be bullish, market conditions have not changed.
We have an even better entry price now. Prepare for massive growth. The last bullish advance before the continuation of the bear market that started 4 months ago.
While Ethereum produced a lower high based on the candle wick, within the consolidation range, it produced a higher high based on candle close. The candle close is more important than the wick. Couple this with the current double-bottom/higher low, and you get the picture... The relief rally is not over, we have one more bullish move before the continuation of the bearish cycle.
The next drop, after the last jump, will produce a strong lower low compared to 21-November 2025. Right now, we are still within the same trading zone.
The smaller altcoins will grow many times more compared the bigger projects. Many of these altcoins were not affected by Bitcoin's and Ethereum's recent drop, ENSOUSDT and THEUSDT are two quick examples if you want to see some charts, also ROSEUSDT from the ones I've been sharing recently. This reveals much. Many of these altcoins will produce a massive bull run in the coming weeks. Choose wisely.
Namaste.


ETHUSDT – 4H Chart Update. ETHUSDT – 4H Chart Update.
ETH is trading inside a descending broad wedge/channel.
Price is currently near the lower trendline support (~2900 zone).
This area can act as a short-term bounce zone.
If support holds, upside targets are 3050 → 3200 → 3350.
A clean breakdown below 2780–2720 may open downside toward 2500.
Short-term bounce possible, trend still range-bound.
⚠️ Wait for confirmation & keep risk tight.

Ethereum (ETH/USDT): Descending Triangle Breakdown ScenarioHI
Ethereum is currently trading within a descending triangle formation, developing after a strong bearish impulse.
Following the sharp sell-off, ETH attempted several recoveries but consistently failed to reclaim higher levels. Price is now compressed between:
A descending internal trendline, acting as dynamic resistance and clearly respected by multiple rejections.
A horizontal support base, forming the lower boundary of the triangle.
This combination reflects a market where sellers remain in control, while buyers are only managing to slow the decline rather than reverse it.
Trade Thesis (Main Idea)
The key setup here is a breakdown of the triangle’s lower boundary:
Trigger: A confirmed break and close below the bottom support of the triangle
Bias: Short position on breakdown confirmation
Target: $2,806, aligned with a high-probability demand zone and prior liquidity
Invalidation: A strong reclaim above the descending trendline would invalidate the bearish continuation scenario

ETH 751% profits potential with 20X leverage —LONG tradeEverybody loves Ethereum. We all love Bitcoin. It is even more lovely when you get to make money trading Bitcoin and Ethereum. The Cryptocurrency market is awesome. Timing is great.
I would like to share with you some trade-numbers, these are for a huge LONG on ETHUSDT with high leverage. Low risk vs a high potential for reward.
What's your take on this chart setup?
_____
LONG ETHUSDT
Leverage: 20X
Potential: 751%
Allocation: 3%
Entry zone: $2850 - $3000
Targets:
1) $3175
2) $3333
3) $3515
4) $3800
5) $4065
Stop: $2825
____
Thanks a lot for your support over the years. It is always a great experience to share with you.
I am wishing you tons of profits. I am wishing you abundance, health, wealth and success.
You are a divine living being and you will always deserve the best.
Namaste.

ETH Local Trade - Bullish Local Trade plan
Local Intraday Long
Ethereum is showing strength as it holds key local support.
Current price action suggests a clear path for upside movement if we maintain this structure.
Are you playing this breakout, or do you think we need one more flush before the real move? 👇

Ethereum... Let me ask you a question!Let me ask you a question and let's be honest: The market flush last year, were you expecting it or did it catch you by surprise?
Right? It is that simple.
The bullish breakout, a major one, super fast; are you expecting it or will it catch you by surprise?
Maybe not you because you are reading this and I've been sharing bullish articles for months, but what about the rest of the market? It is always the same but in reverse.
The market flush was a major surprise for all of us. The same will happen with the advance that is about to develop. If everybody is expecting a bearish continuation because there is nothing bullish on this chart, then the market will go contrary to what the masses think.
The peak happened in late August 2025. Then months of neutral, months of bearish action and now months of consolidation at bottom prices. This bottom consolidation people see as boring, dull and bearish and so they expect a continuation. It will catch them by surprise.
The only reason we are bullish is because we track hundreds of altcoins and not only Bitcoin and Ethereum. If we were tracking Bitcoin and Ether only, then I understand, the market can be mixed at most. But since we track hundreds of charts, we can predict bullish action.
Bitcoin closed three months red and it is closing green this month. This means additional growth. What Bitcoin does, the market follows. Ethereum is going up.
Namaste.

#ETH/USD Buy Trade Setup.Here’s an up-to-date ETH/USD Buy trade outlook (technical + fundamental) to help you assess whether positioning for a Upside makes sense right now.
Thank You......

ETHBTC is about to produce a strong bullish continuationBelieve it or not, it's been already five months since ETHBTC produced its last major high, August 2025. Amazing, can you believe it?
Surprising as well, the fact that the correction low happened 77 days ago, that's more than 2.5 months.
The entire bullish move that started in April 2025 lasted 119 days, four months. So the correction plus support consolidation has been going for longer than the duration of the entire bullish period. This is good news, let me explain.
If the market was bearish, just as we see on the left side of the chart, it simple goes down. There cannot be a five months period with no new lows, impossible. That's why it is good news that the peak happened five months ago and yet ETHBTC continues to trade at a strong higher low, above long-term support. We are still within a strong bullish cycle; next we get a resumption, a bullish continuation.
That's the good news and this is as good as it gets. We are aiming for a major high close to the high point in March 2024. It will be awesome. ETHBTC continues bullish and is now set to grow.
Thank you for reading. You are truly appreciated.
Namaste.

#ETH/USD Buy Trade Scenario.Here’s an up-to-date ETH/USD Buy trade outlook (technical + fundamental) to help you assess whether positioning for a Upside makes sense right now.
Thank You......

ETH/USDT – 4H Chart Update. ETH/USDT – 4H Chart Update
ETH is trading inside a descending broad structure, but the price is now testing a strong demand + trendline support zone.
The current dip looks like a liquidity sweep / stop-hunt into support rather than a trend breakdown.
Price is near the lower rising trendline + horizontal demand high reaction area.
Immediate Support: 2,900 – 2,880
Major Support: 2,780 2,680
Invalidation: Below 2,650 (structure weakness)
Resistance: 3,200 – 3,300
Major Supply: 3,450 – 3,500
Expected Scenario (as marked):
Hold above 2.88K–2.9K base formation → strong bounce
Upside targets: 3.1K 3.3K 3.5K
If support fails deeper pullback toward 2.78K, 2.68K
Neutral-to-bullish as long as demand holds. Patience is key here—reaction at support will decide the next leg.
Not financial advice. Trade with risk management.

#ETH/USDT — Descending Wedge & High R/R Zone#ETH
The price is moving within a descending channel on the hourly timeframe. It has reached the lower boundary and is heading towards a breakout, with a retest of the upper boundary expected.
The Relative Strength Index (RSI) is showing a downward trend, approaching the lower boundary, and an upward bounce is anticipated.
There is a key support zone in green at 2912, and the price has bounced from this level several times. Another bounce is expected.
The indicator is showing a trend towards consolidation above the 100-period moving average, which we are approaching, supporting the upward move.
Entry Price: 2956
First Target: 3021
Second Target: 3092
Third Target: 3160
Stop Loss: Below the green support zone.
Remember this simple thing: Money management.
For any questions, please leave a comment.
Thank you.

ETH Ascending Triangle: Long SetupEthereum is in an ascending structure, pulling back toward trendline support with clear resistance around 3,400 USD, offering a potential long setup with defined invalidation and targets.
Trade direction
- Long, buying the dip into the rising trendline / lower Bollinger area, aiming for another test of 3,400 resistance.
- Structure: Higher lows since November, forming an ascending triangle against the 3,400 horizontal cap.
Entry and invalidation
- Potential entry zone:
- $2,950–$3,050, near the blue trendline and mid-to-lower Bollinger band.
- Invalidation:
- Below $2,850, which would break the rising trendline and recent swing low structure.
Take‑profit levels
- TP1: $3,180–$3,200 (prior local resistance and Bollinger midline); consider taking partial profits and moving stop to breakeven.
- TP2: $3,400 major resistance; main target of the pattern.
Trade management
- If price closes a daily candle below the trendline and 2,850, treat the idea as invalid and stand aside.

#ETH/USD Buy Trade Scenario.Here’s an up-to-date ETH/USD Buy trade outlook (technical + fundamental) to help you assess whether positioning for a Upside makes sense right now.
Thank You......

Ethereum (ethusdt): two positions Hi!
Eth broke the last level and confirmed a bullish trend!
after the breakout it formed a reversal head and shoulders and broke down the neckline, now the neckline is broken, and the pink area seems a potential area for getting a long position after the short position hit the target.
The short position target: $3200
The long position target: $3320 and then $3450

#ETH/USD Buy Trade Setup.Here’s an up-to-date ETH/USD Buy trade outlook (technical + fundamental) to help you assess whether positioning for a Upside makes sense right now.
Thank You......

$ETH bullish update! (LTF)BINANCE:ETHUSDT continues to compress inside the descending trendline + rising support, holding above the key demand zone. No breakdown, no panic — just pressure building.
- Higher low already defended
- Sellers unable to push below demand
- Clear risk definition
- Upside opens up once the descending trendline is fully cleared
Entry: 3,218 – 3,254 (pullbacks into support)
SL: 3,067 (clean loss of structure)
Targets:
TP1: 3,447
TP2: 3,650

#ETH/USD Buy Trade Scenario.Here’s an up-to-date ETH/USD Buy trade outlook (technical + fundamental) to help you assess whether positioning for a Upside makes sense right now.
Thank You......

ETH/USDT (4H) – Chart Update. ETH/USDT (4H) – Chart Update
Structure: Bullish bias holding
Price Action: ETH has broken above the descending trendline
Ichimoku: Price trading above the cloud → momentum remains positive
Ethereum has reclaimed the trendline resistance, which is now acting as support. The pullback looks controlled and healthy, suggesting continuation rather than rejection.
Holding above 3,200–3,250 keeps the bullish scenario active
A sustained move can push ETH toward 3,450 → 3,650 → 3,800 zones.
A breakdown below 3,150 may trigger a deeper retest toward 3,000 support.
Market structure favors upside continuation. Wait for confirmation and manage risk wisely.
