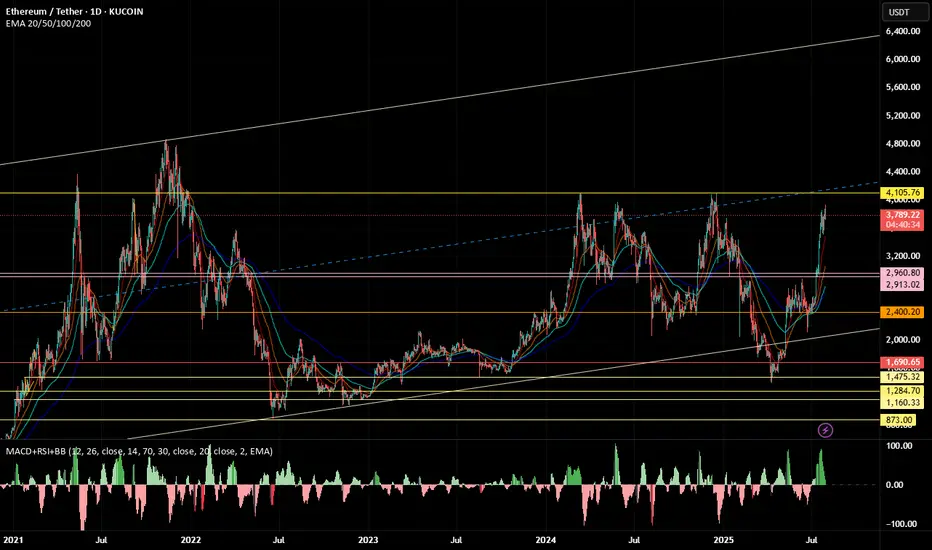
ETH to $6500?Have had this chart created for a while since before 2020, now loading it back up looks like everything is going as planned. ETH has to reach its ATH again around 4800 then it shoots to prices discovery, it will forsure run through 5000$ so $6500 becomes a target afterwards.
Ethlong
ETH Breakout and potential bullishness expected for a monthETH has broken out from downtrend and market sentiment has turned bullish overall. So it is expected to go up until it reaches 4000$ (70%) where a long term resistance is found.
Any further bullishness post 4000$ depends on future market conditions and price action at that point of time, as it is a long term resistance which would be more difficult to break.
Fibonacci retracement is used to find potential temporary selloffs in this up move. This move could potentially end the medium term bearish sentiments in ALT Coins.
Note: For educational purposes only. DYOR before investing or trading.

Eth Targetseth short term trade but once the market breals obver 3960 and sustain the longs will work great to 4350 level

Ethereum Price Eyes $5K as Frenzy Fuels Supply ShockEthereum's Ascent: A Perfect Storm of Institutional Frenzy, Dwindling Supply, and Shifting Market Dominance
A palpable sense of anticipation is building in the cryptocurrency market, and its focal point is increasingly not on the reigning king, Bitcoin, but on its heir apparent, Ethereum. A confluence of powerful forces—ranging from bullish proclamations by Wall Street titans and an unprecedented institutional buying spree to compelling on-chain metrics and a shifting market structure—is painting a picture of a potential paradigm shift. The world's second-largest cryptocurrency is not just rallying; it appears to be on the precipice of a significant breakout, with some analysts eyeing targets that would shatter its previous all-time highs. This is not merely a story of price appreciation but a narrative of a "quiet takeover," where Ethereum's fundamental strengths and evolving role in the digital asset economy are finally being recognized by the world's largest financial players.
The chorus of bullish voices has grown louder in recent months, led by influential figures like billionaire investor and Galaxy Digital CEO, Mike Novogratz. A long-time crypto proponent, Novogratz has become increasingly vocal about his conviction that Ethereum is poised to outperform Bitcoin in the near future. He has repeatedly stated that Ethereum has a "really powerful narrative" and that market conditions are aligning for a significant upward move. Novogratz's thesis is built on a simple yet potent economic principle: a demand shock colliding with an already constrained supply. He predicts that Ethereum could outperform Bitcoin in the next three to six months, a bold statement given Bitcoin's own impressive performance.
The catalyst for this potential outperformance, according to Novogratz, is the flood of institutional capital now targeting Ethereum. This isn't just speculative interest; it's a strategic shift by major companies to hold ETH as a treasury reserve asset. This trend, he argues, is creating a supply crunch that will inevitably drive prices higher. The billionaire has identified the $4,000 mark as a critical psychological and technical level. In his view, a decisive break above this price point would launch Ethereum into a phase of "price discovery," where past resistance levels become irrelevant and the asset's value is determined by the sheer force of market demand. Novogratz believes Ethereum is "destined" to repeatedly challenge this $4,000 ceiling, suggesting that a breakout is a matter of when, not if.
This bullish sentiment from one of crypto's most respected voices is not occurring in a vacuum. It is underpinned by a dramatic and sustained price rally that has seen Ethereum's value surge by an astonishing 75% since late June. This powerful uptrend is not fueled by retail FOMO alone; rather, it is the result of a verifiable and accelerating wave of institutional adoption.
The primary engine behind this rally has been the launch and subsequent success of spot Ethereum Exchange-Traded Funds (ETFs). These regulated financial products have opened the floodgates for institutional investors to gain exposure to ETH without the complexities of direct custody. The inflows have been nothing short of staggering. In one remarkable instance on July 25th, Ethereum ETFs registered a net inflow of $452.8 million in a single day, with BlackRock's ETHA fund accounting for the lion's share at $440.1 million. This figure represents a dramatic escalation from the sub-$100 million daily inflows seen in early July, indicating a multifold jump in institutional buying pressure. In a single week, these ETFs absorbed a massive $2.18 billion, showcasing the voracious appetite of big money for a piece of the Ethereum network.
The impact of these ETF inflows is being magnified by a phenomenon known as a "supply shock." Analysts have noted that in a three-week period, ETFs purchased an amount of ETH equivalent to what the network would issue over 18 months. This aggressive absorption of the available supply from the open market, at a time when supply is already constrained due to staking and other factors, creates a powerful upward pressure on price.
The institutional frenzy is not limited to passive ETF investments. A new and significant trend has emerged: the rise of the "Ethereum treasury company." Mirroring the strategy pioneered by MicroStrategy with Bitcoin, corporations are now beginning to add substantial amounts of ETH to their balance sheets, viewing it as a strategic asset and a yield-bearing investment through staking.
Leading this charge is SharpLink Gaming, an online technology company that has made headlines with its aggressive accumulation of Ether. The company recently purchased an additional 77,210 ETH, worth approximately $295 million, in a single transaction. This purchase alone was more than the total net issuance of new Ether over the preceding 30 days. Following this acquisition, SharpLink's total holdings soared to over 438,000 ETH, valued at more than $1.69 billion. This makes SharpLink one of the largest corporate holders of Ethereum, second only to Bitmine Immersion Tech.
SharpLink's strategy is clear and ambitious. The company has filed to increase its stock sale from $1 billion to $6 billion, with the majority of the proceeds earmarked for further ETH purchases. The appointment of Joseph Chalom, a 20-year veteran of the world's largest asset manager, BlackRock, as its new co-CEO, lends further institutional credibility to its crypto-centric strategy. The company has also been vocal about its belief in the Ethereum network, with a recent social media post declaring, "Banks close on weekends. Ethereum runs 24/7." This sentiment captures the essence of why institutions are drawn to the programmable, always-on nature of the Ethereum blockchain.
Other companies, such as BitMine Immersion Technologies and the upcoming Ether Machine, which plans to list on Nasdaq, are also amassing significant ETH treasuries. BitMine has reported holdings of over 566,000 ETH, worth more than $2 billion. Collectively, these corporate players are creating a significant and sustained source of demand, locking up large portions of the circulating supply. This corporate buying spree is a powerful vote of confidence in Ethereum's long-term value proposition, extending far beyond its utility as a digital currency.
The torrent of institutional capital and corporate accumulation is vividly reflected in Ethereum's on-chain data. The network is buzzing with activity, providing a transparent window into the scale of the current buying pressure. One of the most telling metrics has been the explosion in on-chain volume. Over a recent three-week period, on-chain ETH volume surged by an incredible 288%, reaching a staggering $10.38 billion. This indicates a deep and liquid market with robust participation.
Even more compelling is the activity of large holders, colloquially known as "whales." Analysis of blockchain data reveals a sharp increase in the number of "mega whale" addresses—those holding 10,000 ETH or more. Since early July, over 170 new mega whale addresses have appeared on the network. This trend strongly suggests that the massive inflows from ETFs are not just being held by custodians but are being translated into direct, long-term accumulation by large, well-capitalized entities. These are typically "strong hands" that are less likely to sell in response to short-term market fluctuations, providing a stable base of support for the price.
Furthermore, the weekly volume of large transactions, defined as those exceeding $100,000, has hit its highest level since the peak of the 2021 bull run, totaling more than $100 billion in a single week. This explosion in whale activity, coinciding with Ethereum's price breakout into the high $3,000s, confirms that "smart money" is actively and aggressively positioning itself in the market. This is not the speculative froth of a retail-driven rally but the calculated maneuvering of institutional players.
Adding another layer to Ethereum's bullish case is a significant shift in the broader cryptocurrency market landscape: the steady decline of Bitcoin's dominance. Bitcoin dominance, which measures BTC's market capitalization as a percentage of the total crypto market cap, has been trending downwards. This indicates that capital is beginning to flow out of Bitcoin and into alternative cryptocurrencies, or "altcoins," with Ethereum being the primary beneficiary.
This phenomenon, often referred to as a "quiet takeover," signals growing confidence in Ethereum's relative strength. While Bitcoin has already set new all-time highs in the current cycle, Ethereum has yet to surpass its 2021 peak, suggesting it has more room to run. Analysts note that as Bitcoin's momentum has somewhat stalled, investors seeking higher returns are rotating into Ethereum, which offers a compelling combination of a strong narrative, institutional adoption, and significant upside potential.
The outperformance is stark when looking at recent returns. In the last 30 days, while Bitcoin posted respectable gains of around 11%, Ethereum surged by over 61%. This divergence is a classic sign of a market beginning to favor altcoins, a period often dubbed "altcoin season." Ethereum, as the leader of the altcoin pack, typically paves the way for broader rallies across the ecosystem. A rising Ethereum price and declining Bitcoin dominance create a fertile ground for other altcoins to flourish, with some analysts predicting double-digit returns for many smaller projects if Ethereum can successfully break the $4,000 barrier.
From a technical perspective, Ethereum's price chart is flashing multiple bullish signals, suggesting that the recent rally could be the start of a much larger move. Analysts are closely watching several key formations that have been developing over a long period. One of the most significant is a massive consolidation pattern. After a prolonged period of trading within a range, a breakout from such a pattern often leads to a powerful and sustained trend. Some analysts believe a breakout is imminent, with initial price targets set between $4,800 and $5,000.
Even more compelling is the challenge to a 3.7-year descending trendline. This long-term resistance has capped Ethereum's upward movements for years. A decisive weekly close above this trendline would be a major technical victory for the bulls, invalidating the long-term bearish structure and opening the door for a parabolic advance. Technical analysts often view the breach of such a long-standing trendline as a powerful signal of a major trend reversal and the beginning of a new bull market phase.
Should Ethereum successfully break out of its current consolidation and clear the $4,000 to $4,200 resistance zone, chart analysis suggests there is very little historical resistance until the $4,800 to $5,000 range. Some of the more bullish forecasts, looking at the ETH/BTC trading pair and other long-term models, even project potential targets between $7,300 and $10,000 in this market cycle.
Despite the overwhelmingly bullish picture, the path to new all-time highs is unlikely to be a straight line. The $4,000 level has proven to be a formidable barrier. Recently, Ethereum's price was firmly rejected near this psychological milestone, leading to a period of cooling volatility and raising concerns about a potential short-term selloff. The failure to break through has caused some buying pressure to weaken, and on-chain data has shown a temporary decrease in large whale transactions following the rejection.
This price action highlights the classic tug-of-war between buyers and sellers at a key resistance level. Some traders who have enjoyed the 75% run-up may be tempted to take profits, creating selling pressure. The Relative Strength Index (RSI), a momentum indicator, has also shown signs of being "overheated," suggesting that a period of consolidation or a minor correction could be healthy and necessary before the next leg up.
However, a key positive sign is that despite the rejection, buyers have not given up much ground. The price has continued to consolidate just below the resistance area, indicating that dips are being bought and that underlying demand remains strong. This type of price action, where an asset persistently hovers near a major resistance level without a significant pullback, is often a precursor to an eventual breakout.
Crucially, while retail sentiment and short-term trading metrics might show some hesitation, the institutional tide shows no sign of ebbing. Spot ETF inflows have remained consistently positive, providing a steady stream of buying pressure that counteracts short-term selling. This suggests that while there may be some turbulence in the immediate future, the larger, more powerful trend is being driven by long-term institutional accumulators who are less concerned with short-term price swings.
In conclusion, Ethereum finds itself at a historic crossroads, propelled by a perfect storm of fundamental and technical tailwinds. The narrative is no longer just about its technological promise as a world computer but about its emergence as a mature, institutional-grade asset. The vocal support of financial titans like Mike Novogratz, the verifiable flood of institutional capital through ETFs, and the strategic shift by corporations to hold ETH in their treasuries are creating a demand shock of unprecedented scale.
This is being met with a supply that is increasingly constrained, thanks to staking and the aggressive accumulation by these new, large players. On-chain data confirms this story, with volumes and whale activity reaching levels not seen since the last bull market peak. As Bitcoin's dominance wanes, Ethereum is stepping into the spotlight, ready to lead the next phase of the market cycle.
While the $4,000 resistance remains a key hurdle to overcome, and short-term volatility is to be expected, the underlying forces at play suggest a powerful current pulling Ethereum towards new horizons. The "quiet takeover" is becoming louder by the day. A breakout above $4,000 could unleash a wave of price discovery, potentially pushing Ethereum to $5,000 and beyond, and in the process, reshaping the very landscape of the digital asset ecosystem. The stage is set for Ethereum's ascent, and the world is watching.

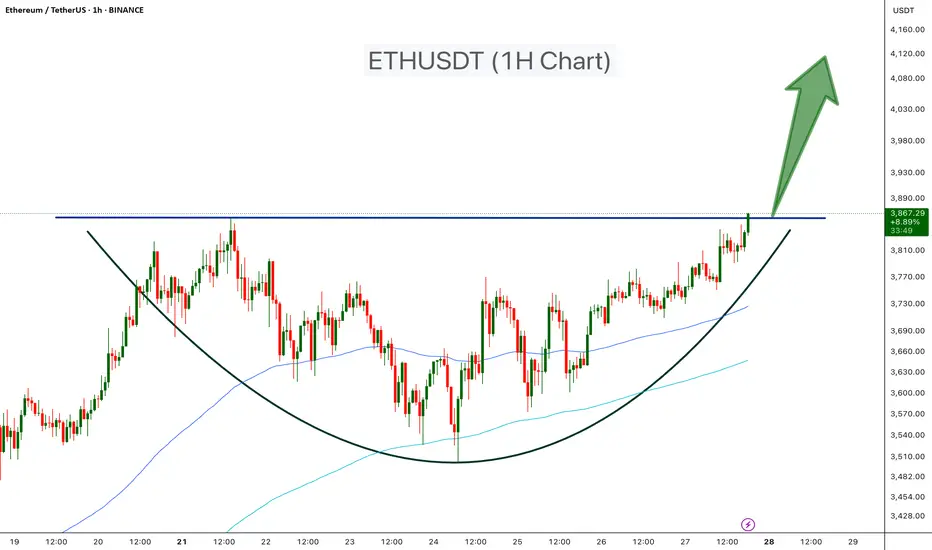
ETHUSDT Classic Cup PatternEthereum is forming a textbook Cup pattern on the 1H chart, signaling a strong bullish setup. After a rounded bottom forming the “cup,” ETH is now pushing toward the neckline resistance around $3,870. A confirmed breakout above this level could lead to a powerful upward move.
Cheers
Hexa
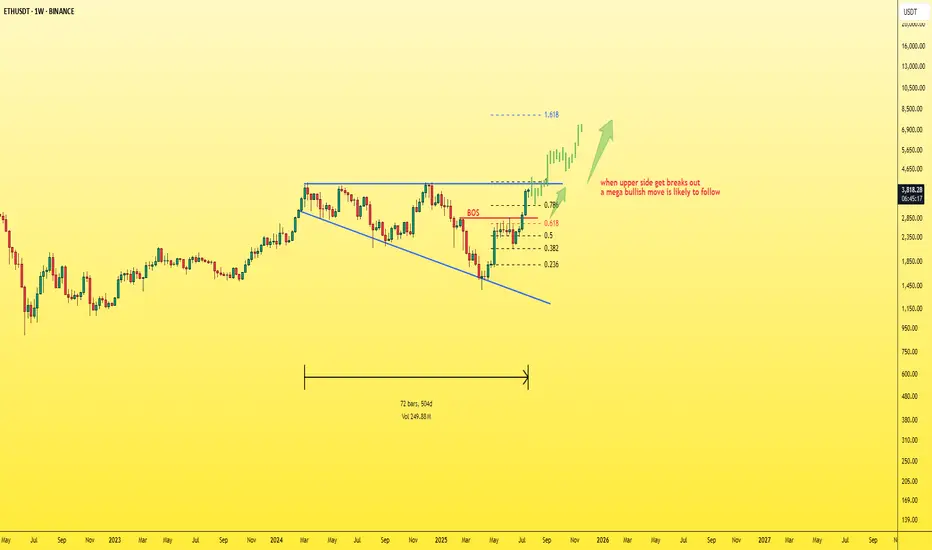
ETH - simple chart and mega moveEthereum is currently the strongest and most stable asset in the market, especially after many had lost hope in it.
Now, Ethereum is back with strength, and it’s just a few steps away from breaking out of the current pattern.
📈A breakout above the upper boundary will likely lead to a new all-time high (ATH) for ETH.
My projection: Ethereum could surpass $7,000 before the end of 2025.
Best regards:
Ceciliones🎯
#ETH Update #5 – July 27, 2025#ETH Update #5 – July 27, 2025
Ethereum is attempting to revisit the levels of its previous impulsive move without having completed a proper correction. The fact that Ethereum has not made a retracement around 3280 and is instead pushing toward a new ATH does not seem very healthy to me. If it had completed the correction, it would have also balanced an existing imbalance in the structure.
When we look at the recent candles, we observe a lack of volume. This volume weakness is not sufficient to break the resistance at the previous high. If Ethereum breaks the 3900 dollar resistance level with a strong candle, it could move toward the 4335 dollar zone.
However, it should not be forgotten that there is still an imbalance and a correction zone around 3280 dollars. If the price decides to return to that level, it would mean an approximately 15% pullback from here. This could pose significant risk for altcoins, and we might see corrections of up to 40% in some.
Ethereum is currently one of the riskier assets for either taking a long or short position. Therefore, I do not recommend opening any position at this stage.

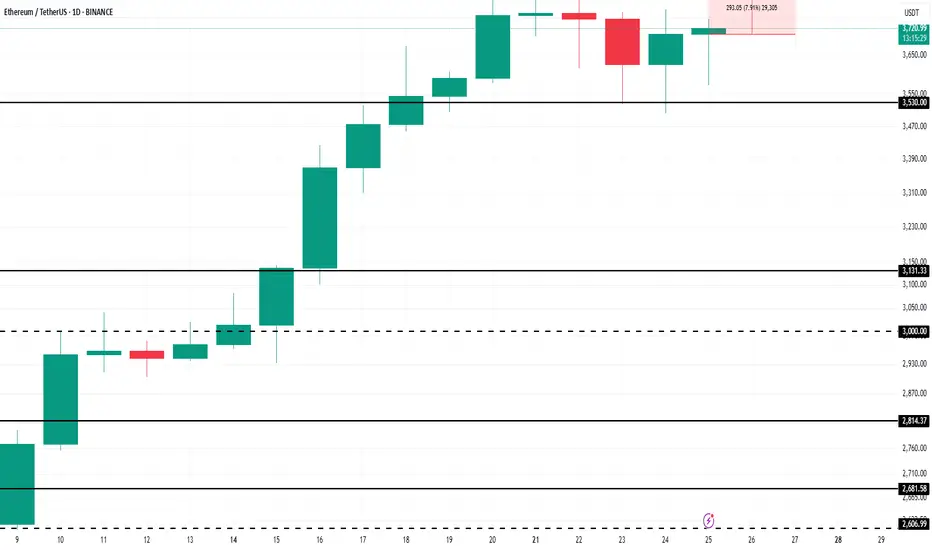
Ethereum’s $4,000 Target Alive as Historic Rally Signs EmergeBINANCE:ETHUSDT is currently trading at $3,680, just 9% away from the critical $4,000 resistance that many investors have been waiting for over the past seven months. The altcoin is expected to continue its upward momentum despite the recent consolidation, with the potential to breach the $4,000 mark soon.
Looking at broader technical indicators, the NUPL (Net Unrealized Profit/Loss) suggests that BINANCE:ETHUSDT is poised for a significant rally . The NUPL indicator, when reaching a threshold of 0.5, traditionally signals a pause in the uptrend, followed by a sharp rally.
$ BINANCE:ETHUSDT is currently nearing this threshold , which, in the past, has marked the beginning of powerful upward price action.
As long as BINANCE:ETHUSDT remains above its key support levels, the price is likely to surge toward $4,000 . If Ethereum can maintain its momentum, a breach of $4,000 could act as a catalyst for further gains.
However, should unforeseen selling pressure arise, $BINANCE:ETHUSDTprice could slip below the $3,530 support level. In such a scenario, Ethereum may fall to $3,131, invalidating the current bullish outlook. The key will be maintaining support and capitalizing on the retail-driven surge.
Ethusdt buy / long setupEth has a good pullback yesterday. Eth showing strong momentum against all the market. Long at cmp 3641, first tp is 3960 the next is 4.1k. must use sl.

Ethereum Breakout Could Spark the Next Altseason!A Massive Altseason Is Brewing… 🚀
Ethereum just flashed a major monthly breakout after printing a clean Morning Star reversal right at key support.
Now it's pushing against the upper resistance zone, a structure that held it back for over two years.
If CRYPTOCAP:ETH breaks and closes above this level, it won’t just be bullish for Ethereum — it could ignite the biggest altcoin season since 2021.
Why it matters:
📌 ETH is the heart of the altcoin ecosystem.
📌Historical breakouts like this led to 1500%+ moves.
📌The pattern and price action are lining up perfectly again.
Once Ethereum breaks cleanly above $4,000, expect altcoins to explode across the board — Layer 2s, DeFi, AI tokens, and even the meme coins could all start flying.
Keep your eyes on ETH. Its breakout is the spark… the altseason fire is coming.
DYOR | Not Financial Advice

ETH/USDT – Weekly Chart Analysis !! ETH/USDT – Weekly Chart Analysis
ETH is testing a major historical resistance between $3,700 – $4,000 (highlighted green zone).
A clean breakout above this level could push price toward the next key resistance at ~$4,660.
Previous accumulation zone around $2,400 – $2,800 (yellow box) now acts as strong support.
Long-term floor at $1,420 and $1,025, though currently far below.
Bullish Breakout Potential: If ETH sustains above the green resistance, it may retest $4,660+.
A failure to break above $4K could lead to a healthy pullback toward the yellow zone (~$2,800).
Stay updated and manage your risk accordingly.
DYOR | NFA

gold vs ethIf we follow this fractal, we should top around $4k and then a pullback to $3k followed by news highs in Q4

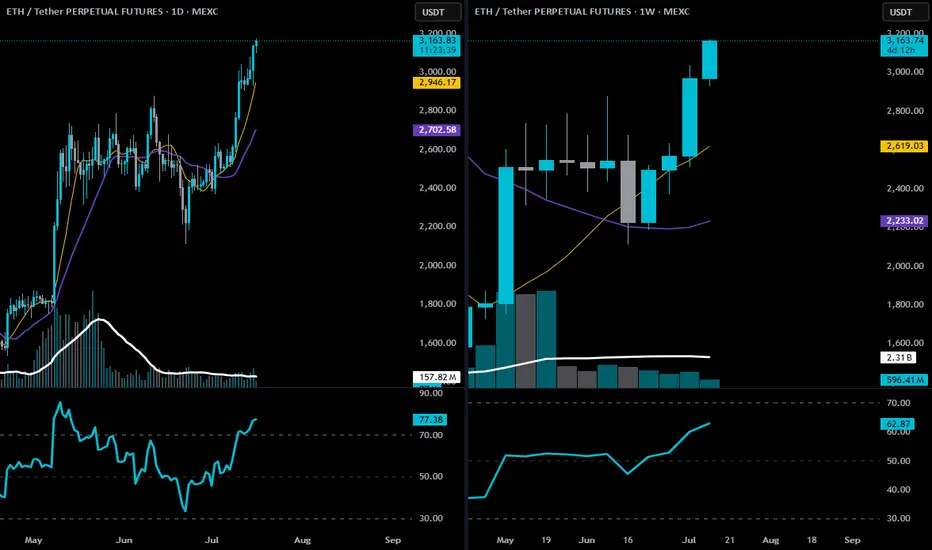
ETH-technical structure, momentum, and confirmation🕐 Daily Chart Analysis
Trend: Clear uptrend. Price is trading well above both the 9 EMA (gold) and 20 EMA (purple), with strong angle and separation.
Price Action: ETH is pressing into multi-month highs with no major resistance between here and the $3,350–$3,500 range.
Volume: Healthy increase in volume on bullish candles; recent bullish expansion looks organic, not low-volume driven.
RSI: At 77.15 — yes, overbought, but in a trending market, this is confirmation, not a sell signal. You want RSI to stay elevated during impulsive legs.
📅 Weekly Chart Analysis
Breakout Structure: This is the second full bullish candle after breaking out of a multi-month base ($2,800 range), following an accumulation period.
9 EMA Just Crossed Over 20 EMA: First time since early 2024 — bullish trend confirmation.
Volume: Large expansion bar from May shows institutional interest; current bar remains strong and building.
RSI: Pushing up to 62.75 — well below overbought, meaning there’s room to run.
🧭 Strategic Trade Plan (Swing Long)
✅ Bias: Long
Targeting $3,300–$3,500 with trailing logic to extend if momentum continues.
THIS IS NOT FINANCIAL ADVICE. Drinkin Smöökëē Whizkee. Edumacational Purpiz Only!
ETH-----Buy around 3600, target 3660 areaTechnical analysis of ETH contract on July 18:
Today, the large-cycle daily level closed with a small positive line yesterday, the K-line pattern continued to rise, the price was above the moving average, and the attached indicator was running in a golden cross. The general trend of rising is still relatively obvious. Recently, you can see that Ethereum is stronger than the big cake, and the continuous high-breaking prices are getting closer and closer to the previous historical highs. So this month there is a chance to touch or test; the short-cycle hourly chart rose strongly in the morning and broke the previous day's high position. The current price is above the moving average, and the attached indicator is running in a golden cross. The intraday and European sessions still depend on the trend of continuing to break high.
Today's ETH short-term contract trading strategy:
Buy in the 3600 area, stop loss in the 3570 area, and target the 3660 area;

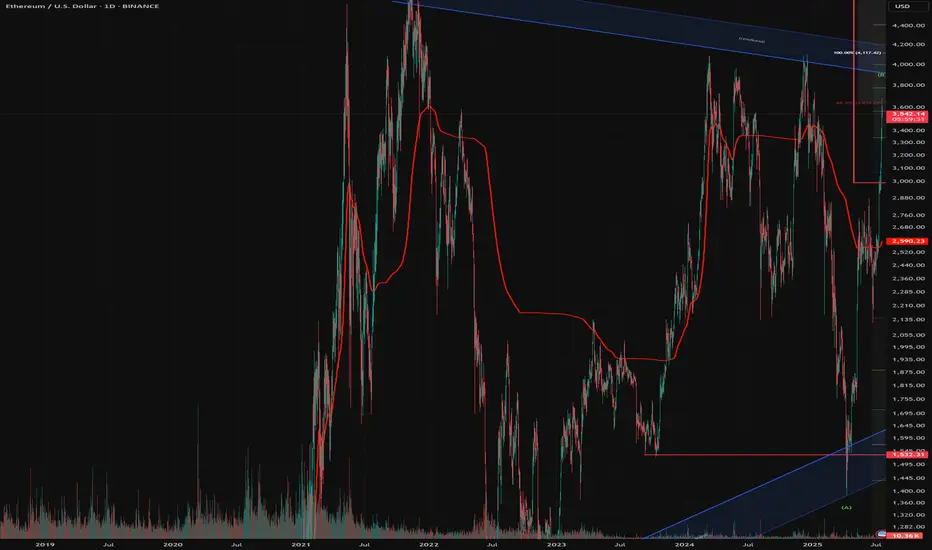
ETH is up about 50% Since June 2025Relying on the absolute intraday low from June to claim that ETH is “up 70%” is a textbook data‑skewing mistake often found in AI‑generated headlines. A more robust approach is to average prices over several days (or even a full week). On that basis, ETH has risen roughly 50% since June— not 70%. Don’t let a distorted headline push you into adding leverage through perpetuals just because your strategy’s returns lag spot performance; that reaction only compounds impermanent‑loss risk.

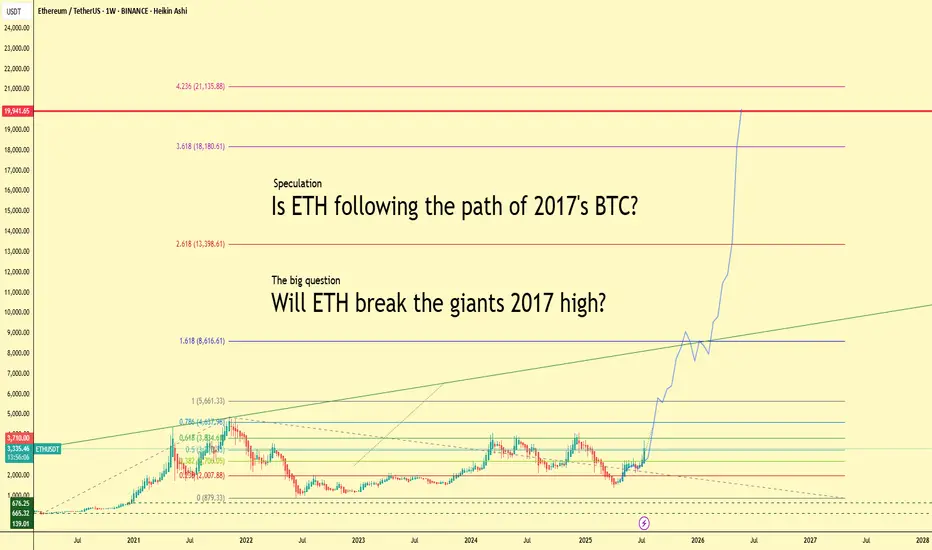
Will ETH Follow BTC’s 2017 Path? $20K in Sight?Ethereum is heating up — up more than 20% this week and currently trading above $3,300. But what if we told you this might just be the beginning?
This chart explores a bold yet exciting speculation:
👉 Is ETH repeating Bitcoin’s legendary 2017 run?
Back then, BTC went from obscurity to global headlines, smashing through $1k, then $5k, then $10k… and eventually peaking just below $20,000. Ethereum might just be lining up for a similar parabolic path.
🚀 Fibonacci Levels Say: Sky’s the Limit
The chart projects Fibonacci extensions up to:
1.618 = $8,600
2.618 = $13,400
3.618 = $18,180
4.236 = $21,135
Notice the key level: $19,941. That’s the legendary BTC high of 2017. Will ETH match or even surpass that milestone?
🧠 The Big Question:
Can ETH become the new “giant”?
While Bitcoin still leads the narrative, Ethereum’s ecosystem, real-world adoption, and institutional attention have never been stronger.
💬 Let’s Talk
Do you believe Ethereum is set to break $20K this cycle? Or is this just hopium and lines? Share your thoughts and let's compare notes.
#Ethereum #ETHUSDT #Crypto #Altseason #BTC2017 #Fibonacci #Bullrun #ETHBreakout #Parabola #CryptoSpeculation
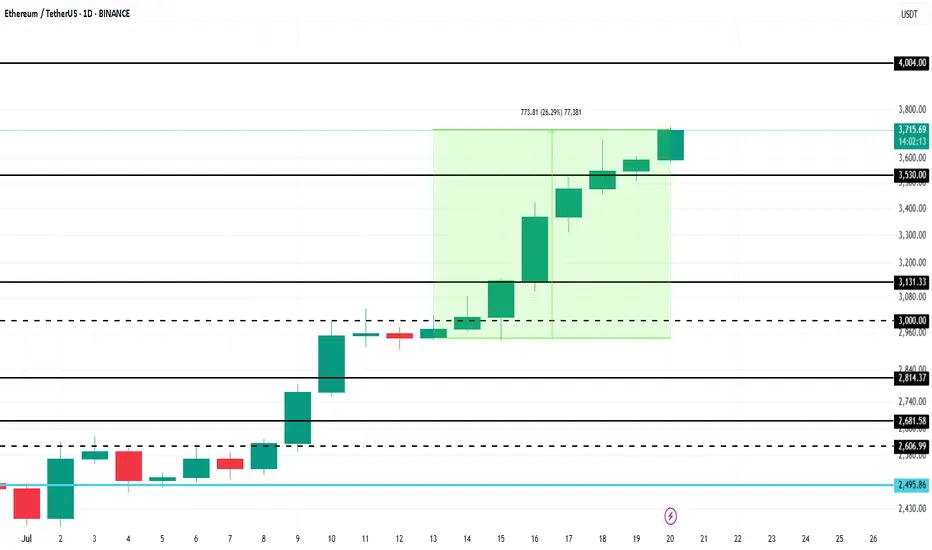
Ethereum Price Hits 6-Month High, Up Next $4,000BINANCE:ETHUSDT has managed to navigate recent market volatility with significant support from investors. As companies increasingly mirror Bitcoin’s corporate treasury use case, Ethereum is gaining traction.
BINANCE:ETHUSDT price surged 26% over the past week , reaching $3,715 and marking a 6-month high. The rally strengthened after ETH formed a Golden Cross last week. With this bullish momentum, Ethereum is now targeting $4,000 in the coming days, benefiting from investor confidence and growing institutional interest.
However, if BINANCE:ETHUSDT bullish momentum weakens and investors opt to sell, the price could decline to $3,131 . This would erase recent gains and invalidate the current bullish outlook.
ETHUSDT | Two Opportunities. One Smart Approach.I’ve been closely watching how buyers behave under the green line — and they’re clearly not backing down. But what really catches my eye is the blue box , a clean demand zone I’ve seen act as a launchpad in the past.
You don’t need to jump in blindly.
Depending on your risk appetite, both levels are valid. But if you wait for a 15-minute breakout confirmation on the low timeframe before acting on either, your odds of success increase significantly.
This is how I keep my win rate high, waiting for the market to prove itself first.
“I will not insist on my short idea. If the levels suddenly break upwards and do not give a downward break in the low time frame, I will not evaluate it. If they break upwards with volume and give a retest, I will look long.”
Most traders rush in. You wait smart. That’s the edge.
Choose wisely. Follow closely.
📌I keep my charts clean and simple because I believe clarity leads to better decisions.
📌My approach is built on years of experience and a solid track record. I don’t claim to know it all but I’m confident in my ability to spot high-probability setups.
📌If you would like to learn how to use the heatmap, cumulative volume delta and volume footprint techniques that I use below to determine very accurate demand regions, you can send me a private message. I help anyone who wants it completely free of charge.
🔑I have a long list of my proven technique below:
🎯 ZENUSDT.P: Patience & Profitability | %230 Reaction from the Sniper Entry
🐶 DOGEUSDT.P: Next Move
🎨 RENDERUSDT.P: Opportunity of the Month
💎 ETHUSDT.P: Where to Retrace
🟢 BNBUSDT.P: Potential Surge
📊 BTC Dominance: Reaction Zone
🌊 WAVESUSDT.P: Demand Zone Potential
🟣 UNIUSDT.P: Long-Term Trade
🔵 XRPUSDT.P: Entry Zones
🔗 LINKUSDT.P: Follow The River
📈 BTCUSDT.P: Two Key Demand Zones
🟩 POLUSDT: Bullish Momentum
🌟 PENDLEUSDT.P: Where Opportunity Meets Precision
🔥 BTCUSDT.P: Liquidation of Highly Leveraged Longs
🌊 SOLUSDT.P: SOL's Dip - Your Opportunity
🐸 1000PEPEUSDT.P: Prime Bounce Zone Unlocked
🚀 ETHUSDT.P: Set to Explode - Don't Miss This Game Changer
🤖 IQUSDT: Smart Plan
⚡️ PONDUSDT: A Trade Not Taken Is Better Than a Losing One
💼 STMXUSDT: 2 Buying Areas
🐢 TURBOUSDT: Buy Zones and Buyer Presence
🌍 ICPUSDT.P: Massive Upside Potential | Check the Trade Update For Seeing Results
🟠 IDEXUSDT: Spot Buy Area | %26 Profit if You Trade with MSB
📌 USUALUSDT: Buyers Are Active + %70 Profit in Total
🌟 FORTHUSDT: Sniper Entry +%26 Reaction
🐳 QKCUSDT: Sniper Entry +%57 Reaction
📊 BTC.D: Retest of Key Area Highly Likely
📊 XNOUSDT %80 Reaction with a Simple Blue Box!
📊 BELUSDT Amazing %120 Reaction!
📊 Simple Red Box, Extraordinary Results
I stopped adding to the list because it's kinda tiring to add 5-10 charts in every move but you can check my profile and see that it goes on..

MY VIEW ON ETH - BULLISH & BEARISHMy analysis of Ethereum (ETH): Bullish and bearish scenario
The analysis of Ethereum is currently quite complex. The price structure does not show clear impulses in the form of classic wave movements, but frequently overlapping patterns that indicate ABC correction waves.
I therefore present both my primary and an alternative scenario for a bullish (rising) and a bearish (falling) trend.
Primary bullish scenario:
Wave 2 seems to be completed at the lower end of the blue trend channel and at the 70.70-% FiB. We could currently be in red wave 3. However, the structure of this movement is more reminiscent of an ABC formation, which could indicate a weaker impulse.
Should the price break through the upper edge of the blue trend channel and exceed the 100% Fibonacci level at around USD 4,424, several important Fibonacci zones would converge in the “profit area” marked in red. In this case, a setback as part of the red wave 4 could not be ruled out.
Alternative (bearish) scenario:
It is possible that the blue V-wave could turn into a white ABC structure. In this case, an additional wave 4 would be omitted, which could result in a stronger sell-off.
Secondary scenario - bearish:
If Ethereum fails to play out the primary bullish count scenario, I expect that we will continue to be in an overarching correction phase. This assessment also fits in with the typical market slowdown during the summer months.
In this case, a green ABC correction could form, whereby wave C could theoretically still rise to the 100% Fibonacci level at USD 4,416. However, this would be an overextended wave B.
In addition, we are already in the area of the sales or profit zone, which indicates that only a limited rise is possible.
Subsequently, I expect a stronger downward movement towards the green buy area between the 1.618 Fibonacci level and around USD 1,866.
LEAVE YOUR COMMENTS AND ASSESSMENT
ETH Healthy Retest Before Next Rally!Ethereum continues to trade within a strong uptrend on the 1-hour chart, respecting the 100 EMA consistently throughout the rally. After a strong impulse move, the price is now consolidating near the recent highs.
ETH price could retest the 0.382 Fibonacci level and the 100 EMA before continuing upward. A successful retest would signal strength and could lead to a bullish continuation toward the $3900 - $4000 range.
Similar historical retests of the 100 EMA led to strong rallies, and we could see a repeat of that pattern if support holds.
Cheers
Hexa
BITSTAMP:ETHUSD CRYPTOCAP:ETH

ETHUSDTThis movement downtrend. If breake 2.790 movr to 3.500$ but breke 2.200 move trend to 1.500$.

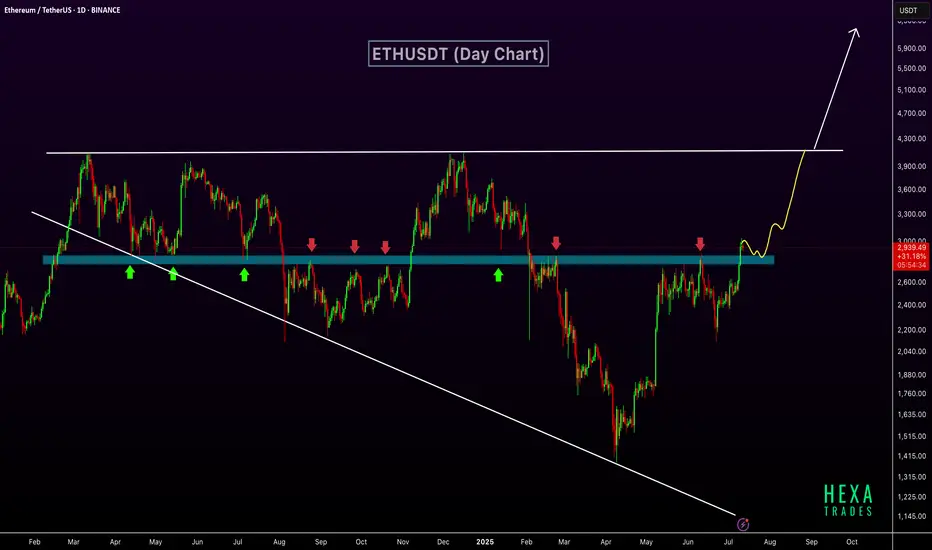
ETH Breaks Key Resistance – $6K Possible if Wedge BreaksETHUSDT has broken out above a key horizontal resistance zone that has historically acted as a strong support and resistance level. This zone, marked in blue, has seen multiple rejections and bounces over the past year, confirming its significance.
The recent breakout above this zone indicates a shift in market structure and suggests growing bullish momentum. The price action shows a clean move above resistance, with potential for a retest before continuing higher. The market is also forming a long-term broadening wedge pattern. The next target lies near the upper resistance of the wedge, around $4,000. If the price breaks above this broadening wedge, it could open the path toward the $6,000 level.
Regards
Hexa
$ETH Ethereum Market Outlook – July 2025Ethereum Market Outlook – July 2025
Brought to you by ProfessorXtrader
🚀 Ethereum Breakout Confirms Multi-Year Bullish Setup
Ethereum ( CRYPTOCAP:ETH ) has officially broken out of a multi-year consolidation range, signaling a strong bullish cycle ahead. With the current price sitting at $3,645.50, ETH has posted a remarkable 46.65% monthly gain as of July 18, 2025.
This move sets the stage for a multi-tiered upside potential — here’s what the chart is telling us.
📊 Key Levels & Targets
🔸 Previous Consolidation Range (2018–2021)
ETH spent over three years capped under the ~$4,884 level, forming a solid accumulation base.
🔸 Breakout Zone
Support: $1,150 – $1,250
Confirmation of Cycle Shift: Price now trading well above breakout zone.
🎯 Upside Targets (Ethereum)
1st Target:
📍 Price: $7,387.56
📈 Potential Gain: ~100%+ from breakout zone
2nd Target:
📍 Price: $11,394.14
📈 Potential Gain: ~180%
Final Exit (Major Reversal Zone):
📍 Price Range: $15,443.81 – $15,477.64
🚨 Total Gain Potential: ~280% from breakout
📌 The area between $15.4K to $18K is marked as the Major Reversal Zone, a region where profit-taking and trend exhaustion are highly likely.
📈 Market Interpretation
Bullish Breakout: Long-term resistance is now support.
Volume & Momentum: Strong monthly candle with expanding volatility confirms conviction.
Structure: Targets are based on clean technical projections, Fibonacci expansions, and market psychology.
🔔 What to Watch Next
📅 Monthly Close above current levels will confirm the breakout.
🔍 Monitor for rejection signals near the first target.
📉 Place trailing stops as we approach the major reversal zone.
💡 Pro Tip from ProfessorXtrader
"The biggest profits in crypto are made during clean breakouts from multi-year ranges. ETH is entering that phase now — plan your targets and protect your capital as you climb."
