Ethereum crypto strong demand at $2,880 playing outEthereum tapped a major demand zone at $2,880, and the reaction is clear: buyers stepped in, just like they usually do when a clean, fresh imbalance takes control. The last time ETH reacted to a similar structure on the bigger timeframes, we saw extended bullish legs unfolding week after week.
Right now, the question is simple:
Will this demand level hold long enough to push ETH toward $4,120 and beyond?
Based on the current imbalance structure, the answer leans strongly toward yes.
Ethlong

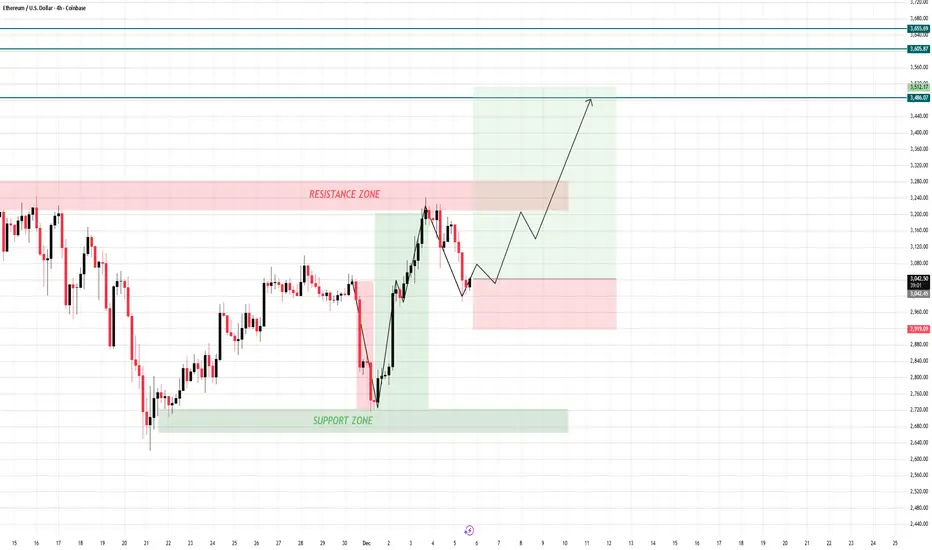
The Trap Is Set — Ethereum Preparing for Liftoff🚀 ETHEREUM 4H OUTLOOK – ACCUMULATION BEFORE BULLISH EXPANSION
1. Market Structure Overview
- ETH is currently respecting the broader bullish structure after rejecting from the upper Resistance Zone (≈ 3,180–3,220) and pulling back into the mid-range.
- The recent drop is not a reversal; it is a healthy retracement into demand after an impulsive rally.
- Price is now stabilizing above the Support Zone (≈ 2,940–2,970) — the key area that previously launched a strong bullish leg.
✔ The trend remains bullish on higher timeframes
✔ Current structure shows a corrective pullback into liquidity
✔ Bullish orderflow still intact as long as support holds
2. Scenarios Ahead
🔹 Main Scenario (High Probability) – Bullish Continuation
If price holds above the support area and continues forming higher lows:
→ ETH is expected to bounce and build structure toward the upside.
Upside Targets:
🎯 3,460
🎯 3,605
🎯 3,655 (major liquidity + extended target)
The drawn projection on your chart (higher low → stair-step structure → rally) is perfectly aligned with bullish continuation.
🔹 Sub Scenario (Low Probability)
If ETH breaks below 2,940, structure shifts short-term bearish:
→ Deeper pullback into 2,850 – 2,880
→ Only triggered if a clean break + close below support happens.
Currently, there is no confirmation for this scenario.
3. Summary – Structure & Liquidity Alignment
ETH continues to follow a textbook bullish model:
✔ Corrective pullback into demand
✔ Accumulation above support
✔ Clean rejection from supply, but no trend reversal
✔ Bullish projection remains valid toward liquidity clusters above
The move is simply compression → accumulation → expansion.
4. Intraday Trading Setups (Based on Chart Structure)
📌 SETUP 1 – Intraday Buy Setup (Preferred Scenario)
ETH BUY ZONE:
👉 2,940 – 2,970
Take Profit:
🎯 3,120 – 3,180 (short-term)
🎯 3,460 – 3,605 (swing)
Stop Loss:
❎ 2,915
⚠ Manage risk properly — crypto volatility is high.
📌 SETUP 2 – Intraday Sell Setup (Only for Countertrend Traders)
ETH SELL ZONE (Resistance):
👉 3,180 – 3,220
Take Profit:
🎯 3,050 – 3,000
Stop Loss:
❎ 3,245
⚠ Countertrend trades should use smaller sizing.
Stay patient. The market always rewards those who wait for price to come to their zone — not those who chase it
ETH/USDT 4HOUR CHART UPDATE !!ETH/USDT is retracing after being rejected by the 3,150–3,200 resistance area and the descending 200 MA, but is still trading within a larger contracting structure with higher lows forming.
The price broke above the short-term downtrend line but quickly failed near the green moving average and is now sliding back toward the confluence of old diagonal resistance and rising support around 2,850–2,900.
This zone is the first major demand zone; below it, the next major support on this chart is the wide yellow block at 2,500–2,550, where the previous strong rally began.
ETH moved sideways down inside the converging trendline, forming a base around 2,800–2,900, before a sharp move higher toward 3,300+ if buyers defend that area.
A clean 4H close below the rising lower trendline, and especially below 2,500, would invalidate the bullish consolidation idea and create room for a deeper correction towards previous higher-timeframe support.
DYOR | NFA

On the 5th Day of ETHmas...a Pulllback to the H4 Demand Zone!ON THE 5TH DAY OF ETHMAS, MY TRUE LOVE GAVE TO ME....A PULLBACK TO THE H4 DEMAND ZONE....
OK, so our ETH trading plan is playing out as expected. Please see my previous posts from the first part of November until now to see how we got here. Since the last post, we have pushed up to our first TP Target and moved all the way up to the Daily Zone. This is a Daily Supply Zone, so it is expected to show some resistance.
Where are we now:
At this point, the market is struggling between the H4 BOS UP and Return to the Source that signaled its time to buy again...and this Daily Supply Zone that is saying..."Not so fast...you have to get past ME first".
Why This Matters:
A Daily Supply Zone is still stacked with sellers waiting to push the price back down. So, it will take some strength from this H4 momentum to break past the Daily Zone. It almost never does this the first time, and is extremely rare to do it without building a solid floor on the way up. All we are seeing right now is ETH pulling back to the H4 Demand Zone. We had several strong H4 bull candles up, and there was not a Demand Zone in place until this one around 2975 -3025. The market HAS to pull back to these type of zones for the strength to continue.
What to Expect from here:
At or inside of this H4 Demand Zone, we need to see confirmation that the buyers are really ready to push this back up. We need to watch the 15 min time frame and look for a 15 Min BOS UP outside of this H4 Demand Zone, Plus a strong retest and bullish rejection out of the zone. The 15 min will show us this first. Ideally, we also want to see an H4 Candle close back up above this zone and retest as well. With that signal, we are back to the bullish trend and headed for the H4 Supply Source as shown before...(3450 - 3560).
Now, the Daily Supply Zone that threw this down to start with will STILL NEED TO BE TESTED AGAIN, so expect more resistance if we push back up to it (3108 - 3215). We need to break through the bottom level first and then retest the top (this recent high of ~3215).
A rejection again at this Daily Supply Zone is going to lead to all future Christmas gifts being cancelled. OR a break of this H4 Demand Zone were in now will lead to the same. This is a MUST HOLD area for the bulls now! If this zone fails...."Nobody's Gettin' Nuttin for ETHmas!"

Small scalp degen move. This is an intraday scalp for degens who like to squeeze the juice. Fundamentals back the theory due to accumulation during a bear channel.

ETHUSD - Bullish Setup with Clear Risk-RewardTrade Setup:
Entry Point:
Enter at the price level of 3,020 only.
Stop-Loss:
Set the stop-loss at 2,965.86 (below the recent low), a 1.79% risk.
Target:
The target for this trade is 3,208.39, providing a potential upside of 5.17% (around 156.23 points).
Risk/Reward Ratio:
The setup offers a 3.01 risk/reward ratio—great potential for reward compared to risk.
📈 Why This Setup?
This trade has a solid risk-to-reward profile, with a clear entry point, stop-loss, and target.
The entry zone aligns with current market structure, and the target is based on key price levels.
💡 Trading Tip:
Stick to your risk management plan. Adjust the trade if market conditions change. Always be ready for any market movements!
Let’s see how this setup unfolds! 🔥
#ETHUSD #Crypto #Trading #TechnicalAnalysis #CryptoTraders #ETH #TradeSetup #RiskManagement

EthereumETHUSD
- Falling Wedge as an corrective pattern in Long Time Frame
- Demand Zone
- Order Block
- Completed " 123 " Impulsive Waves
- Fibonacci Level - 38.20% / 50.00%

#ETH/USDT (1h) (spot)#ETH
The price is moving in a descending channel on the 1-hour timeframe. It has reached the lower boundary and is heading towards breaking above it, with a retest of the upper boundary expected.
We have a downtrend on the RSI indicator, which has reached near the lower boundary, and an upward rebound is expected.
There is a key support zone in green at the 2960 price level. The price has bounced from this zone multiple times and is expected to bounce again.
We have a trend towards stability above the 100-period moving average, as we are moving close to it, which supports the upward move.
Entry price: 3000
First target: 3033
Second target: 3080
Third target: 3140
Don't forget a simple principle: money management.
Place your stop-loss below the support zone in green.
For any questions, please leave a comment.
Thank you.

ETH/USDT 1DAY CHART ANALYSIS !!ETH/USDT on the 1D chart is in a corrective downtrend but currently bouncing toward a major resistance supply zone around 3,500–3,700 USDT.
Price broke below the rising trendline and retested lower, confirming a shift from a strong uptrend to a corrective phase; the main support below is the 2,400–2,550 demand area where the last major rally started.
Above, the grey 3,500–3,700 band is a strong supply/resistance zone formed by prior consolidation and distribution before the last drop, while the top range resistance sits near 4,800.
Bull case: If bulls can push price into the grey zone and break/close decisively above it, structure improves, and ETH can target the upper range toward 4,400–4,800 again.
Bear case: Rejection from the grey zone would likely send ETH back down toward the yellow 2,400–2,550 support, and losing that opens room for a deeper slide toward the 1,400 and 1,000 higher‑timeframe supports marked below.
DYOR | NFA

ETHBTC: Trend-Line Break to outperform BTCThis weekly chart maps ETH performance relative to Bitcoin over the last few years and highlights a long, persistent downtrend. The red line captures the major descending resistance that has capped every significant ETHBTC rally since 2022, while the blue line marks the latest corrective downswing inside that broader structure.
The recent move forms a series of lower highs and lower lows against Bitcoin, compressed under the blue trend line. If price breaks and closes above this blue line, it would signal that the current micro downtrend is over and that ETH is starting a new leg of outperformance versus Bitcoin.
Such a breakout often acts as confirmation that capital is rotating back into ETH, favoring ETH‑heavy allocations.
Above, the red trend line remains the key macro resistance and a logical first upside objective for any ETHBTC recovery. This line has rejected multiple rallies in the past, so even if price breaks the blue trend line and accelerates higher, the red line is where many traders will look to take profits or at least tighten stops, expecting potential rejection.

I'm Dreaming of a White (Bullish) ETHmas!!!!OK, so December is here and ETH has been playing out perfectly. These sharp moves up and down have been all part of the market moving the way the market moves! As we've said before....forget about the talks of Tariffs, Shutdowns, Microstrategy delistings, etc. This market is moving according to solid market structure that we follow and teach. Please see our last Postings on ETH throughout November to see how we've projected these moves almost to a T.
Where are we now?:
At the last post, ETH had made an H4 Break of Structure (BOS) Up, signaling that we were finally seeing either an end, or at least a significant slow down to this bleeding. As expected, this H4 BOS up was going to drive the price back down once more to the H4 BOS Source (~2650 - 2750) for a strong buy. The market fell exactly to this range, and we saw an immediate bullish response back up. This bull push has led us back up to the top of the H4 Supply Zone for a retest.
What to look for next?:
Now that we are back to this H4 Supply Zone, many may be expecting another hard slap from the Bears, BUT, the market has already tipped its hand by giving us that initial BOS Up. We returned to the Source of that break for strength, so there is VERY LITTLE chance that this H4 Zone will hold the price anymore. In fact, the next target is the H1 Supply Source (3155 - 3220), which is an internal structure zone that still will not stop the price. The market is headed for the H4 Supply Source (3450 - 3560) for the 1st Real and Significant test of whether the Bull Run has resumed. A Strong test of this area is the determining factor. If we get a break above and retest of this zone, there is literally nothing to stop ETH from returning to the Daily Support - Now Turned Resistance Zone of 4,000 - 4,100.
So, Will there be a White Christmas for ETH?:
The H4 is pretty much driving the action right now, so any trades should be focused on that time frame until we hit the higher Daily Zone mentioned above. Expect the price of ETH to keep climbing through December, at least up to these zones. It could take a few days or even weeks to make this progress up, but the market has already signaled that it is coming.
Shorter trades opportunities should be abundant on the 15 min as the market makes its way up. Look for 15 Min Demand Zones and wait for the pullbacks to those zones to join the trend.

ETHUSD 1H — Short Opportunity After Channel BreakCOINBASE:ETHUSD
Price is trading inside a broad descending structure, and the recent move appears corrective, forming a rising channel. This type of structure often represents distribution before continuation lower.
A sweep into the 3,250–3,320 supply zone aligns with previous imbalance and trendline rejection. If the price rejects this zone with momentum, the bearish continuation setup becomes valid.
Key Scenarios
❌ Bearish Case (Primary Setup) 📉
Ideal Entry: 3,250–3,320 Zone (Supply)
→ 🎯 Target: 2,700–2,650 (Liquidity Sweep + Demand Zone)
→ 🛑 Stop Loss: Above 3,380
Confirmation triggers:
• Break of rising channel
• Bearish engulfing candle
• Wick rejection into the zone
Levels to Watch
Type Price
Short Entry 📍 3,250–3,320
Target 🎯 2,650–2,700
Stoploss ❌ 3,380
Invalid if Broken Trendline + Structure Flip
⚠️ This analysis is for educational purposes only — not investment advice.

ETH Demand Zone Activated: Trend Shift or Dead Cat?CRYPTOCAP:ETH 3Days Technical Analysis:-
ETH is showing a steady bounce after tapping the 0.618 Fib level, which aligns perfectly with the FVG (green zone) acting as a strong demand area.
Price reclaimed the trendline breakdown region and is now holding above the key support zone.
A sustained move above $3,175 (0.5 Fib) could open the door for a retest of $3,596 (0.382 Fib).
Structure will remain intact as long as ETH stays above the FVG block.
Levels to watch:
• Support: $2,750 – $2,850 (FVG / 0.618 Fib)
• Resistance: $3,175 → $3,596
DYOR / NFA
Please hit the like button if this post helped you in any way.
Thank you.
#PEACE

ETH : SELL MARKET!!!Hello friends
Well, as you can see, we are in a very strong downtrend and the sellers have full control.
Now, any price increase can be a selling opportunity, until the buyers show strength, we cannot say that the trend has changed...
Of course, we are also at important support and we need to see whether buyers support the price or not. Until then, we will not trade on guesswork and predictions.
This analysis is purely technical and is not a buy or sell recommendation, so please exercise your risk and capital management.
*Trade safely with us*

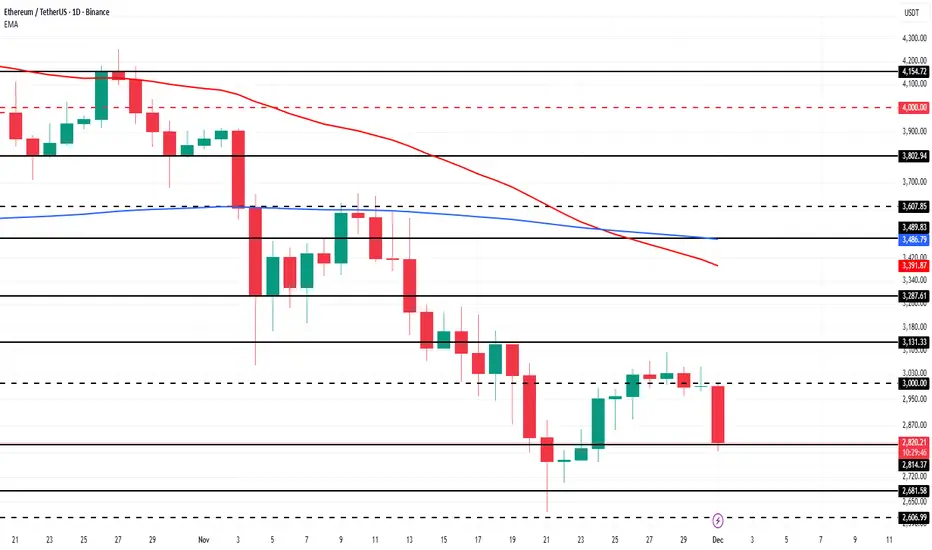
Ethereum Price Prediction: Can New Holders Fill the LTH Gap?Ethereum is trading at $2,805 at the time of writing, reflecting a 6% daily decline. The asset is sitting just below the $2,814 resistance level after its latest failed attempt to break through $3,000.
Based on current sentiment and market structure, ETH could stabilize and attempt a rebound, but a strong recovery will require consistent investor support. In the near term, Ethereum will likely fluctuate between $2,814 and $3,000 as it searches for direction.
If bullish momentum strengthens and fresh demand remains steady, Ethereum could finally break above the $3,000 barrier. A successful breach would pave the way for a move toward $3,131 and potentially $3,287, invalidating the short-term bearish thesis.

$ETH, $4.7K+ Before End of 2027? Retracement Potential?Ethereum is one of those that I am neutral on but invested for long term holds. They have a monopoly on tokenization, yet at the same time, the whole purpose of Ethereum has changed dramatically.
The PoS transition when Ethereum Classic was the original Ethereum and Ethereum PoW is currently the "decentralized newer Ethereum" have left various technologist confused along with the removal of the Ropsten testnet. This has shown Ethereum to be much more centralized than promised and it is entering muddy waters in that sense.
Likewise, can Ethereum differentiate itself from Namecoin, Peercoin and these original PoS forks who got outpaced? Ethereum's technical transition also emphasizes the need for subnets, rollups and speed. Currently they are competing against Solana as well as other players including Z-Cash or minimal small players like Celo and Cardano. The technical differentiation needs to be expanded however in order to allow for scalability. Likewise, Ethereum is still prime in terms of PoS and name-brand but may not be prime in terms of technology.
That said, the long-term potential is still there and Ethereum has a hard to replace developer ecosystem. The patterns when considering fib retracement along with the past cipher and PnL setup showcase the potential of a $4.7K price point by October 2027. As always, none of this is investment or financial advice. Please do your own due diligence and research.

BMNR HIGH PROBABILITY LONG SETUP SOON!!!!🚨 BMNR HIGH PROBABILITY BUY SETUP 🚨
* Here We Can See Clearly The Next Potential Moves For BMNR Coming Hours/Days.
* Keep Your Eyes Close On Your Trading Positions.
* Happy PIP Hunting Traders.
FXKILLA.

ETHEREUM HIGH PROBABILITY LONG SETUP SOON!!!🚨 ETHER HIGH PROBABILITY BUY SETUP 🚨
* Here We Can See Clearly The Next Potential Moves For ETHUSD Coming Hours/Days.
* Keep Your Eyes Close On Your Trading Positions.
* Happy PIP Hunting Traders.
FXKILLA.

3 Altcoins To Watch In The First Week Of December 2025Ethereum is a key altcoin to monitor this week as it approaches the Fusaka upgrade, scheduled to go live on December 3. This marks its second major upgrade of the year following Pectra and aims to strengthen the network’s long-term scalability.
Fusaka is designed to help Ethereum support high transaction throughput from layer-2 chains by implementing 12 Ethereum Improvement Proposals. The upgrade could lift ETH from its $2,814 support level toward $3,000. Reclaiming that level is essential for a push toward $3,131 and a broader recovery.
If bearish momentum continues and Ethereum reacts negatively to the ongoing Death Cross indicated by its EMAs, ETH may lose support. A fall below $2,814 could send the price toward $2,681, invalidating the bullish thesis and signaling deeper downside risk.
Ethereum (ETHUSDT): Approaching a Major Turning PointHI!
Trend Structure
Since mid-October 2025, ETH has been trending inside a well-defined descending channel, forming consistent lower highs and lower lows. The break of the previous bullish trendline back in July 2025 confirmed the shift into a corrective phase.
Key Support Zone (S&D)
Price is now around $2,730 (Nov 2025) and heading toward the crucial $2,450–$2,300 S&D zone, a strong support area that held the market firmly between May and July 2025.
Expected Price Behavior
A final liquidity sweep toward $2,300–$2,200 is possible before any sustainable upside move. This aligns with the lower boundary of the descending channel.
Deeper Support (DP)
If this level fails, the next major demand sits at $1,950–$1,800, last touched in March 2025.

ETH BREAKOUT: DON’T MISS THE NEXT BIG MOVE!📌 ETH/USD MARKET ANALYSIS – 30M (Professional Trader Style)
1. Overall Market Structure
- Price has been consolidating inside a descending channel.
- Forming consistent lower highs – lower lows, but selling pressure is weakening near the demand zone.
- Finally, price created a rectangle compression and then broke out aggressively above the descending trendline.
2. Key Zones
✔ Demand Zone (Strong Support): 2980 – 3010
Multiple rejections + strong bullish reactions → buyers clearly defend this area.
✔ Supply Zone (Key Resistance): 3065 – 3090
Price is approaching this zone again, but momentum suggests a high probability of BREAKING THROUGH.
3. Breakout Confirmation
The breakout candle shows:
- Strong bullish body
- Increased volume
- Clear break of previous lower high → CHOCH (Change of Character)
This signals that ETH is transitioning from a correction phase into a renewed bullish trend.
4. Trading Plan (Price Action Style)
📌 Primary Scenario – BUY the Retest
Wait for price to pull back into the broken supply zone (now a demand flip) at 3065–3075.
Enter BUY when you see:
- Rejection wicks
- Bullish engulfing
- FVG reaction
- Or any PA confirmation
🎯 TP1: 3120
🎯 TP2: 3160
🎯 TP3: 3200+
⛔ SL: Below 3045 (below breakout structure)
5. Why This BUY Setup Is High Probability
✔ Clean breakout of the descending channel
✔ Strong momentum push (not a weak fake-out)
✔ Beautiful defense at demand zone
✔ Trendline tested 3 times → valid breakout
✔ Market structure shift from bearish → bullish
6. Pro Tips
Don’t FOMO buy the breakout candle
Wait for a clean retest for better R:R
Focus on zone reaction + CHOCH + bullish momentum
Stay patient. The market always rewards disciplined traders.

Selena | ETHUSD 1H – Bullish Continuation SetupCOINBASE:ETHUSD
The recent rejection from the upper trendline created short-term corrective movement. Liquidity sweeps below minor support hint at accumulation, and as long as price remains above the invalid zone at 2899, bullish momentum is favored. Holding demand could fuel another expansion toward the next resistance block.
Key Scenarios
✅ Bullish Case 🚀
Hold above Demand Zone (≈ 2990–3020) →
→ 🎯 Target 1: 3110
→ 🎯 Target 2: 3180
→ 🎯 Target 3: 3220 (Top Resistance)
❌ Bearish Breakdown 📉
Break below 2899 invalidation zone
→ Potential retracement toward 2755 – strong support zone
→ Deeper demand sits near 2621 if structure fully collapses.
Current Levels to Watch
Resistance 🔴: 3110 | 3180 | 3220
Support 🟢: 3020 | 2899 | 2755
⚠️ Disclaimer: Educational analysis only. Not financial advice.

Selena | ETHUSD 2H — Bullish Momentum Retest Setup |COINBASE:ETHUSD
After a strong sell-off, ETH formed a base around $2620 and reclaimed structure. The recent breakout and consolidation suggest accumulation before continuation. As long as price holds above $2940–$3000, bullish continuation remains favored toward the next supply zone
Key Scenarios
✅ Bullish Case 🚀
If price holds above $2940–$3000 support:
🎯 Target 1: $3200
🎯 Target 2: $3350–$3450 (major supply zone)
❌ Bearish Case 📉
A clean break below $2940 may invalidate the bullish structure and open deeper retracement.
Current Levels to Watch
Support Zone: $2940–$3000
Rising Channel Support
Liquidity Target: $3350–$3450
⚠️ Disclaimer: This analysis is for educational purposes only. Not financial advice.
